PDF 原檔:260608_citi_largan-UG_original.pdf
原始內容
(RIC: 3008.1W, BB: 3008 11)
TWD
3,750
3,500
3,250
3,000
2,750
2,500
2,250
2,000
1,750
08 Jun 2026 04:01:46 ET │ 18 pages
Jun
Sep
Dec
Mar
Largan Precision (3008.TW)
Addressing CPO Opportunity, Semiconductor-Level Precision Becomes Key Advantage for Largan; Upgrade to Buy
CITI'S TAKE
At Computex 2026, Largan showcased its optical solution for CPO and expects the sample to be ready in late 2026. Assuming it gets 10% market share with CPO in bigger volume in 2028, we estimate revenue contribution from optical component & fiber array solution to reach 20% in '28. As optical interconnects move closer to semiconductor packaging, manufacturing precision requirements have tightened dramatically to semiconductor-level accuracy of approximately 0.3 um. With automation expertise and selfdesigned equipment/manufacturing process, Largan is confident that its PMLA solution could be a breakthrough for current microlens and optical prism solutions for CPO. Upgrade to Buy and lift TP by 74% to NT$5,325 (25x '27E/28E EPS; prev. 15x '26E PE). We add a 30D upside Catalyst Watch.
Photonic Module Lens Assembly (PMLA) - integrates collimator, reflector and optical alignment structure into a single component -Largan demonstrated its PMLA technology, which combines multiple optical surfaces-including antireflective coatings, reflective turning surfaces, and pin-hole optics-into a very compact footprint, enabling precise laser routing into IC IO. While this integration simplifies the optical path and reduces assembly complexity, it also shifts the manufacturing challenge toward advanced lens processing and molding technologies capable of meeting semi-grade tolerances. We believe Largan's expertise in optical, automation and equipment will support its CPO scale build-up.
Multi-Layer Fiber Architecture Enables Higher Density and Scalability -Traditional fiber array (FA) assemblies accumulate tolerance errors from fibers and glass grooves, resulting in alignment variation. To overcome this limitation, Largan developed a proprietary multi-layer stacking technology that compensates assembly tolerances and eliminates the need for an upper cover structure. At Computex, Largan demonstrated four-layer stacking with ten fibers per row, with enhancement to 0.3 um precision in the near term. Moreover, the multi-row architecture transforms optical connectivity from a linear structure into a planar one, significantly increasing IO density and optical throughput while simplifying module assembly. Largan is initially focusing on supplying core optical components, positioning itself to scale production rapidly and capture market share in nextgeneration optical interconnect applications.
Earnings Summary
| Year to 31Dec | Net Profit (NT$M) | DilutedEPS (NT$) | EPSgrowth (%) | P/E (x) | P/B (x) | ROE (%) | Yield (%) |
|---|---|---|---|---|---|---|---|
| 2024A | 25,915 | 194.17 | 44.8 | 18.2 | 2.5 | 14.8 | 2.4 |
| 2025A | 21,275 | 159.4 | -17.9 | 22.2 | 2.5 | 11.3 | 2.3 |
| 2026E | 25,577 | 191.63 | 20.2 | 18.4 | 2.4 | 13.2 | 2.7 |
| 2027E | 25,579 | 191.65 | 0 | 18.4 | 2.3 | 12.7 | 2.7 |
| 2028E | 31,910 | 239.09 | 24.8 | 14.8 | 2.1 | 14.7 | 3.4 |
Source: Powered by dataCentral
See Appendix A-1 for Analyst Certification, Important Disclosures and Research Analyst Affiliations.
n Buy ↑ from Neutral
Catalyst Watch: Upside
Price (08 Jun 26 13:30)
NT$3,535.00
Target price
NT$5,325.00↑
from NT$3,060.00
Expected share price
return
50.6%
Expected dividend yield
2.3%
Expected total return
52.9%
Market Cap
NT$462,372M US$14,695M
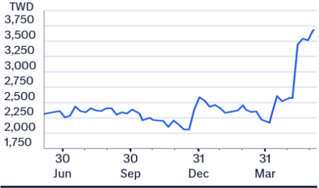
Price Performance (RIC: 3008.TW, BB: 3008 TT)
Laura (Chia Yi) Chen AC
+886-2-8726-9090 laura.cy.chen@citi.com
Jack Chen +886-2-8726-9091 jack1.chen@citi.com
Nicholas Lai +886-2-8726-9093 nicholas.lai@citi.com
| 3008.TW:Fiscalyearend31-Dec | Price: NT$3,535.00; TP: NT$5,325.00; | MarketCap:NT$462,372m; Recomm:Buy | MarketCap:NT$462,372m; Recomm:Buy | MarketCap:NT$462,372m; Recomm:Buy | MarketCap:NT$462,372m; Recomm:Buy | MarketCap:NT$462,372m; Recomm:Buy | |||||
|---|---|---|---|---|---|---|---|---|---|---|---|
| Profit&Loss(NT$m) | 2024 | 2025 | 2026E | 2027E | 2028E | Valuation ratios | 2024 | 2025 | 2026E | 2027E | 2028E |
| Sales revenue | 59,458 | 61,148 | 67,640 | 74,947 | 100,546 | PE(x) | 18.2 | 22.2 | 18.4 | 18.4 | 14.8 |
| Cost of sales | -28,248 | -30,311 | -32,567 | -37,256 | -51,466 | PB(x) | 2.5 | 2.5 | 2.4 | 2.3 | 2.1 |
| Gross profit | 31,209 | 30,837 | 35,073 | 37,691 | 49,080 | EV/EBITDA(x) | 11.1 | 10.8 | 9.2 | 8.3 | 6.2 |
| Gross Margin (%) | 52.5 | 50.4 | 51.9 | 50.3 | 48.8 | FCFyield (%) | 3.4 | 2.2 | 7.5 | 6.4 | 7.8 |
| EBITDA(Adj) | 29,617 | 30,526 | 35,142 | 37,086 | 46,538 | Dividend yield (%) | 2.4 | 2.3 | 2.7 | 2.7 | 3.4 |
| EBITDAMargin(Adj) (%) | 49.8 | 49.9 | 52.0 | 49.5 | 46.3 | Payout ratio (%) | 44 | 50 | 50 | 50 | 50 |
| Depreciation | -5,585 | -6,968 | -8,175 | -9,472 | -10,974 | ROE(%) | 14.8 | 11.3 | 13.2 | 12.7 | 14.7 |
| Amortisation | 0 | 0 | 0 | 0 | 0 | Cashflow(NT$m) | 2024 | 2025 | 2026E | 2027E | 2028E |
| EBIT (Adj) | 24,032 | 23,558 | 26,966 | 27,614 | 35,564 | EBITDA | 29,617 | 30,526 | 35,142 | 37,086 | 46,538 |
| EBIT Margin (Adj) (%) | 40.4 | 38.5 | 39.9 | 36.8 | 35.4 | Working capital | -4,417 | -6,864 | 9,424 | 753 | 590 |
| Net interest | 4,404 | 4,259 | 3,670 | 3,600 | 3,600 | Other | 2,178 | -1,998 | -1,337 | -2,035 | -3,653 |
| Associates | 0 | 3 | 151 | 200 | 200 | Operating cashflow | 27,378 | 21,664 | 43,229 | 35,803 | 43,475 |
| Non-Op/Except/Other Adj | 3,738 | -1,919 | 714 | 280 | 280 | Capex | -11,385 | -11,504 | -7,658 | -5,808 | -6,726 |
| Pre-tax profit | 32,174 | 25,900 | 31,502 | 31,694 | 39,644 | Net acq/disposals | 1,369 | 0 | -150 | -200 | -200 |
| Tax | -5,963 | -4,340 | -5,873 | -6,115 | -7,733 | Other | -5,514 | 8,798 | -480 | 0 | 0 |
| Extraord./Min.Int./Pref.div. | -296 | -285 | -53 | 0 | 0 | Investing cashflow | -15,531 | -2,707 | -8,288 | -6,008 | -6,926 |
| Reported net profit | 25,915 | 21,275 | 25,577 | 25,579 | 31,910 | Dividends paid | -10,811 | -11,412 | -10,680 | -12,840 | -12,840 |
| Net Margin (%) | 43.6 | 34.8 | 37.8 | 34.1 | 31.7 | Financing cashflow | -5,679 | -16,674 | -21,045 | -12,840 | -12,840 |
| CoreNPAT | 25,915 | 21,275 | 25,577 | 25,579 | 31,910 | Net change in cash | 6,168 | 2,283 | 13,895 | 16,956 | 23,708 |
| Per share data | 2024 | 2025 | 2026E | 2027E | 2028E | Free cashflow to s/holders | 15,993 | 10,160 | 35,571 | 29,995 | 36,749 |
| Reported EPS($) | 194.17 | 159.40 | 191.63 | 191.65 | 239.09 | ||||||
| Core EPS($) | 194.17 | 159.40 | 191.63 | 191.65 | 239.09 | ||||||
| DPS($) | 85.50 | 80.02 | 96.20 | 96.21 | 120.02 | ||||||
| CFPS($) | 205.13 | 162.32 | 323.89 | 268.25 | 325.73 | ||||||
| FCFPS($) | 119.83 | 76.12 | 266.51 | 224.74 | 275.34 | ||||||
| BVPS($) | 1,389.00 | 1,430.06 | 1,463.99 | 1,559.44 | 1,702.32 | ||||||
| Wtdavgordshares(m) | 133 | 133 | 133 | 133 | 133 | ||||||
| Wtdavgdiluted shares (m) | 133 | 133 | 133 | 133 | 133 | ||||||
| Growthrates | 2024 | 2025 | 2026E | 2027E | 2028E | ||||||
| Sales revenue (%) | 21.7 | 2.8 | 10.6 | 10.8 | 34.2 | ||||||
| EBIT (Adj) (%) | 35.0 | -2.0 | 14.5 | 2.4 | 28.8 | ||||||
| CoreNPAT(%) | 44.8 | -17.9 | 20.2 | 0.0 | 24.8 | ||||||
| CoreEPS(%) | 44.8 | -17.9 | 20.2 | 0.0 | 24.8 | ||||||
| BalanceSheet(NT$m) | 2024 | 2025 | 2026E | 2027E | 2028E | ||||||
| Cash&cashequiv. | 113,658 | 115,942 | 129,837 | 146,793 | 170,501 | ||||||
| Accounts receivables | 10,360 | 10,462 | 15,795 | 18,260 | 27,308 | ||||||
| Inventory | 5,733 | 6,713 | 8,028 | 9,280 | 13,879 | ||||||
| Net fixed &other tangibles | 46,936 | 51,472 | 50,955 | 47,291 | 43,043 | ||||||
| Goodwill &intangibles | 0 | 0 | 0 | 0 | 0 | ||||||
| Financial &other assets | 39,839 | 36,198 | 43,113 | 47,597 | 63,522 | ||||||
| Total assets | 216,527 | 220,787 | 247,728 | 269,220 | 318,252 | ||||||
| Accounts payable | 1,855 | 1,728 | 2,746 | 3,798 | 5,487 | ||||||
| Short-term debt | 203 | 0 | 0 | 0 | 0 | ||||||
| Long-term debt | 0 | 0 | 0 | 0 | 0 | ||||||
| Provisions &other liab | 29,081 | 28,191 | 49,585 | 57,287 | 85,560 | ||||||
| Total liabilities | 31,139 | 29,919 | 52,332 | 61,085 | 91,047 | ||||||
| interests | 0 | ||||||||||
| Minority | 0 | 0 | 0 | 0 | |||||||
| Total equity | 185,388 | 190,868 -115,942 | 195,396 -129,837 | 208,135 | 227,205 | ||||||
| Net debt (Adj) | -113,455 | -146,792 | -170,501 | ||||||||
| Net debt to equity (Adj) (%) | -61.2 | -60.7 | -70.5 | ||||||||
| For definitions of the items in this table, | please click here. | -66.4 | -75.0 |
Upgrade to Buy and lift TP to NT$5,325; smartphone weakness may continue, but likely limited share price downside -We were concerned about Largan's smartphone lens business suffering from a YoY decline due to rising competition and a muted industry outlook. Yet, Largan's existing business remains resilient, and with the new iPhone cycle in 2H26, we see limited downside from here. Further supported by its strong longer-term potential in co-packaged optics (CPO), we now value Largan at 25x 2027E/28E average PER, the high end of its 5-year range (we previously valued it on 15x 2026E PE, the middle of its 5-year range). Our target price rises to NT$5,325, from NT$3,060. We upgrade Largan to Buy from Neutral.
PMLA + Fiber Array: Why the Combination Matters
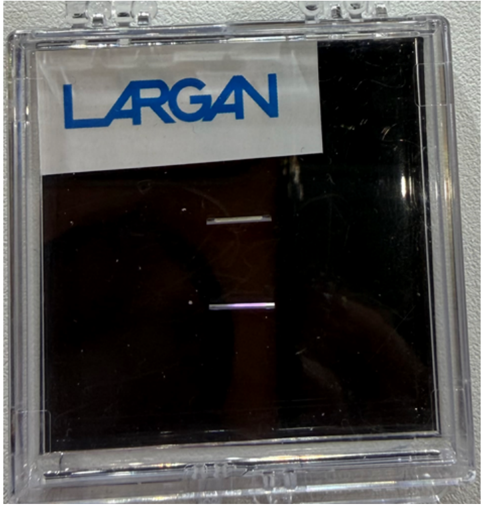
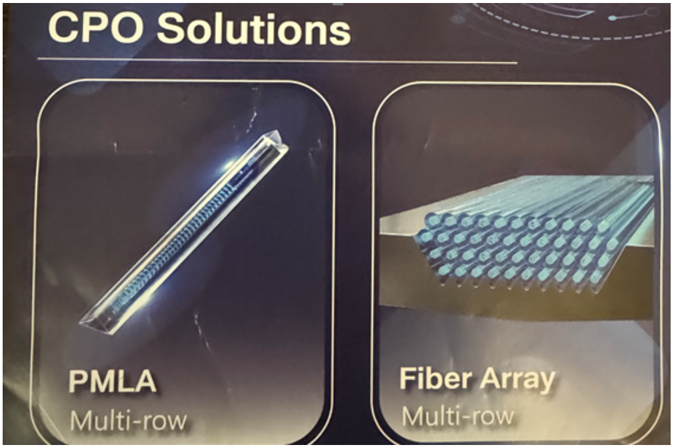
Largan demonstrated its PMLA technology, which combines multiple optical surfaces-including anti-reflective coatings, reflective turning surfaces, and pinhole optics-within a highly compact footprint, enabling precise laser routing into the IC IO. While this integration simplifies the optical path and reduces assembly complexity, it also shifts the manufacturing challenge toward advanced lens processing and molding technologies capable of meeting semiconductor-grade tolerances. We believe Largan's expertise in optical, automation and equipment could support its scale buildup for CPO.
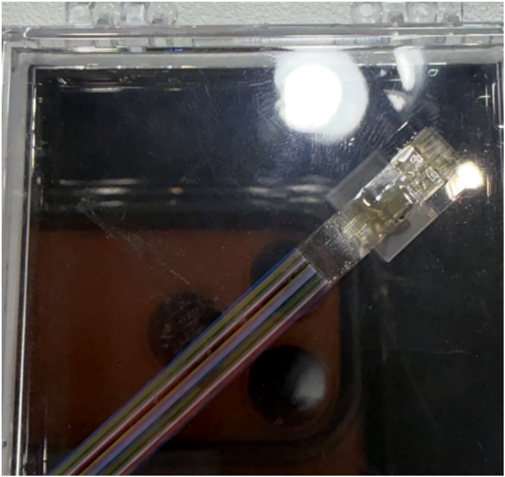
On the other hand, Largan's four-layer fiber array architecture represents a shift from traditional linear fiber arrangements toward a planar optical interface capable of substantially increasing IO density. Current samples would support four layers with ten fibers per row, equivalent to 40 fibers in total, while achieving approximately 0.5 μ m alignment accuracy and targeting 0.3 μ m precision. The primary advantage is not higher per-lane speed, but the ability to dramatically increase the number of optical channels connected to a photonic engine. Assuming future 200G-per-lane optical interfaces become mainstream, a 40-fiber configuration could theoretically support around 8Tbps of optical bandwidth, with even greater scalability as fiber counts increase. This architecture directly addresses one of the key bottlenecks in future CPO and silicon photonics systems, where optical throughput growth increasingly depends on higher IO density and more precise fiber-to-chip alignment rather than solely faster SerDes speeds.
The challenge is that a highly precise PMLA is only as good as the fiber array connected to it. If the FAU has alignment errors of more than one micrometer, the overall optical system cannot achieve the accuracy required by next-generation CPO and silicon photonics designs. This is why the two technologies must be cooptimized.
Figure 3. Largan - CPO solutions
Figure 1. Largan - CPO solutions demo
LARGAN
Figure 1. Largan - CPO solutions demo
PMLA
Multi-row
@ 2026 Citicroun Inc. No redistribution without Citicroun's written nermission..
@ 2026 Citioroun Ine No redistribution without Citioroun's written nermission
Figure 2. Largan - CPO solutions demo
Figure 2. Largan - CPO solutions demo
@ 2026 Citioroun Ine No redistribution without Citioroun's written nermission
© 2026 Citigroup Inc. No redistribution without Citigroup's written permission. Source: Citi Research, Largan
© 2026 Citigroup Inc. No redistribution without Citigroup's written permission. Source: Citi Research, Largan
Figure 3. Largan - CPO solutions
© 2026 Citigroup Inc. No redistribution without Citigroup's written permission. Source: Citi Research, Largan
Manufacturing Scale Could Become a Competitive Advantage
Unlike many emerging photonics startups, Largan already possesses extensive expertise in precision optics, including lens molding, optical coatings, automated production, and in-house equipment development. As a result, manufacturing capacity expansion may be less challenging than technology qualification. The likely path involves customer validation and engineering qualification first, followed by pilot production and eventual volume ramp. If customer adoption proceeds smoothly, commercialization could begin with limited production before scaling into larger deployments. Strategically, the opportunity extends beyond supplying fiber arrays alone. By integrating PMLA, micro-lens technologies, and advanced optical interfaces, we believe Largan could position itself higher in the optical interconnect value chain and potentially participate in future CPO, NPO, and silicon photonics ecosystems. In our view, the key determinant of success will be whether its multi-layer architecture can consistently achieve semiconductorgrade alignment accuracy while delivering the reliability and manufacturability required by hyperscale AI and networking customers.
Smartphone Weakness May Continue, But Likely Limited Share Price Downside
We were concerned about Largan's smartphone lens business suffering from a YoY decline due to rising competition and a muted industry outlook. Yet Largan's existing business remains resilient, and with the new iPhone cycle in 2H26, we see limited downside from here. The variable aperture for the new iPhone 18 Pro series would also support its lenes business ASP, in our view. We estimate 10.6%/10.8% YoY revenue growth in 2026/2027.
Largan is expecting to sample its optical solution for major foundry maker sand leading AI chip companies in late 2026. With its expertise in automation and scale ramping up capability, we expect contribution to be in 2028 at the earliest. Assuming Largan secures 10% of the fiber array + PMLA market opportunity with over 10m units, we estimate it would provide NT$30bn or higher revenue with more than 40% revenue contribution in 2028.
Upgrade to Buy and lift TP to NT$5,325
We lower our 2026/2027 earnings projection by 6% and 10% to reflect a lukewarm smartphone lens business and early investment in CPO optics. Our 2028 earnings projection is largely unchanged given higher revenue but lower margin on potential CPO initial yield and learning curve challenges.
Given its longer-term potential in CPO and a relatively stable iPhone lens business, we upgrade Largan to Buy from Neutral with a target price of NT$5,325, based on 25x our 2027E/28E average PE, at the high end of its 5-year historical PER, but lower than its CPO peers considering Largan's development in the CPO business is in the early stage compared to other CPO players in the Taiwan supply chain.
Figure o. Largan - Forward P/D band & RUE
Figure s. Largan - Forward P/E band
NT$
NT$
8000
7000
7000
6000
6000
5000
5000
4000
4000
3000
3000
2000
2000
1000
1000
0
Jul-10
A MANA A.
0
Jul-10 Jul-12 Jul-14 Jul-16 Jul-18 Jul-20 Jul-22 Jul-24
Jul-12
Jul-14
-2.0x
-9.9x
Jul-16
→ 3.0x
Jul-18
- 11.8x
Jul-20
Jul-22
5.0x
= 13.6x
Jul-24
ROE
- 15.5x
4.0x
2026 Citiornun Ine No redistribution without Citioroun's written nermission
ROE
60%
• 50%
- 40%.
30%
Figure 4. Largan - Estimates Revisions
10%
| 2026E | 2026E | 2026E | 2027E | 2027E | 2027E | 2028E | 2028E | 2028E | |
|---|---|---|---|---|---|---|---|---|---|
| (NT$mn) | New | Old | Chg. | New | Old | Chg. | New | Old | Chg. |
| Sales | 67,640 | 71,169 | -5% | 74,947 | 80,270 | -7% | 100,546 | 91,070 | 10% |
| Gross profit | 35,073 | 37,216 | -6% | 37,691 | 41,813 | -10% | 49,080 | 47,414 | 4% |
| Opex | (8,107) | (8,530) | -5% | (10,078) | (10,791) | -7% | (13,516) | (12,240) | 10% |
| Operating profit | 26,966 | 28,685 | -6% | 27,614 | 31,022 | -11% | 35,564 | 35,174 | 1% |
| Pre-tax profit | 31,502 | 33,765 | -7% | 31,694 | 35,102 | -10% | 39,644 | 39,254 | 1% |
| Net income | 25,577 | 27,214 | -6% | 25,578 | 28,329 | -10% | 31,910 | 31,666 | 1% |
| EPS(NT$) | 191.6 | 203.9 | -6% | 191.6 | 212.3 | -10% | 239.1 | 237.3 | 1% |
| Gross margin | 51.9 | 52.3 | -0.4ppts | 50.3 | 52.1 | -1.8ppts | 48.8 | 52.1 | -3.2ppts |
| Opexratio | (12.0) | (12.0) | 0.0ppts | (13.4) | (13.4) | 0.0ppts | (13.4) | (13.4) | 0.0ppts |
| Operating margin | 39.9 | 40.3 | -0.4ppts | 36.8 | 38.6 | -1.8ppts | 35.4 | 38.6 | -3.3ppts |
| Net margin | 37.8 | 38.2 | -0.4ppts | 34.1 | 35.3 | -1.2ppts | 31.7 | 34.8 | -3.0ppts |
Source: Citi Research
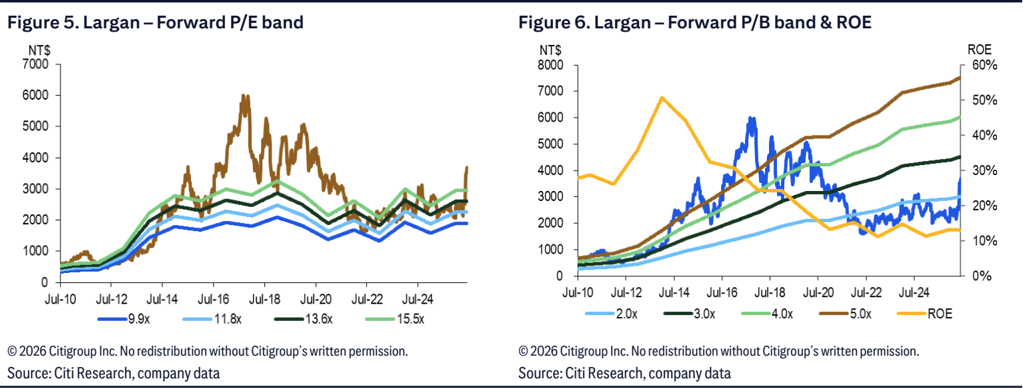
Figure 1. Largan - Forecast Summary
NT$mn
1Q25
Net sales
OPEX
Operating profit
Total Non-OP
Pre-tax profit
Income tax
Net profit
1,878
6,086
1,630
7,716
1,381 2,088
4,879 6,265
(3,085)
1,890
2Q25 3025 4Q25
17,219
8,260
1,932
6,329
1,907
1Q26
15,544
7,680
1,867
5,812
1,476
1,794
8,155
8,236
7,288
Figure 7. Largan - Forecast Summary
EPS
Margins (%)
Gross profit
OPEX to Sales Ratio
Operating profit
Total Non-OP
Pre-tax profit
Net profit
Y/Y (%)
Net sales
Gross profit
Operating profit
Pre-tax profit
Net profit
Q/Q(%)
Net sales
Gross profit
Operating profit
Pre-tax profit
Net profit
2Q26E
13,937
7,189
1,728
5,460
1,020
6,480
1,312
5,168
3Q26E
17,569
8,932
2,143
6,788
1,020
7,808
1,251
6,557
4Q26E
20,590
11,274
2,368
8,906
1,020
9,926
2,197
7,728
1Q27E
16,328
8,279
2,237
6,041
1,020
7,061
1,304
5,758
2Q27E 3Q27E 4Q27E
15,750
19,065 23,803
8,229
2,111
6,119
1,020
7,139
1,446
5,693
9,783 11,400
2,517
3,213
7,266
1,020
8,286
1,328
6,959
8,187
1,020
9,207
2,038
7,169
2025
61,148
30,837
7,279
23,558
2,342
25,900
4,340
21,275
2026E
67,640
35,073
8,107
26,966
4,536
31,502
5,873
2027E
2028E
10,078
13,516
27,614 35,564
4,080
4,080
31,694
6,115
25,577 25,578
39,644
7,733
31,910
| 48.3 | 7.7 | 53.0 | 50.3 | 45.9 | 38.7 | 49.1 | 57.9 | 43.1 | 42.7 | 52.1 | 53.7 | 159.4 | 191.6 | 191.6 | 239.1 |
|---|---|---|---|---|---|---|---|---|---|---|---|---|---|---|---|
| 54.6 | 53.6 | 47.2 | 48.0 | 49.4 | 51.6 | 50.8 | 54.8 | 50.7 | 52.2 | 51.3 | 47.9 | 50.4 | 51.9 | 50.3 | 48.8 |
| 11.8 | 11.8 | 11.2 | 12.0 | 12.4 | 12.2 | 11.5 | 13.7 | 13.4 | 13.2 | 13.5 | 11.9 | 12.0 | 13.4 | 13.4 | |
| 12.9 41.7 | 41.8 | 35.4 | 36.8 | 37.4 | 39.2 | 38.6 | 43.3 | 37.0 | 38.8 | 38.1 | 34.4 | 38.5 | 39.9 | 36.8 | 35.4 |
| 11.2 | (26.4) | 10.7 | 11.1 | 9.5 | 7.3 | 5.8 | 5.0 | 6.2 | 6.5 | 5.4 | 4.3 | 3.8 | 6.7 | 5.4 | 4.1 |
| 52.9 | 15.4 | 46.1 | 47.8 | 46.9 | 46.5 | 44.4 | 48.2 | 43.2 | 45.3 | 43.5 | 38.7 | 42.4 | 46.6 | 42.3 | 39.4 |
| 44.2 | 8.8 | 40.1 | 39.0 | 39.4 | 37.1 | 37.3 | 37.5 | 35.3 | 36.1 | 36.5 | 30.1 | 34.8 | 37.8 | 34.1 | 31.7 |
| 6.3 | (6.7) | (5.4) | 6.6 | 19.4 | (0.6) | 19.6 | 5.0 | 13.0 | 8.5 | 15.6 | 2.8 | 10.6 | 10.8 | 34.2 | |
| 28.9 43.2 | 17.8 | (12.2) | (23.6) | (3.6) | 14.8 | 6.9 | 36.5 | 7.8 | 14.5 | 9.5 | 1.1 | (1.2) | 13.7 | 7.5 | 30.2 |
| 53.7 | 25.4 | (19.7) | (24.5) | (4.5) | 11.9 | 8.4 | 40.7 | 3.9 | 12.1 | 7.0 | (8.1) | (2.0) | 14.5 | 2.4 | 28.8 |
| 3.9 | (69.1) | 3.9 | (25.7) | (5.6) | 261.3 | (4.2) | 20.5 | (3.1) | 10.2 | 6.1 | (7.2) | (19.5) | 21.6 | 0.6 | 25.1 |
| 5.4 | (77.1) | 6.8 | (22.5) | (5.0) | 400.7 | (7.4) | 15.0 | (6.0) | 10.2 | 6.1 | (7.2) | | (17.9) | 20.2 | 0.0 | 24.8 |
| (19.9) | (19.9) | 51.4 | (2.6) | (9.7) | (10.3) | 26.1 | 17.2 | (20.7) | (3.5) | 21.0 | 24.9 | ||||
| (26.4) | (21.4) | 33.4 | (1.1) | (7.0) | (6.4) | 24.2 | 26.2 | (26.6) | (0.6) | 18.9 | 16.5 | ||||
| (19.8) | 28.4 | 1.0 | (8.2) | (6.1) | 24.3 | 31.2 | (32.2) | 1.3 | 18.8 | 12.7 | |||||
| (76.8) 354.6 | 1.0 | (11.5) | (11.1) | 20.5 | 27.1 | (28.9) | 1.1 | 16.1 | 11.1 | ||||||
| (30.4) (25.7) | (84.0) 586.0 | (5.1) | (8.9) (15.6) | 26.9 | 17.9 | (25.5) | (1.1) | 22.2 | 3.0 | ||||||
| @ 2026 Citicroun Inc. No redistribution without Citicroun's written nermission. |
Adding Upside 30-Day Catalyst Watch on Largan Precision (3008.TW)
Direction:
Upside
Duration:
Within 30 Days Thematic driven
Catalyst:
We expect more positive sentiment and outlook to be shared by management in the upcoming shareholder meeting on June 9 and the analyst meeting in early July.
NT$
6,000
5,000
4,000
3,000
2,000
Jun 25
• Winning significant shares in lens market
I 470% Upside
NT$ 5,325.00
4 51% Upside
NT$ 3,000.00
Bull/Bear: Largan Precision (3008.TW)
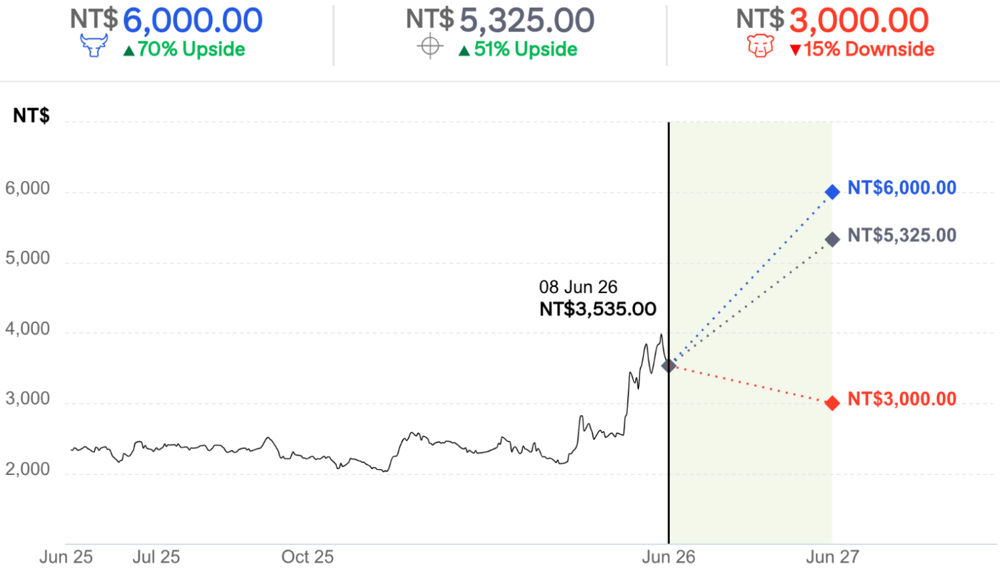
• Based on 28x PER
BASE Assumptions
- Overall GM >48% in 2026-28E
- Stable share in lens market with steady lens upgrade trend
BEAR Assumptions
• Lower than expected UTR or worse than expected product mix
- Losing significant shares in lens market
• Based on 14x PER
• 15% Downside
Largan Precision
Company description
Largan is a plastic/glass/hybrid lens supplier in Taiwan with end-applications including phone cameras, DSCs, MFPs, and tablets. More than 80% of its revenue is driven by phone camera lenses.
Investment strategy
We rate Largan a Buy as we expect its core iPhone business to remain resilient and its co-packaged optics (CPO) development to provide strong upside potential in the longer term. We believe Largan could be a long-term winner in the lens market driven by: 1) its technology leadership; 2) intellectual property (IP) protection; and 3) higher yield vs. competitors. In the longer term, we believe spec migration could keep Largan ahead of competitors.
Valuation
Our target price of NT$5,325 for Largan shares is based on 25x 2027/28E EPS, at the high end of its 5-year historical PER, which we think is justified as we expect its early engagement in the CPO business to provide a strong longterm growth opportunity. Our target multiple is lower than multiples for its CPO peers, considering Largan's development in the CPO business is in the early stage compared to other CPO players in the Taiwan supply chain.
Risks
Key downside risks include: 1) weaker smartphone demand or replacement demand, and in particular, demand headwinds for certain key clients; 2) longer learning curve and slower ramp of the yield rate; 3) slower spec migration; and 4) slower development in CPO business. Any of these risk factors could cause the shares to deviate from our target price.
If you are visually impaired and would like to speak to a Citi representative regarding the details of the graphics in this document, please call USA 1-888-500-5008 (TTY: 711), from outside the US +1-210-677-3788
Appendix A-1
圖片清單(已驗證 2026-07-02)
回補驗證:僅涵蓋已被 lib 頁嵌入的圖片,非全量驗證。
| 檔名 | size | 分類 | 親眼所見內容 |
|---|---|---|---|
260608_citi_largan-UG_002.png |
266KB | 真資料圖 | 產品實體照片,透明保護盒內裝黑色方形感測元件(表面可見兩道細長金屬/光學痕跡),盒身標籤印有「LARGAN」字樣,疑為通路查證所拍攝之樣品照 |
260608_citi_largan-UG_004.png |
315KB | 真資料圖 | 標題「CPO Solutions」投影片,左側方框標示「PMLA Multi-row」搭配一根透明棒狀元件照片,右側方框標示「Fiber Array Multi-row」搭配多排光纖陣列照片 |