PDF 原檔:260602_ms_airtac_original.pdf
原始內容
M June 2, 2026 02:33 PM GMT
AirTAC International | Asia Pacific
May Sales -10% MoM/+40% YoY
Here we focus on AirTAC's monthly sales, which we believe could be a catalyst for its recent share price movement.
What's new:
- May sales came in at NT$3,909mn (-10% MoM/+40% YoY), with the sequential decline mainly due to the fewer working days amid the May holidays in China.
- By segment, shipments from battery, machine tool, general machinery and textiles outperformed during the month.
- QTD revenue reached 73% of MSe at NT$11,342mn (+13% QoQ/+27% YoY) and 75% of consensus at NT$10,941mn (+9% QoQ/+22% YoY).
Our view:
- We see 2Q26 revenue tracking ahead of expectations.
- Orders for the month continued to exceed shipments in April, and both are above its own expectations.
- Management indicated that its operating margin has reached a record high in April and could continue to expand. We do not have its monthly history, but its record-high single-quarter operating margin was 35.3% in 2Q10, so It implies it has surpassed the above level in April on a single month basis (vs. 2Q26 consensus at 34.5%).
- It believes that the impact from rising material costs should be manageable owing to its raised selling prices in the overseas market and efficiency/ product mix improvement.
- We stay OW on AirTAC amid the industry upcycle and its consistent share gains. Moreover, current valuation of 23x 2027e P/E seems undemanding vs. its mid-cycle average of 25x, in our view.
Exhibit 1 : AirTAC monthly sales vs. its share price since 2015
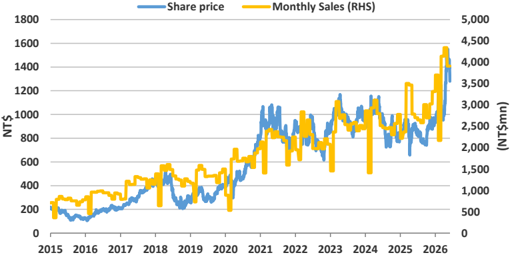
Note: Past performance is no guarantee of future results. Results shown do not include transaction costs. Source: Company data, TEJ, Morgan Stanley Research.
Morgan Stanley Taiwan Limited+
Update
| Derrick Yang Equity Analyst Derrick.Yang@morganstanley.com | +886 2 2730-2862 |
|---|---|
| Vivi Huang Research Associate Vivi.Huang@morganstanley.com | +886 2 2730-2860 |
| Sharon Shih Equity Analyst Sharon.Shih@morganstanley.com | +886 2 2730-2865 |

AirTAC International (1590.TW, 1590 TT)
Greater China Technology Hardware | Taiwan
Stock Rating
Overweight In-Line
Industry View
Price target
NT$2,000.00
Up/downside to price target (%)
56
Shr price, close (Jun 2, 2026)
NT$1,280.00
52-Week Range
NT$1,600.00-741.00
Sh out, dil, curr (mn)
200
Mkt cap, curr (mn)
US$8,188
EV, curr (mn)
US$8,035
Avg daily trading value (mn)
US$29
| Fiscal Year Ending | 12/25 | 12/26e | 12/27e | 12/28e |
|---|---|---|---|---|
| EPS (NT$)** | 41.97 | 56.77 | 65.77 | 73.77 |
| Prior EPS (NT$)** | - | - | - | - |
| EPS (NT$)§ | 41.43 | 55.37 | 62.25 | 69.46 |
| Revenue, net (NT$ mn) | 34,330 | 42,689 | 49,091 | 55,118 |
| EBITDA (NT$ mn) | 12,866 | 16,460 | 18,887 | 21,122 |
| ModelWare net inc (NT | 8,400 | 11,363 | 13,165 | 14,767 |
| $ mn) | ||||
| P/E | 22.2 | 22.5 | 19.5 | 17.4 |
| P/BV | 3.5 | 4.4 | 3.9 | 3.5 |
| RNOA (%) | 17.7 | 23.3 | 25.3 | 26.4 |
| ROE (%) | 17.5 | 21.6 | 22.7 | 22.5 |
| EV/EBITDA | 14.1 | 15.2 | 13.0 | 11.5 |
| Div yld (%) | 2.2 | 2.2 | 2.2 | 2.6 |
| FCF yld ratio (%) | 3.4 | 3.0 | 3.5 | 4.0 |
| Leverage (EOP) (%) | (9.1) | (11.8) | (15.5) | (19.0) |
Unless otherwise noted, all metrics are based on Morgan Stanley ModelWare framework
** = Based on consensus methodology
§ = Consensus data is provided by Refinitiv Estimates
e = Morgan Stanley Research estimates
Morgan Stanley does and seeks to do business with companies covered in Morgan Stanley Research. As a result, investors should be aware that the firm may have a conflict of interest that could affect the objectivity of Morgan Stanley Research. Investors should consider Morgan Stanley Research as only a single factor in making their investment decision.
圖片清單(已驗證 2026-07-02)
回補驗證:僅涵蓋已被 lib 頁嵌入的圖片,非全量驗證。
| 檔名 | size | 分類 | 親眼所見內容 |
|---|---|---|---|
260602_ms_airtac_001.png |
46KB | 真資料圖 | 雙軸折線圖,Share price(左軸,NT$)與 Monthly Sales [RHS](右軸,NT$mn),2015-2026 |