PDF 原檔:260529_3491_昇達科_gs_umt_original.pdf
原始內容
UMT (3491.TWO): Monthly preview: Rising LEO satellite business to drive sequential growth; Improving launch e ffi ciency with spec upgrade;
Monthly revenues preview: UMT's Apr revenues were up 84% YoY/ 6% MoM, or 6% below our estimates on customers' procurement pace. For the coming month, we expect to see sequential revenue growth through Sep 2026, leading 2Q/ 3Q26E revenues to grow at 8%/ 19% QoQ to NT$1.1bn/ NT$1.3bn, driven by (1) accelerated satellite launches with higher e ffi ciency, (2) LEO satellites speci fi cation upgrade to drive the dollar content upgrade, and (3) company's strong R&D capabilities and competitive production cost. We expect May revenues to grow 98% YoY/ 7% MoM to NT$373m with rising satellites revenues contribution. Maintain Buy.
UMT provides rectangular waveguides, which are conducting pipes with a rectangular cross-section used to guide the propagation of microwave or mmwave signals. Di ff erent shapes and combinations of waveguides can form various RF passive components, such as fi lter / diplexer, coupler, isolator, antenna, power ampli fi ers (PAs), etc. The company serves leading global LEO satellite operators, and its waveguides are utilised in LEO satellites / payloads (main), and gateways in ground stations.
Allen Chang
+852-2978-2930 | allen.k.chang@gs.com Goldman Sachs (Asia) L.L.C.
Verena Jeng
+852-2978-1681 | verena.jeng@gs.com Goldman Sachs (Asia) L.L.C.
Ting Song
+852-2978-6466 | ting.song@gs.com Goldman Sachs (Asia) L.L.C.
e92c7a75ab8b4efbba794e6b187208c8
Exhibit 1: We expect UMT May 2026 revenues to grow 98% YoY, 7% MoM to NT$373m UMT monthly/ quarterly revenues
| Mar 2026 | Apr 2026 | May 2026E | Jun 2026E | Jul 2026E | Aug 2026E | Sep 2026E | 1Q26 | 2Q26E | 3Q26E | |
|---|---|---|---|---|---|---|---|---|---|---|
| Revenues (NT$m) | 329 | 349 | 373 | 379 | 398 | 438 | 477 | 1,020 | 1,102 | 1,312 |
| YoY | 36% | 84% | 98% | 180% | 215% | 163% | 149% | 65% | 114% | 171% |
| MoM/QoQ | 2% | 6% | 7% | 1% | 5% | 10% | 9% | 22% | 8% | 19% |
| GS estimates (NT$m) Actual vs. GS | 372 -6% |
Source: Company data, Goldman Sachs Global Investment Research
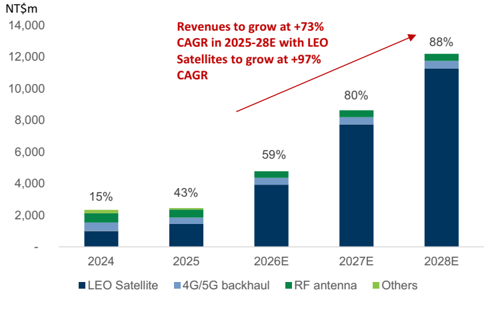
Exhibit 2: UMT revenues by products
Source: Company data, Goldman Sachs Global Investment Research
Earnings revision: We revise up UMT earnings by 2%/ 2% in 2027/ 28E, and keep 2026E estimates largely unchanged. We revise up earnings mainly on higher revenues of LEO satellites business, driven by accelerated satellite launches and higher dollar content of the company's o ff erings. We keep GM and Opex ratio largely unchanged.
Exhibit 3: Earnings revision
| 2026E | 2026E | 2026E | 2027E | 2027E | 2027E | 2028E | 2028E | 2028E | |
|---|---|---|---|---|---|---|---|---|---|
| NT$m | Old | New | Diff% | Old | New | Diff% | Old | New | Diff% |
| Revenues | 4,778 | 4,800 | 0% | 8,794 | 8,977 | 2% | 12,377 | 12,635 | 2% |
| GP | 3,048 | 3,059 | 0% | 5,943 | 6,076 | 2% | 8,563 | 8,751 | 2% |
| OP | 1,710 | 1,715 | 0% | 3,481 | 3,563 | 2% | 5,122 | 5,239 | 2% |
| Net income | 1,380 | 1,384 | 0% | 2,785 | 2,849 | 2% | 4,045 | 4,136 | 2% |
| Margins | |||||||||
| GM | 63.8% | 63.7% | 67.6% | 67.7% | 69.2% | 69.3% | |||
| OPM | 35.8% | 35.7% | 39.6% | 39.7% | 41.4% | 41.5% | |||
| NM | 28.9% | 28.8% | 31.7% | 31.7% | 32.7% | 32.7% |
Source: Company data, Goldman Sachs Global Investment Research
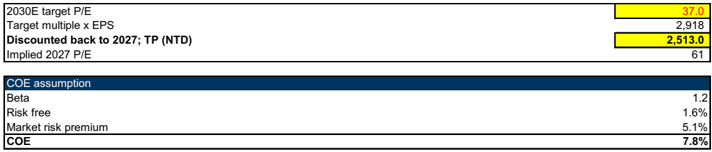
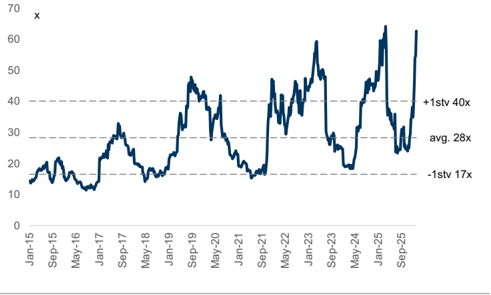
Valuation: We continue to derive our target price based on a discounted P/E, and based on 2029E (methodology unchanged). We continue to derive the target P/E multiple from the average PEG&M ratio of peers in the satellite supply chain, and we remove outliers (telecom operators who face competition from LEO satellite operators). Our target P/E multiple is at 37.0x on 2027E (vs. previously at 33.5x) which is based on peers' avg. PEG&M, and a rise in UMT's 2029-30E avg. NI YoY and OPM at 27%/ 42% (vs. previously at 24%/ 42%), and the multiple re-rating is driven by the rising LEO satellite trend and spec upgrade. We apply the 37.0x multiple to 2029E EPS and discount it back to 2027E via a COE of 7.8% (no change). Our target price is at NT$2,513 (vs. previously at NT$2,280), implying 61x 2027E P/E, which is above the company's average +1 stv. P/E of 40x, re fl ecting our positive view on UMT's product mix upgrade toward LEO satellites.
e92c7a75ab8b4efbba794e6b187208c8
Maintain Buy.
Exhibit 4: UMT discounted P/E
| (NT$ mn) | 2022 | 2023 | 2024 | 2025 | 2026E | 2027E | 2028E | 2029E | 2030E |
|---|---|---|---|---|---|---|---|---|---|
| Milestones | Telecom components | Telecom components | Telecom components | LEO satellite launch accelerations | LEO satellite launch accelerations | LEO satellite launch accelerations | LEO satellite launch accelerations | LEO satellite users ramp up | LEO satellite users ramp up |
| Satellite revenues% | 15% | 15% | 43% | 59% | 81% | 89% | 92% | ||
| Revenue | 1,838 | 1,585 | 2,335 | 2,452 | 4,800 | 8,977 | 12,635 | 16,299 | 19,885 |
| YoY | 5% | -14% | 47% | 5% | 96% | 87% | 41% | 29% | 22% |
| Gross margin | 40.9% | 40.4% | 51.3% | 51.1% | 63.7% | 67.7% | 69.3% | 69.8% | 70.1% |
| Operating profit | 294 | 202 | 624 | 575 | 1,715 | 3,563 | 5,239 | 6,856 | 8,464 |
| YoY | 33% | -31% | 208% | -8% | 199% | 108% | 47% | 31% | 23% |
| Operating margin | 16% | 13% | 27% | 23% | 36% | 40% | 41% | 42% | 43% |
| Net profit | 271 | 200 | 547 | 518 | 1,384 | 2,849 | 4,136 | 5,411 | 6,668 |
| EPS (NT$, diluted) | 4.34 | 3.12 | 8.27 | 7.60 | 20.17 | 41.53 | 60.29 | 78.87 | 97.20 |
| YoY | 15% | -26% | 173% | -5% | 167% | 106% | 45% | 31% | 23% |
| TP implied P/E | 579 | 807 | 304 | 331 | 125 | 61 | 42 | 32 | 26 |
Source: Company data, Goldman Sachs Global Investment Research
Exhibit 5: UMT 12M forward P/E ratio
Source: Company data, Goldman Sachs Global Investment Research, Bloomberg
Price target risks and methodology - UMT
Valuation: We use a discounted P/E methodology and apply a 37.0x target P/E multiple to UMT's 2029E EPS, discounting it back to 2027E at a COE of 7.8% (beta 1.2x, risk-free rate 1.6% and market risk premium at 5.1%), which leads to our 12-month target price of NT$2,513. The target P/E is based on the average PEG&M ratio of peers in the satellite supply chain. We are Buy-rated on UMT.
Key Risks: Slower-than-expected LEO satellite deployment; Potential competition from new-entrant suppliers; LEO satellite operators manufacturing in-house components.
e92c7a75ab8b4efbba794e6b187208c8
3491.TWO
12m Price Target:
NT$2,513.00
Price:
NT$2,200.00
Upside:
14.2%
| Buy | GS Forecast | ||||
|---|---|---|---|---|---|
| 12/25 | 12/26E | 12/27E | 12/28E | ||
| Market c ap: NT$145.7 bn / $4. 6bn En terpr is e v a lu e: NT$145.1 bn / $4. 6bn 3m AD T V : NT$ 3 . 2bn / $1 02 .5 mn Ta iw a n G reater Chin a Te chnology M &A R a n k: 3 L ea s e s incl . in n et d e b t & EV? : Y e s | Revenue ( NT$m n ) N e w Revenue (NT$ mn) Old EBITD A (NT$ mn) E PS ( NT$) N e w EPS (NT$) Old P/E (X) P/B (X) Dividend yield (%) CROCI (%) | 2 ,4 52 . 2 2,452.2 688.6 7 . 6 0 | 4, 7 99. 5 | 8 ,9 76 .9 | 12 , 6 3 5 .0 |
| Market c ap: NT$145.7 bn / $4. 6bn En terpr is e v a lu e: NT$145.1 bn / $4. 6bn 3m AD T V : NT$ 3 . 2bn / $1 02 .5 mn Ta iw a n G reater Chin a Te chnology M &A R a n k: 3 L ea s e s incl . in n et d e b t & EV? : Y e s | 4,778.4 | 8,794.5 | 12,377.0 | ||
| Market c ap: NT$145.7 bn / $4. 6bn En terpr is e v a lu e: NT$145.1 bn / $4. 6bn 3m AD T V : NT$ 3 . 2bn / $1 02 .5 mn Ta iw a n G reater Chin a Te chnology M &A R a n k: 3 L ea s e s incl . in n et d e b t & EV? : Y e s | 1,838.1 | 3,705.0 | 5,397.4 | ||
| Market c ap: NT$145.7 bn / $4. 6bn En terpr is e v a lu e: NT$145.1 bn / $4. 6bn 3m AD T V : NT$ 3 . 2bn / $1 02 .5 mn Ta iw a n G reater Chin a Te chnology M &A R a n k: 3 L ea s e s incl . in n et d e b t & EV? : Y e s | 2 0. 17 | 4 1 . 5 3 | 6 0. 2 9 | ||
| Market c ap: NT$145.7 bn / $4. 6bn En terpr is e v a lu e: NT$145.1 bn / $4. 6bn 3m AD T V : NT$ 3 . 2bn / $1 02 .5 mn Ta iw a n G reater Chin a Te chnology M &A R a n k: 3 L ea s e s incl . in n et d e b t & EV? : Y e s | 7.60 | 20.11 | 40.60 | 58.96 | |
| Market c ap: NT$145.7 bn / $4. 6bn En terpr is e v a lu e: NT$145.1 bn / $4. 6bn 3m AD T V : NT$ 3 . 2bn / $1 02 .5 mn Ta iw a n G reater Chin a Te chnology M &A R a n k: 3 L ea s e s incl . in n et d e b t & EV? : Y e s | 54.5 | 109.1 | 53.0 | 36.5 | |
| 9.0 | 44.5 | 37.6 | 30.7 | ||
| 1.4 | 0.7 | 1.5 | 2.2 | ||
| 21.5 | 48.3 | 90.4 | 134.2 | ||
| 3 /26 | 6/26E | 9 /26E | 12/26E | ||
| EPS (NT$) | 3.69 | 4.32 | 5.94 | 6.23 |
Source: Company data, Goldman Sachs Research estimates, FactSet. Price as of 29 May 2026 close.
e92c7a75ab8b4efbba794e6b187208c8
圖片清單(已驗證 2026-07-02)
回補驗證:僅涵蓋已被 lib 頁嵌入的圖片,非全量驗證。
| 檔名 | size | 分類 | 親眼所見內容 |
|---|---|---|---|
260529_3491_昇達科_gs_umt_001.png |
34KB | 真資料圖 | 營收預估堆疊長條圖(NT$m),橫軸 2024-2028E,各柱標示 LEO Satellite/4G5G backhaul/RF antenna/Others 佔比與年度總成長率百分比(15%/43%/59%/80%/88%),並附紅字文字說明「Revenues to grow at +73% CAGR in 2025-28E with LEO Satellites to grow at +97% CAGR」 |