報告_MS_Agentic_AI_CPU記憶體_20260511
PDF 原檔:報告_MS_Agentic_AI_CPU記憶體_20260511_original.pdf
原始內容
M May 11, 2026 03:15 PM GMT
Global Technology
Agentic AI - The Surge Begins
Agentic AI is no longer emerging but already reshaping industries - a new class of digital workforce is driving results. This means a rewrite of the AI infra equation - one with far more CPU and memory LTA capacity than earlier AI assumptions suggested, and hence much higher growth opportunity.
The ‘agentic economy’ is scaling faster than initially anticipated. This shift is already showing up in valuations - since mid-April (see our recent report Rise of the AI Agent - Global Implications), CPU and memory stocks have reached new highs. Recent 1Q26 commentary from AMD, Arm and Intel points to a recent surge in highcore-count CPUs and orchestration-heavy workloads, as hyperscaler data center deployments increasingly require denser CPU infrastructure around GPU clusters. At the same time, reported 3- to 5-year memory LTAs are emerging as a critical structural shift for the industry, extending pricing visibility and reinforcing durability in the cycle.
What’s changed? 1Q26 has been an agent AI breakout quarter with a surge in ‘agent-first’ strategies across many companies, moving from experimental pilot programs to full-scale enterprise deployment. With accelerating enterprise adoption, CPU capacity requirements rise sharply and more measurable as agentic workloads scale. Now, in 2Q26, the debate is no longer about the potential of agentic AI, but about the speed of its integration. We also revise our memory framework to reflect higher orchestration CPU demand and rising DRAM content per CPU, driving incremental ~74EB in our base case, and ~228EB in a bull case by 2030.
Upgrading our CPU/memory TAM: We revise our framework to reflect faster agentic AI adoption, higher concurrency and more instructions per token. Our basecase total server CPU TAM rises 25% to US79bn orchestration CPU layer on top of US283bn as dedicated agentic CPU racks scale. Applying the same CPU-led framework to memory, this implies ~74EB of incremental DRAM demand in our base case and ~221EB in our bull case (or 1.7x to 4.9x larger than the entire 2026 DRAM market).
Stay full-stack: The AI data center not only needs more GPUs but a stronger host CPU layer that can keep accelerators, memory, networking and software agents synchronized. Our preferred exposure is unchanged across CPUs, DRAM, NAND/ eSSD, HDD, ABF substrates, foundry, memory interface, BMC, sockets/connectors and semi-cap, where content growth and supply constraints capture the ‘second leg’ of the AI infrastructure cycle ( Exhibit 1 ).
Global Idea
Morgan Stanley & Co. International plc+
| Shawn Kim Equity Analyst Shawn.Kim@morganstanley.com | +44 20 7677-1018 |
|---|---|
| Lee Simpson Equity Analyst Lee.Simpson@morganstanley.com | +44 20 7425-3378 |
| Nigel van Putten Equity Analyst Nigel.Putten@morganstanley.com | +44 20 7425-2803 |
| Amelia MScicluna Research Associate Amelia.Scicluna@morganstanley.com | +44 20 7425-6694 |
| Cindy Huang Equity Analyst Cindy.Huang@morganstanley.com Morgan Stanley Asia Limited+ | +44 20 7425-2915 |
| Duan Liu Equity Analyst Duan.Liu@morganstanley.com | +852 2239-7357 |
Exhibit 1 : Likely beneficiaries of agentic AI take-up
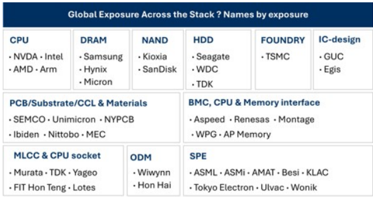
Source: Morgan Stanley Research
Morgan Stanley does and seeks to do business with companies covered in Morgan Stanley Research. As a result, investors should be aware that the firm may have a conflict of interest that could affect the objectivity of Morgan Stanley Research. Investors should consider Morgan Stanley Research as only a single factor in making their investment decision.
For analyst certification and other important disclosures, refer to the Disclosure Section, located at the end of this report.
+= Analysts employed by non-U.S. affiliates are not registered with FINRA, may not be associated persons of the member and may not be subject to FINRA restrictions on communications with a subject company, public appearances and trading securities held by a research analyst account.
M
Exhibit 2 : CPU and memory have significantly outperformed the broader AI ecosystem since our last report
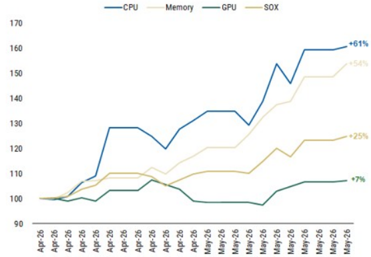
Source: Morgan Stanley Research. Note: CPU is an average performance of ARM, INTEL, AMD. Memory: Samsung, SK Hynix, Micron. GPU: NVIDIA
M
Agentic AI - Key Developments
We expect a surge in agentic AI competition to manifest between hyperscalers, frontier model companies, incumbent software vendors and new startups as companies race to build out money-making AI tools. But we are still early in the price discovery stage of the Agentic AI economy and still don’t know yet what kind of unlock it is going to ultimately bring to drive the AI TAM, early in the structural shift in AI infrastructure from pure compute toward orchestration, memory and system-level coordination.
A pivot from search to action. We believe AI platforms are now shifting from cost centres to revenue infrastructure with the deployment of AI agents at scale in commerce, advertising and enterprise productivity. Agents drive more engagement, utility and customers stickiness on their platforms, due to their continuing learning ability and user context gained over time. Agents that conduct transactions becomes a significant value driver for hyperscale providers. Both Meta and Google have been reported to be working on AI agents, with Meta building a highly personalized AI assistant to carry out everyday tasks for its users ( Financial Times , 6 May), and Google is developing a 24/7 personal agent for work, school and daily life, powered by Gemini ( Business Insider , 6 May).
Agentic AI needs a rewrite of the AI infrastructure equation. Building an Agentic AI system does not mean putting a few more CPUs next to the same GPU-heavy rack design. It is a much more complex structural shift in data center architecture by adding a newly engineered CPU compute layer. Agentic AI requires entirely new racks of CPU servers that sit alongside GPU infrastructure and run to power the work of all these agents. The AI system in the future will look like a distributed system consisting of:
- GPU racks for dense model compute , fast networking and a software stack that can keep it all observable, secure and efficient;
- Agentic CPU racks for orchestration , processing data and tool execution.
In the agentic era, performance will not come from one processor doing everything but the right architecture - with CPUs and GPUs working together to move AI from answers to action. What will matter more for enterprises deploying AI agents is a balanced architecture, where: 1) the CPU tier is large enough to minimize GPUs wait, 2) efficient networking supporting agents, and 3) a data path allowing minimal latency. The orchestration layer is designed for concurrency to minimize cost and complexity.
M
Exhibit 3: Agentic AI infrastructure architecture - the CPU/GPU shift is far complex than adding more CPUs
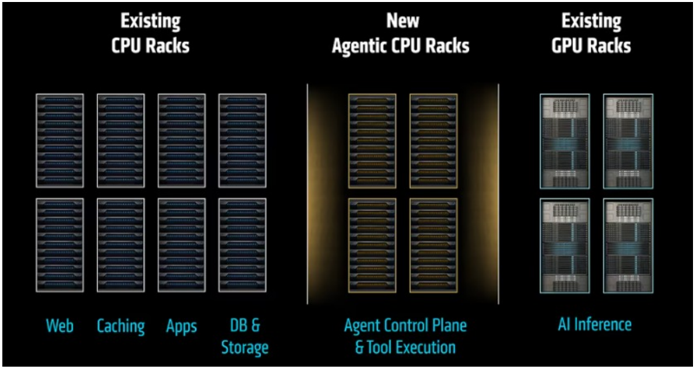
Source: AMD, Morgan Stanley Research
A bigger TAM
We now expect the total addressable market for server CPUs and memory to grow meaningfully faster than our prior framework implied.
- We lift our base case total server CPU TAM to US100bn+ previously, as we account for agentic sessions, concurrent usage and instructions per token.
- In our bull case, using a top-down AI data center capacity framework, we estimate total server CPU TAM could reach US$283bn by 2030.
- For memory, the same CPU-led framework implies a material uplift in DRAM demand, with agentic orchestration workloads driving ~74EB of incremental DRAM demand in our base case (or 1.7x 2026 total 45EB shipment) and ~221EB (4.9x this year’s DRAM market) in our bull case by 2030.
Recent developments
AMD raised the server CPU TAM bar materially
AMD’s 1Q26 call is the strongest CPU validation. Management now expects the server CPU TAM to grow >35% annually to >5.8bn, +57% YoY, with server CPU revenue up >50% YoY and Q2 server CPU revenue expected to grow >70% YoY.
Arm’s AGI CPU opportunity is scaling faster than expected
Arm reported record Q4 FYE26 revenue of 4.92bn, while data center royalties more than doubled YoY. More importantly, customer demand for the new Arm AGI CPU is now >$2bn across FYE27-28, more than double what was indicated at Arm Everywhere. Arm also says its CPU compute share is around 50% among
M
top hyperscalers, with the AGI CPU developed with Meta and positioned for agentic AI infrastructure.
Intel validated the CPU / foundry / packaging angle
Intel’s 1Q26 release explicitly said the shift from foundational models to inference to agentic AI is increasing demand for Intel’s CPUs, wafer capacity and advanced packaging. Intel also reported DCAI revenue of $5.1bn, +22% YoY, highlighted Xeon 6 as the host CPU for NVIDIA DGX Rubin NVL8, and noted Google’s continued Xeon deployment plus a custom ASIC infrastructure processing unit collaboration.
Meta-AWS Graviton deal is the clearest real-world agentic CPU deployment
Meta signed an agreement with AWS to deploy tens of millions of Graviton cores for agentic AI workloads. AWS framed this as CPU-intensive demand from real-time reasoning, code generation, search and multi-step task orchestration, while Meta said agentic AI is evolving to require more CPU and that no single chip architecture can serve every workload.
Microsoft explicitly framed the cycle as the ‘agentic computing era’
Microsoft’s FY3Q26 results used the phrase ‘agentic computing era’, with revenue of $82.9bn, +18% YoY. Management said it is focused on delivering cloud and AI infrastructure and solutions to help customers ‘eval-max’ outcomes in the agentic computing era.
Alphabet / Google Cloud reinforced full-stack AI infrastructure demand
Google Cloud revenue grew 63% YoY to US750mn to accelerate partner-led agentic AI development across its 120,000-member ecosystem, and introduced new TPU hardware (TPU 8t / 8i) designed for agentic workloads.
Memory LTAs are the most important structural change
Samsung and SK hynix have indicated they are moving toward 3-5 year LTAs with Big Tech customers. Memory and advanced packaging specifications for custom AI chips are increasingly locked in at the design stage, and that L TAs may include mechanisms such as price floors, supply volume commitments and binding agreements with very large up-front payments.
M
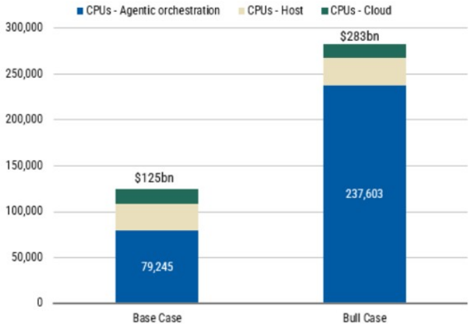
Base Case CPU TAM to US$125bn
We revisit our CPU TAM model. As per our initial note, Rise of the AI Agent - Global Implications , we maintain our bear case TAM of US125bn by 2030 as we account for agentic sessions, concurrent use and instructions per token. We also see a higher bull case which using a Top-Down model we estimate could reach US$283bn.
A reminder of our thesis
We believe agentic AI will increase the CPU-to-GPU mix in AI systems by adding more orchestration, memory, and tool-use work around each model call. This should not reduce GPU demand, but it does increase overall system complexity and shifts incremental infrastructure spend toward CPUs, networking, and memory. In this environment, the advantage is less about owning the accelerator and more about owning the system architecture.
The initial GenAI wave was dominated by GPU-centric model-serving, with relatively light control-plane overhead. Agentic inference introduces multi-step workflows (plan, retrieve, call tools, execute, iterate), greater reliance on persistent memory and external tools/APIs, and higher orchestration complexity.
Exhibit 4: The inference fabric framework
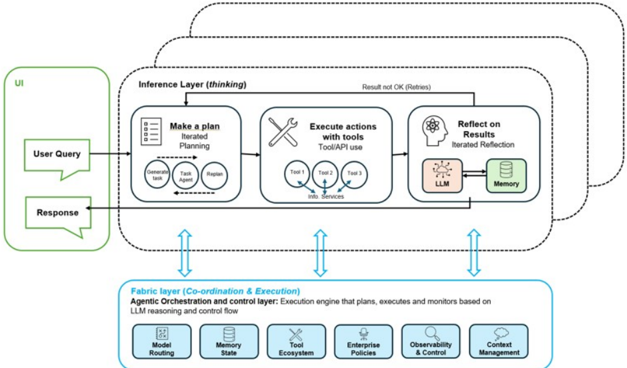
Source: Morgan Stanley Research
From US125bn
In our initial note, Rise of the AI Agent - Global Implications , we parsed the Host CPUs from Orchestration CPUs. We used Mercury data to estimate the Host CPU market (Grace, Vera, Graviton etc) at US1.2Trn, note Nvidia are talking to this being as large as US30-
M
60bn implied a CPU TAM of US120bn.
In deriving the Orchestration CPU TAM we take two different approaches: (i) a bottom-up model identifying agents per session, concurrent usage of compute and instructions per token; and (ii) a top-down model identifying GW installed per annum, implied racks and the ratio of CPU:GPU.
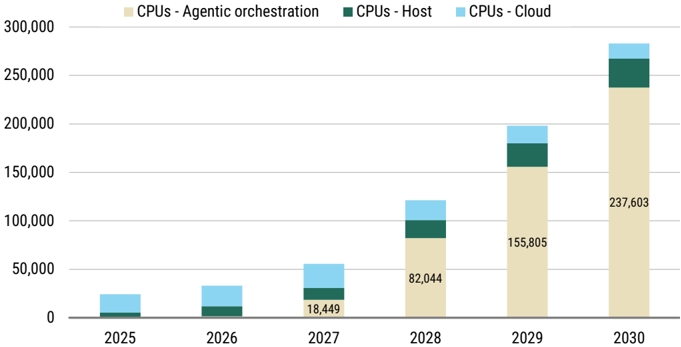
Exhibit 5: We lift our base case Orchestration CPU TAM to 60bn).
Exhibit 6: Our bull case implies a $238bn CPU orchestration TAM.
| TAM 2030 ($bn) | Orch. | Host + cloud | Total |
|---|---|---|---|
| Bear Case | 32 | 45 | 77 |
| Base (current) model | 60 | 45 | 105 |
| Base (new) Bottom-Up model | 79 | 45 | 125 |
| Bull Top-Down model | 238 | 45 | 283 |
Source: Morgan Stanley Research estimates
Source: Morgan Stanley Research estimates (e)
Assumptions underlying our model
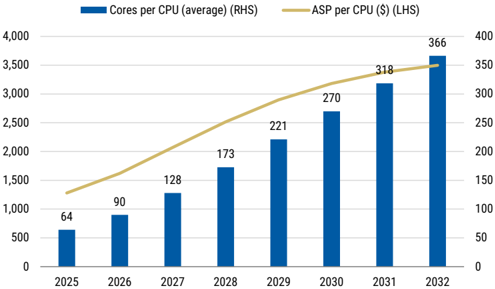
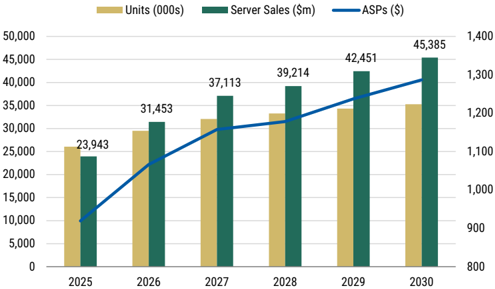
We assume in both our bottom-up and top-down model that a new generation of CPUs per annum implies that pricing per core declines 10% yy. However, in-line with current core trends we expect core counts per CPU to grow from 64 today to c.130 by FY27 and to 200-500+ by 2030. All in, this implies the FY27 ASP per CPU to come in at US 3,000 by 2030. For the head node market we model a combination of head node CPUs and regular CPU cloud servers. We expect CPU server sales to grow from US45bn FY30.
Exhibit 7: We model the ASP per CPU to grow in-line with cores per CPU.
Exhibit 8: We continue to expect CPU server sales to grow to $45bn by 2030.
Source: Morgan Stanley Research estimates
Source: Morgan Stanley Research estimates
M
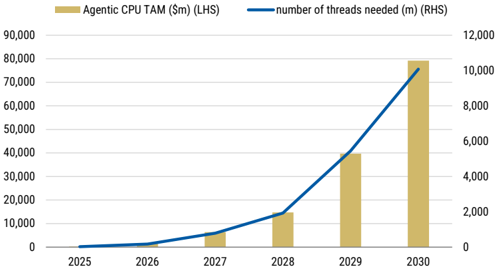
A US$79bn agentic CPU TAM base case…
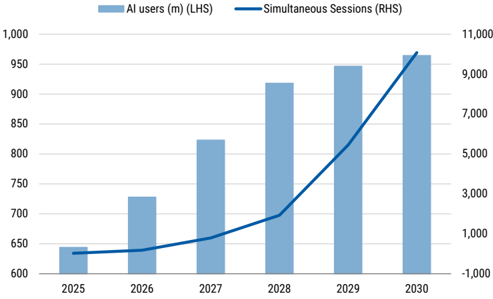
In deriving our base case we lean on the heavy use of agentic workflows by knowledge workers while assuming that single thread CPUs dominate. In this bottom-up model we estimate c.1bn knowledge workers globally by 2032 with the geographic mix as 50% Asia, c.25% Europe and 10 to 15% US. We estimate an AI take-up amongst knowledge workers of 78% for FY26 growing to 99% by 2030, while we model the occurrence of concurrent sessions to grow from 4% in FY26 to 19% in 2030. We assume from therein concurrency flattens at 15-20%. While 2 threads per core is the standard today, we see that reducing on the growing incidence of single threaded CPU cores amidst the need for power efficiency. We model the hyperthreading multiplier to decrease from 2 in 2026 to c.1.5 in 2030 implying the true availability of cores to grow at a 33% CAGR FY25 to FY29. On agentic use today we think today 6 agents per sessions is an accurate representation. However we expect this could almost reach 100 agents per session by 2032. We note this may still be conservative as exponential growth would imply trillions of agents per session. Assuming 1 session per thread, this implies 25mn CPUs by 2030. Applying our pricing assumptions this sets our base case orchestration TAM at US125bn CPU TAM.
Exhibit 9: We model simultaneous sessions to grow at a 176% CAGR from FY26 to FY30.
Exhibit 10: Our base case implies a $79bn Agentic CPU TAM by 2030.
Source: Morgan Stanley Research estimates
Source: Morgan Stanley Research estimates
… with our bull case implying a US$238bn agentic CPU TAM.
To derive our bull case we look top-down at what AI data centre installed GW capacity may imply for the CPU:GPU ratio. Our Morgan Stanley global estimates imply AI data centre installed capacity grows from 24GW today before flattening to 35GW in the outer years. Using Nvidia racks as a market proxy we take the power budget per rack to calculate the GPU and CPU power draw per rack and what that would imply for the number of CPUs and GPUs per rack. Assuming pricing for Host CPUs are largely the same as orchestration CPUs this implies a 238bn FY30. Accounting for host and cloud CPUs, our Bull Case CPU TAM is US$283bn.
M
Exhibit 11: In our top-down model, we estimate the Agentic CPU TAM to grow at a 251% CAGR from FY26 to FY30.
Source: Morgan Stanley Research estimates
M
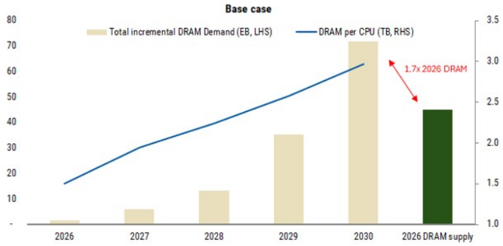
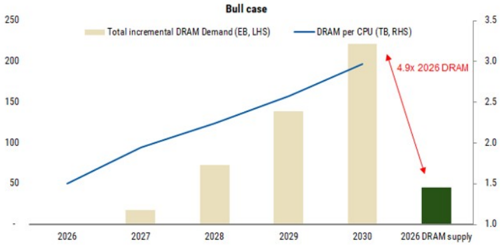
Raising Memory TAM
The revised CPU model materially raises the memory opportunity. Our prior framework estimated 15-45EB of incremental DRAM demand by 2030. We now estimate ~74EB in our base case and ~221EB in our bull case.
Agentic AI changes memory TAM in two ways: It raises the effective context per request and increases the amount of CPU-side memory provisioned per AI rack. As a result, the marginal memory demand shifts away from hot HBM alone and increasingly into host DRAM and rack SSD, where retained context, intermediate state and warm KV live closest to the CPU.
We keep the model intentionally simple:
Incremental DRAM demand = orchestration CPU units × DRAM per CPU
Our previous framework assumed 10-15mn incremental orchestration CPUs and 1.5-3.0TB DRAM per CPU, implying 15-45EB of incremental DRAM demand by 2030. The updated CPU TAM model points to a much larger orchestration CPU base. In our new base case, the US244bn orchestration CPU TAM implies a much larger CPU pool and roughly 221EB of incremental DRAM demand by 2030.
Exhibit 12: Base case: agentic orchestration drives ~74EB incremental DRAM by 2030
Exhibit 13: Bull case: DRAM demand reaches ~221EB as orchestration CPU racks scale
Source: Morgan Stanley Research
Source: Morgan Stanley Research
M
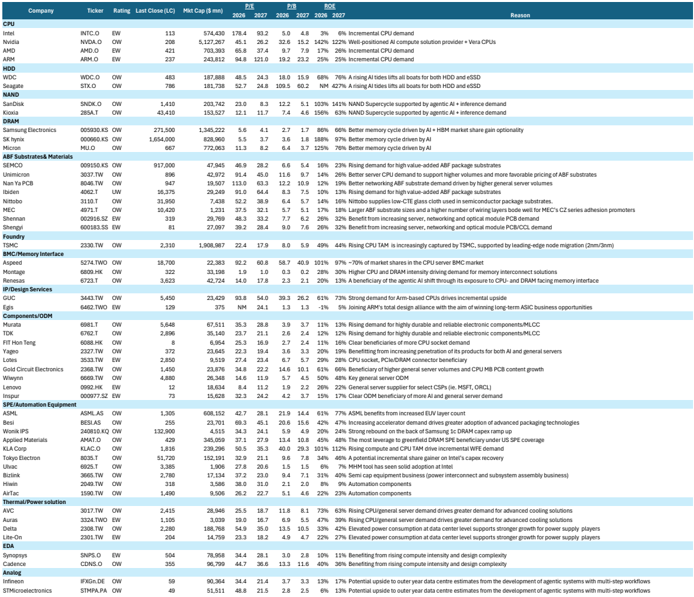
Agentic AI - Global Beneficiaries
Exhibit 14: Agentic AI Beneficiaries
| Company | Ticker Rating Last | Close | (LC) | MktCap($mn) | 2027 2026 2027 2026 2027 Reason P/B ROE | P/E |
|---|---|---|---|---|---|---|
| CPU | ||||||
| Intel | INTC.O | 113 | 574,430 | 93.2 5.0 4.8 3% 6% Incremental CPUdemand | 93.2 5.0 4.8 3% 6% Incremental CPUdemand | |
| Nvidia | NVDA.O | EW OW | 208 | 5,127,267 | 26.2 32.6 15.2 142% 122% Well-positioned AI compute solution provider + VeraCPUs | 26.2 32.6 15.2 142% 122% Well-positioned AI compute solution provider + VeraCPUs |
| AMD | AMD.O | EW | 421 | 703,393 | 37.4 9.7 7.9 17% 26% Incremental CPUdemand | 37.4 9.7 7.9 17% 26% Incremental CPUdemand |
| ARM | ARM.O | EW | 237 | 243,812 | 121.0 19.2 23.2 25% 25% Incremental CPUdemand | 121.0 19.2 23.2 25% 25% Incremental CPUdemand |
| HDD | WDC.O | 483 | 187,888 | 24.3 18.0 15.9 68% 76% A rising AI tides lifts all boats for bothHDDandeSSD | 24.3 18.0 15.9 68% 76% A rising AI tides lifts all boats for bothHDDandeSSD | |
| WDC Seagate | STX.O | OW OW | 786 | 181,738 | 24.8 109.5 60.2 NM 427% A rising AI tides lifts all boats for bothHDDandeSSD | 24.8 109.5 60.2 NM 427% A rising AI tides lifts all boats for bothHDDandeSSD |
| NAND | SNDK.O | OW | 1,410 | 203,742 | 8.3 12.2 5.1 103% 141% NANDSupercycle supported by agentic AI + inference demand | 8.3 12.2 5.1 103% 141% NANDSupercycle supported by agentic AI + inference demand |
| SanDisk Kioxia | 285A.T | OW | 43,410 | 153,527 | 11.7 7.4 4.6 156% 63% NANDSupercycle supported by agentic AI + inference demand | 11.7 7.4 4.6 156% 63% NANDSupercycle supported by agentic AI + inference demand |
| DRAM Samsung Electronics | 005930.KS | OW | 271,500 | 1,345,222 | 4.1 2.7 1.7 86% 66% Better memory cycle driven by AI + HBMmarket share gain optionality | 4.1 2.7 1.7 86% 66% Better memory cycle driven by AI + HBMmarket share gain optionality |
| SK hynix | 000660.KS | OW | 1,654,000 | 828,960 | 3.7 3.6 1.8 188% 97% Better memory cycle driven by AI | 3.7 3.6 1.8 188% 97% Better memory cycle driven by AI |
| Micron | MU.O OW | 667 | 772,063 | 3.7 125% 76% Better memory cycle driven by AI | 3.7 125% 76% Better memory cycle driven by AI | |
| ABFSubstrates& Materials | 11.3 8.2 6.4 | 11.3 8.2 6.4 | ||||
| SEMCO | 009150.KS OW | 917,000 | 47,945 | 28.2 6.6 5.4 16% 23% Rising demand for high value-added ABF package substrates 9.7 | 28.2 6.6 5.4 16% 23% Rising demand for high value-added ABF package substrates 9.7 | |
| Unimicron | 3037.TW | OW | 896 | 42,972 | 14% 26% Better serverCPUdemand to support higher volumes and more favorable pricing of ABF substrates | 14% 26% Better serverCPUdemand to support higher volumes and more favorable pricing of ABF substrates |
| NanYaPCB | 8046.TW | OW | 947 | 19,507 | 45.0 11.6 63.3 12.2 10.9 12% 19% Better networking ABF substrate demand driven by higher general server volumes | 45.0 11.6 63.3 12.2 10.9 12% 19% Better networking ABF substrate demand driven by higher general server volumes |
| Ibiden | 4062.T UW | 16,375 | 29,249 | 64.4 8.3 7.5 10% 13% Rising demand for high value-added ABF package substrates | 64.4 8.3 7.5 10% 13% Rising demand for high value-added ABF package substrates | |
| Nittobo | 3110.T OW | 31,950 | 7,438 | 38.9 6.4 5.7 14% 16% Nittobo supplies low CTE glass cloth used in semiconductor package substrates. | 38.9 6.4 5.7 14% 16% Nittobo supplies low CTE glass cloth used in semiconductor package substrates. | |
| 4971.T | 10,420 | 32.1 | 32.1 | |||
| MEC | EW | OW | 1,231 | - 5.7 5.1 17% 18% Larger ABF substrate sizes and a higher number of wiring layers bode well for MEC’s CZ series adhesion promoters | - 5.7 5.1 17% 18% Larger ABF substrate sizes and a higher number of wiring layers bode well for MEC’s CZ series adhesion promoters | |
| Shennan | 002916.SZ 600183.SS | 319 | 29,769 | 33.2 7.7 6.2 26% 32% Benefit from increasing server, networking and optical modulePCB demand 28.4 9.0 7.6 optical module PCB/CCL demand | 33.2 7.7 6.2 26% 32% Benefit from increasing server, networking and optical modulePCB demand 28.4 9.0 7.6 optical module PCB/CCL demand | |
| Shengyi Foundry | EW | 81 | 27,097 | 26% 32% Benefit from increasing server, networking and | 26% 32% Benefit from increasing server, networking and | |
| TSMC | 2330.TW OW | 2,310 | 1,908,987 | 17.9 8.0 5.9 49% 44% RisingCPUTAM is increasingly captured by TSMC, supported by leading-edge node migration (2nm/3nm) | 17.9 8.0 5.9 49% 44% RisingCPUTAM is increasingly captured by TSMC, supported by leading-edge node migration (2nm/3nm) | |
| BMC/MemoryInterface | ||||||
| Aspeed | 5274.TWO OW | 18,700 | 22,383 | 60.8 58.7 40.9 101% 97% ~70% of market shares in the CPUserver BMCmarket | 60.8 58.7 40.9 101% 97% ~70% of market shares in the CPUserver BMCmarket | |
| Montage | 6809.HK | 322 | 33,198 | 0.3 0.2 28% 30% HigherCPUand DRAMintensity driving demand for memory interconnect solutions | 0.3 0.2 28% 30% HigherCPUand DRAMintensity driving demand for memory interconnect solutions | |
| OW | 1.0 17.8 | 1.0 17.8 | ||||
| Renesas | 6723.T | OW | 3,623 | 42,724 | 2.3 2.1 20% 13% A beneficiary of the agentic AI shift through its exposure to CPU- and DRAMfacing memory interface | 2.3 2.1 20% 13% A beneficiary of the agentic AI shift through its exposure to CPU- and DRAMfacing memory interface |
| IP/Design Services GUC | 3443.TW | OW | 5,450 | 23,429 | 54.0 39.3 26.2 61% 73% Strong demand for Arm-based CPUs drives incremental upside | 54.0 39.3 26.2 61% 73% Strong demand for Arm-based CPUs drives incremental upside |
| Egis | 6462.TWO | EW | 129 | 375 | 24.1 1.3 1.3 -1% 5% Joining ARM’s total design alliance with the aim of winning long-term ASIC business opportunities | 24.1 1.3 1.3 -1% 5% Joining ARM’s total design alliance with the aim of winning long-term ASIC business opportunities |
| Components/ODM | ||||||
| Murata | 6981.T | OW | 5,648 | 67,511 | 28.8 3.9 3.7 11% 13% Rising demand for highly durable and reliable electronic components/MLCC | 28.8 3.9 3.7 11% 13% Rising demand for highly durable and reliable electronic components/MLCC |
| TDK | 6762.T | OW | 2,896 | 35,140 | 21.1 2.6 2.4 12% 12% Rising demand for highly durable and reliable electronic components/MLCC | 21.1 2.6 2.4 12% 12% Rising demand for highly durable and reliable electronic components/MLCC |
| FIT Hon Teng | 6088.HK | OW | 8 | 6,954 | 16.9 2.7 2.4 11% 16% Clear beneficiaries of more CPUsocket demand | 16.9 2.7 2.4 11% 16% Clear beneficiaries of more CPUsocket demand |
| Yageo | 2327.TW | OW | 372 | 23,645 | 22.3 19.4 3.6 3.3 20% 19% Benefitting from increasing penetration of its products for both AI and general servers | 22.3 19.4 3.6 3.3 20% 19% Benefitting from increasing penetration of its products for both AI and general servers |
| Lotes | 3533.TW | EW | 2,850 | 9,519 | 23.4 6.7 5.7 29% 28% CPUsocket, PCIe/DRAM connector beneficiary | 23.4 6.7 5.7 29% 28% CPUsocket, PCIe/DRAM connector beneficiary |
| Gold Circuit Electronics | 2368.TW | OW | 1,450 | 23,876 | 34.8 22.2 14.6 10.1 61% 66% Beneficiary of higher general server volumes and CPUMBPCBcontentgrowth | 34.8 22.2 14.6 10.1 61% 66% Beneficiary of higher general server volumes and CPUMBPCBcontentgrowth |
| Wiwynn | 6669.TW | OW | 4,880 | 26,348 | 14.6 11.9 5.7 4.5 50% 48% Key general serverODM 8.4 | 14.6 11.9 5.7 4.5 50% 48% Key general serverODM 8.4 |
| Lenovo | 0992.HK | EW | 12 | 18,634 | 11.2 1.9 2.2 26% 22% General server supplier for select CSPs (ie. MSFT, ORCL) | 11.2 1.9 2.2 26% 22% General server supplier for select CSPs (ie. MSFT, ORCL) |
| Inspur SPE/Automation Equipment | 000977.SZ | EW | 73 | 15,628 | 24.2 4.2 3.7 15% 17% Clear ODMbeneficiary of more AI and general server demand | 24.2 4.2 3.7 15% 17% Clear ODMbeneficiary of more AI and general server demand |
| ASML | ASML.AS OW | 1,305 | 608,152 | 28.1 21.9 14.4 61% 77% ASML benefits from increased EUV layer count | 28.1 21.9 14.4 61% 77% ASML benefits from increased EUV layer count | |
| Besi | BESI.AS OW | 255 | 23,701 | 45.1 20.6 15.6 42% 47% Increasing accelerator demand drives greater adoption of advanced packaging technologies | 45.1 20.6 15.6 42% 47% Increasing accelerator demand drives greater adoption of advanced packaging technologies | |
| Wonik IPS | 240810.KQ OW | OW | 132,900 | 4,515 | 34.3 24.1 5.9 4.9 20% 24% Strong rebound on the back of Samsung 1c DRAMcapex ramp up | 34.3 24.1 5.9 4.9 20% 24% Strong rebound on the back of Samsung 1c DRAMcapex ramp up |
| Applied Materials | AMAT.O KLAC.O | 429 | 345,059 | 37.1 27.9 13.4 10.8 45% 48% The most leverage to greenfield DRAMSPEbeneficiary under US SPE coverage 50.5 | 37.1 27.9 13.4 10.8 45% 48% The most leverage to greenfield DRAMSPEbeneficiary under US SPE coverage 50.5 | |
| KLA Corp | OW | 1,816 | 239,296 | 35.3 40.0 29.3 101% 112% Rising compute and CPUTAMdrive incremental WFEdemand | 35.3 40.0 29.3 101% 112% Rising compute and CPUTAMdrive incremental WFEdemand | |
| Tokyo Electron | 8035.T | OW | 51,720 | 152,191 | 21.1 9.6 7.8 34% 46% A potential incremental share gainer on Intel’s capex recovery | |
| Ulvac | 6925.T | OW | 3,385 | 1,906 | 20.6 1.5 1.5 6% 7% MHMtool has seen solid adoption at Intel | 20.6 1.5 1.5 6% 7% MHMtool has seen solid adoption at Intel |
| Bizlink | 3665.TW | 2,780 | 17,134 | interconnect and subsystem assembly business) | ||
| Hiwin | 2049.TW | OW OW | 318 | 3,586 | 23.0 9.4 7.1 31% 40% Semi cap equipment business (power 31.0 2.1 2.0 8% 9% Automation components | 23.0 9.4 7.1 31% 40% Semi cap equipment business (power 31.0 2.1 2.0 8% 9% Automation components |
| AirTac | 1590.TW | 1,490 | 9,506 | 5.1 4.6 22% 23% Automation components | 5.1 4.6 22% 23% Automation components | |
| Thermal/Power | OW | 22.7 | 22.7 | |||
| solution AVC | 3017.TW OW | 2,415 | 28,946 | 18.7 11.8 8.1 73% 63% Rising CPU/general server demand drives greater demand for advanced cooling solutions | 18.7 11.8 8.1 73% 63% Rising CPU/general server demand drives greater demand for advanced cooling solutions | |
| Auras | 3324.TWO | EW | 1,105 | 3,039 | 16.7 6.9 5.5 47% 39% Rising CPU/general server demand drives greater demand for advanced cooling solutions | 16.7 6.9 5.5 47% 39% Rising CPU/general server demand drives greater demand for advanced cooling solutions |
| Delta | 2308.TW | OW | 2,280 | 188,768 | 35.0 13.5 10.5 33% 42% Elevated power consumption at data center level supports stronger growth for power supply players | 35.0 13.5 10.5 33% 42% Elevated power consumption at data center level supports stronger growth for power supply players |
| Lite-On | 2301.TW | 204 | 14,759 | 18.2 4.9 4.7 22% 27% Elevated power consumption at data center level supports stronger growth for power supply players | 18.2 4.9 4.7 22% 27% Elevated power consumption at data center level supports stronger growth for power supply players | |
| EW | ||||||
| EDA | SNPS.O | EW | 504 | 78,958 | 28.1 3.0 | |
| Synopsys Cadence | CDNS.O | OW | 355 | 96,799 | 2.8 10% 11% Benefiting from rising compute intensity and design complexity 36.6 13.3 11.6 40% 36% Benefiting from rising compute intensity and design complexity | 2.8 10% 11% Benefiting from rising compute intensity and design complexity 36.6 13.3 11.6 40% 36% Benefiting from rising compute intensity and design complexity |
| Analog | IFXGn.DE | OW | 59 | 90,364 | 21.4 3.7 3.3 13% 17% Potential upside to outer year data centre estimates from the development of agentic systems with multi-step workflows | 21.4 3.7 3.3 13% 17% Potential upside to outer year data centre estimates from the development of agentic systems with multi-step workflows |
| Infineon STMicroelectronics | STMPA.PA | OW | 49 | 51,511 | 21.5 2.8 2.5 6% 13% Potential upside to outer year data centre estimates from the development of agentic systems with multi-step workflows | 21.5 2.8 2.5 6% 13% Potential upside to outer year data centre estimates from the development of agentic systems with multi-step workflows |
Source: Factset, Morgan Stanley Research
M
This report references U.S. Executive Order 14032 and/or entities or securities that are designated thereunder. U.S. persons may be prohibited from buying certain securities of entities named in this report. Readers are solely responsible for ensuring that their investment activities are carried out in compliance with applicable laws.
This report references export controls and/or entities that may be subject to export control restrictions. Readers are solely responsible for ensuring that their investment or trade activities are carried out in compliance with applicable laws.
This report references U.S. Executive Order 14105 and/or entities that may be in scope of such order. U.S. persons may be prohibited from engaging in certain transactions or otherwise require certain other transactions be notified to the U.S. Department of Treasury. Readers are solely responsible for ensuring that their investment or trade activities are carried out in compliance with applicable laws.
M
Disclosure Section
The information and opinions in Morgan Stanley Research were prepared or are disseminated by Morgan Stanley & Co. LLC and/or Morgan Stanley C.T.V.M. S.A. and/or Morgan Stanley México, Casa de Bolsa, S.A. de C.V. and/or Morgan Stanley Canada Limited and/or Morgan Stanley & Co. International plc and/or Morgan Stanley Europe S.E. and/or RMB Morgan Stanley Proprietary Limited and/or Morgan Stanley MUFG Securities Co., Ltd. and/or Morgan Stanley Capital Group Japan Co., Ltd. and/or Morgan Stanley Asia Limited and/or Morgan Stanley Asia (Singapore) Pte. (Registration number 199206298Z) and/or Morgan Stanley Asia (Singapore) Securities Pte Ltd (Registration number 200008434H), regulated by the Monetary Authority of Singapore (which accepts legal responsibility for its contents and should be contacted with respect to any matters arising from, or in connection with, Morgan Stanley Research) and/or Morgan Stanley Taiwan Limited and/or Morgan Stanley & Co International plc, Seoul Branch, and/or Morgan Stanley Australia Limited (A.B.N. 67 003 734 576, holder of Australian financial services license No. 233742, which accepts responsibility for its contents), and/or Morgan Stanley Wealth Management Australia Pty Ltd (A.B.N. 19 009 145 555, holder of Australian financial services license No. 240813, which accepts responsibility for its contents), and/or Morgan Stanley India Company Private Limited having Corporate Identification No (CIN) U22990MH1998PTC115305, regulated by the Securities and Exchange Board of India (‘SEBI’) and holder of licenses as a Research Analyst (SEBI Registration No. INH000001105), Stock Broker (SEBI Stock Broker Registration No. INZ000244438), Merchant Banker (SEBI Registration No. INM000011203), and depository participant with National Securities Depository Limited (SEBI Registration No. IN-DP-NSDL-567-2021) having registered office at Altimus, Level 39 & 40, Pandurang Budhkar Marg, Worli, Mumbai 400018, India; Telephone no. +91-22-61181000; Compliance Officer Details: Mr. Tejarshi Hardas, Tel. No.: +91-22-61181000 or Email: tejarshi.hardas@morganstanley.com; Grievance officer details: Mr. Tejarshi Hardas, Tel. No.: +91-22-61181000 or Email: msic-compliance@morganstanley.com which accepts the responsibility for its contents and should be contacted with respect to any matters arising from, or in connection with, Morgan Stanley Research, and their affiliates (collectively, “Morgan Stanley”). Morgan Stanley India Company Private Limited (MSICPL) may use AI tools in providing research services. All recommendations contained herein are made by the duly qualified research analysts.
For important disclosures, stock price charts and equity rating histories regarding companies that are the subject of this report, please see the Morgan Stanley Research Disclosure Website at www.morganstanley.com/eqr/disclosures/webapp/generalresearch, or contact your investment representative or Morgan Stanley Research at 1585 Broadway, (Attention: Research Management), New York, NY, 10036 USA.
For valuation methodology and risks associated with any recommendation, rating or price target referenced in this research report, please contact the Client Support Team as follows: US/Canada +1 800 303-2495; Hong Kong +852 2848-5999; Latin America +1 718 754-5444 (U.S.); London +44 (0)20-7425-8169; Singapore +65 6834-6860; Sydney +61 (0)2-9770-1505; Tokyo +81 (0)3-6836-9000. Alternatively you may contact your investment representative or Morgan Stanley Research at 1585 Broadway, (Attention: Research Management), New York, NY 10036 USA.