標題用字
原檔名誤植「文華」,正名為「文曄」(3036 WT Microelectronics)。lib 頁與 wikilink 一律使用
文曄。
報告_MS_大聯大3702文華3036_20260519
PDF 原檔:報告_MS_大聯大3702文華3036_20260519_original.pdf
原始內容
M May 19, 2026 04:27 PM GMT
Greater China Semiconductors | Asia Pacific
Semi Distributors: AI Continues to Drive a Stronger Outlook
We raise our PT for WPG from after a strong 1Q beat and 2Q guidance. Raise PT for WT in light of a stronger outlook.
Key Takeaways
- WPG reported strong 1Q earnings with EPS 12% above MSe.
- WPG 2Q mid-point guidance implies 12% Q/Q revenue growth and 17% Q/Q EPS growth.
- WPG management remains positive on the secular AI-driven demand.
WPG reported strong 1Q earnings: WPG reported its 1Q results. The 1Q revenue was NT14.2bn, gross margin was 4.5%, +0.2ppt Q/Q and +0.8ppt Y/Y, 0.2ppt above our forecast. 1Q operating profit was NT3.17, +95% Q/Q and +192% Y/Y, 12% above our estimate. ROWC reached 15.2%, up from 11.5% in 4Q25. This follows the strong 1Q results of WT Micro: Scale drives operating leverage .
Strong 2Q guidance by WPG : The company guided for mid-point 2Q revenue of NT 3.86. The strong outlook is driven by continued global AI demand and capex guidance, and management expects continued strong demand from inference and edge AI.
Other highlights from WPG 1Q earnings : By application type, compute,
communication, consumer, industrial and auto accounted for 49%, 15%, 8%, 7% and 7%, respectively, which shows strong growth for compute and moderate growth for industrial and auto. By device type, memory and core component accounted for 45% and 23%, respectively. The reduction in the core component mix from 31% in 4Q25 represents the company’s drive to improve margins.
The AI story lifts earnings for both WT and WPG: Based on the actual 1Q results for WPG and strong guidance for 2Q forward, we raise our earnings estimates:
- WT - EPS up 12%, 17% and 16% for 2026-28, respectively;
- WPG - EPS up 32% for each 2026-28.
We raise price targets for WT from NT349 and for WPG from NT 160: We continue to use residual income valuation models; PT changes reflect our earnings estimate revisions.
Idea
Morgan Stanley Taiwan Limited+
Daniel Yen, CFA
Equity Analyst
+886 2 2730-2863
Charlie Chan
Equity Analyst
Charlie.Chan@morganstanley.com
+886 2 2730-1725
Morgan Stanley Asia Limited+
Daisy Dai, CFA
Equity Analyst
+852 2848-7310
Morgan Stanley Taiwan Limited+
Tiffany Yeh
Equity Analyst
+886 2 7712-3032
Morgan Stanley Asia Limited+
Ethan Jia
Research Associate
+852 3963-2287
Greater China Technology Semiconductors
Asia Pacific
Industry View
Attractive
What’s Changed
WT Microelectronics Co. Ltd.
(3036.TW)
From
To
Price Target
NT$299.00
NT$349.00
WPG Holdings (3702.TW) Price Target
From
To
NT$121.00
NT$160.00
Morgan Stanley does and seeks to do business with companies covered in Morgan Stanley Research. As a result, investors should be aware that the firm may have a conflict of interest that could affect the objectivity of Morgan Stanley Research. Investors should consider Morgan Stanley Research as only a single factor in making their investment decision.
For analyst certification and other important disclosures, refer to the Disclosure Section, located at the end of this report.
+= Analysts employed by non-U.S. affiliates are not registered with FINRA, may not be associated persons of the member and may not be subject to FINRA restrictions on communications with a subject company, public appearances and trading securities held by a research analyst account.
M
Reaction to earnings
Impact to our thesis
WPG Holdings
(3702.TW)
Strengthens our thesis
Financial results versus consensus
Modest upside
Source: Company data, Morgan Stanley Research
Direction of next 12-month consensus EPS
Modest revision higher
Idea
vI Mulo. Lammlys Lottate neviolullo cxmbll L. yudrtelly Tmlanlclal olatellelll
NT$ in million (YE Dec3!)
1Q25
Total Revenues
NT$ mn
Sequential Change
Net sales
Change us Year Alga
Cost of Sales
COGS
Gross Profit
Total Opex
R&D
Taxes
4Q27E
3Q27E
903,871
907,644
Old ‘27E
2.05
A43
24.000
3,190,724
1R.0
874,876
878,393
97%
3,089,720
97%
28,995
22k%
101,004
29,251
2222:
57,410
16,065
43,594
(5,014)
1Q28E
2Q28E
905,819
Diff.
912,276
10%
4.900
876,572
882.688
197%
29,246
12%
97%
29,587
2222
224%
15,782
17%
639
3Q25
4Q25
328,934
342,087
New ‘26E
4.00
25.80
2,635,483
306%
1Q26
2Q26E
494,273
636,710|
Old ‘26E
44.50
R2RE
2,432,079
14543
3Q26E
4Q26E
729,020
Diff.
775,480
14.56:
121 60%
8%
&4:
20.92
1Q27E
2Q27E
834,243
869,633
New ‘27E
26%
3,515,391
247,424
-FEZ
284.3
2Q25
259,503
4.20
6.50:
M
202
194
213
395
201
WT Micro: Estimate Revisions Summary
Percent oó Revenues
Operating Income
Percent of Revenues
Reported EPS
Total Non-operating Income(Loss)
Profit Before Taxes
Percent oó Revenues
Margins
Taxes
Tar Rate
13,105
2.00%
0.8%
9.944
2.002
21.83
(922)
s022
14%
5,660
1,722
1.50
5,991
1,25%
24.52
(862)
(843)
4,798
15%:
5,148
15%
(1,148)
11,957
1.82
20%
4,571
1852
(1,069)
3,501
14.2
1.82
4,660
180:
(710)
3,951
1.5:
Exhibit 1: WT Micro: Earnings Estimate Revisions
Percent oó Revenues
Ohange us Y’ear Ago
Pretax margin
Reported EPS (NT$. TV GAAP)
Oange us Y’ear Ago
242
10,388
143
10,881
12,816
1.22
13,186
1.2e
13,805
3Q28E
4Q28E
918,952
923,111
New ‘28E
3,660, 157
889.013
892,893
87%
1970%
3,541,167
29,939
118,990
30,218
.226%
62,949
227%
56,041
15,601
(5,294)
50,747
#8 s0a
3,676
3,692
Q4X
10,657
11,395
11,262
12%
40,068
14,224
2025
2026E
1,177,949
2,635,483
Old ‘28E
22.83
3,317,994
122.83
1,130,325
2,548,000
197%
3,212,067
47,624
87,483
4,04.3
105,927
2.22%
27%
57,064
841
26,742
43,165
2.26
16%
48,863
810
1,894
(5,294)
a.t:
6,538
43,568
9,149
10,920
19,393
30,351
16%
34,397
20,882
121
44,318
122
14,617
2027E
2028E
3,515,391
3,660,157
Diff.
10%
224.3
4.k3
3,402,122
3.541,167
9,7%
113,269
12%
970%
118,990
2222
63,252
182
15%
2.461
14,062
16%
226%
4.8
62,949
2,562
ati
14,641
Q43:
46,729
1.2
50,018
16%
45,746
122:
56,041
We raise EPS estimates 12%, 17% and 16% for 2026-28, respectively: We raise our expectations for the company’s data center business to reflect a stronger outlook.
nả ahã Nã
3.22%
1.42%
1.28%
3.17%
2,505
2ts
1.37%
1.21%
2,622
2130
0.1 ppt
0.1 ppt aỗ anà
0.1 ppt
2,791
213
1.53%
3.25%
1.39%
n° asl
3.19%
3,833
8,496
223:
215:
13,544
1.47%
1.31%
2,698
2t%
10,148
9,451
215:
0.1 ppt
35,549
10,657
0.1 ppt
0.1 ppt
31,327
205:
40,068
| 1.19% 1.64% 1.22% 1.63% 3.40 3.67 5.30 | 0.0 ppt | 1.01% 1.80% 0.96% 1.80% | 0.1 ppt | nế 3ã | 1.09% 1.72% 12 | 1.04% 1.72% 0.1 ppt 24.52 1043 28.10 31.69 |
|---|---|---|---|---|---|---|
| 0.0 ppt | 0.0 ppt | 0.0 ppt |
Net margin
Opex %
Source: Company data, Morgan Stanley Research estimates
Exhibit 2: Quarterly Financial Statement
Source: Company data, Morgan Stanley Research estimates
Hã anã
1.12:
12%
122
1.51%
143:
1.54%
0.0 ppt
1.20
4.23
841,624
28.009
2222
2RR:
15%
RỮ азі
CxmDIL 4.
NT$million
Total Equity
23
21
Net Profit
ROAE
Spread
PE (x)
vur o. neoluual muottle muuel vI. Mistoncal f/c
2026E
31,327
2027E
153,407
35,549
2028E
174,472
40,068
2029E
184,830
44,075
2030E
196,223
48,482
M
13
WT Micro: Valuation Methodology
Equity Value
No. of Shares
7
5
Projected Price (NT$)
3
2018
2019
2020
2022
Exhibit 3: WPG: Residual Income Model
Source: Morgan Stanley Research estimates
441,043
349
1,265
134,612
2031E
2033E
208,756
2032E
222,542
53,331
58,664
237,706
64,530
26.3% 27.2% 28.0%
28.0%
27,005
30,537
34,419
13.8%
14.6%
15.5%
2034E
254,387
70,983
28.8%
38,685
16.3%
2036E
292,920
85,889
30.4%
48,528
17.8%
2037E
315,123
94,478
31.1%
54,194
18.5%
Our updated price target is NT$349: We update our residual income model to reflect earnings estimate revisions. Our key RI assumptions are unchanged: cost of equity of 12.6% (2.0% risk-free rate, 11.8% risk premium, 0.9 beta), cash dividend payout ratio of 85%, intermediate growth rate of 10.0% and a long-term growth rate of 3.0%.
Exhibit 4: WT: Historical P/E
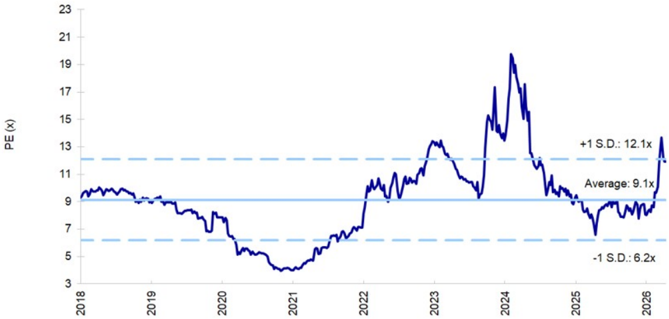
Source: Factset, company data, Morgan Stanley Research estimates
2035E
272,736
78,081
29.6%
43,374
17.1%
M
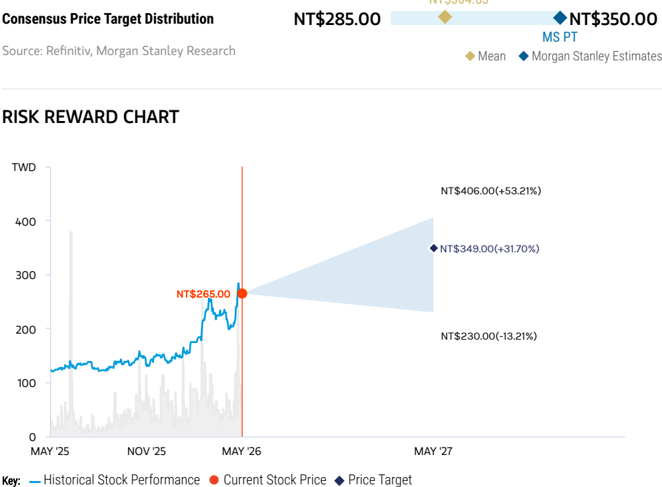
Risk Reward - WT Microelectronics Co. Ltd. (3036.TW) Risk Reward - WT Microelectronics Co. Ltd. (3036.TW)
Outgrowth from non-GPU components to drive distributors’ ongoing outperformance
NT$349.00 PRICE TARGET
Base case, residual income model. We assume a cost of equity of 12.6% (2% risk-free rate, 11.8% risk premium, 0.9 beta), a medium-term growth rate of 10% and a long-term growth rate of 3%.
NT$304.83
NT$349.00
14.2x 2026e EPS
BASE CASE
Strong AI ASIC growth in 2026: The AI semis industry continues to thrive in 2026 and 2027. WT Micro generates a revenue CAGR of 45%+ from 2025-28. Gross margin to be slightly diluted, to 3.3%+ in 2026, as a result of unfavorable product mix.
Source: Refinitiv, Morgan Stanley Research
BULL CASE
16.6x 2026e EPS
Stronger AI semi consumption with improved gross margin: The AI semis industry shows + 60% Y/Y growth in 2026. WT Micro generates a revenue CAGR of 60%+ from 2025-28. Gross margin remains at 4% despite growth in low-margin business. Opex is lighter, given productivity improvement. Market share and ROWC expand further. WT Micro enjoys cost savings and product line enhancement from more efficient use of capital.
NT$406.00
OVERWEIGHT THESIS
- We see continual value growth for semi distributors amid increasing supply chain complexity.
- WT Micro has expanded its business into the fast-growing AI industry, especially data center-related component distribution. We estimate that WT’s data center segment could contribute 64% of the company’s revenue in 2028.
- Our price target implies 14.2x our 2026 EPS estimate, above its 8.9x average oneyear forward P/E since 2018, which we find justified by improving demand and the company’s continued progress in penetrating the AI supply chain.
NT$230.00
9.4x 2026e EPS
BEAR CASE
Disappointing end demand, with share loss; ASIC business faces challenges: Revenue growth decelerates amid data center demand slowdown and share loss amid a weakening macro environment.
M
Risk Reward - WT Microelectronics Co. Ltd. (3036.TW)
KEY EARNINGS INPUTS
| Drivers | 2025 | 2026e | 2027e | 2028e |
|---|---|---|---|---|
| Gross margin rate (%) | 4.04 | 3.32 | 3.22 | 3.25 |
| Operating margin rate (%) | 1.8 | 1.7 | 1.4 | 1.5 |
INVESTMENT DRIVERS
- Growth in dividend payout
- Operating margin expansion
- Progress of ASIC business
- Continual expansion of market share
GLOBAL REVENUE EXPOSURE
Source: Morgan Stanley Research Estimate View explanation of regional hierarchies here
MS ALPHA MODELS
1/5
MOST
3 Month
Horizon
Source: Refinitiv, FactSet, Morgan Stanley Research; 1 is the highest favored Quintile and 5 is the least favored Quintile
RISKS TO PT/RATING
RISKS TO UPSIDE
- Margin trends up even amid low-margin AI business.
- Global semi inventory drops, reflecting strong mobile device demand.
- Market share expands.
RISKS TO DOWNSIDE
- Margin trends down dramatically amid slowerthan-expected AI-semi development.
- Global semi inventory rises, reflecting poor mobile/PC device demand.
- Market share lost.
OWNERSHIP POSITIONING
Inst. Owners, % Active
73.6%
Source: Refinitiv, Morgan Stanley Research
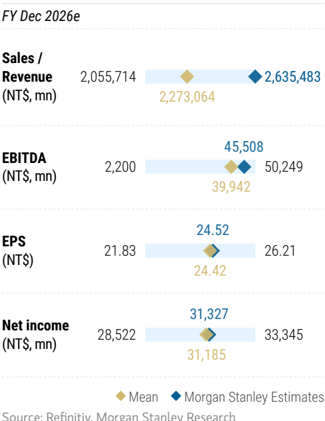
MS ESTIMATES VS. CONSENSUS
Cambio. vro. Lammys Cotale neviolullo
NTS in million (YE Dec3/)
Total Revenues
NTS mn
Sequential Change
Change us Year Ago
Net sales
COGS
Cost of Sales
Gross Profit
Total Opex
2Q25
250,452
2043
1Q25
248,834
2.4%
26.05
3Q25
244,467
-2.43€
•FRE
Old ‘26E
2Q26E
3Q26E
342,144
1,201,529
New ‘26E
4Q25
255.356|
4.50
1R.25
1026
1,343,909
4Q26E
330,264
Diff.
12%
2Q27E
3Q27E
New ‘27E
346,984
1,405,714
M
RED
Percent of Revenues
Taxes ace:
o
ads aces
WPG: Estimate Revisions Summary
Operating Income
Percent of Revenues
Reported EPS
Total Non-operating Income(Loss)
Profit Before Taxes
Percent of Revenues
Margins
Taxes
Gross margin
Tar Rate
Reported Income (TV GAAP)
Operating margin
Percent of Revenues
Change ys Year Ago
Pretax margin
Reported EPS (NT$. TV GAAP)
Net margin
Opex %
32%
12.51
9.50
Diff.
2Q28E
3Q28E
383,005
392,581
16%
16%
29%
30%
32%
32%
New ‘28E
4Q28E
2024
402,395
880,552
- 23
1,551,645
1,485,268
66,377
31,991
34,386
(5,105)
29,281
5,913
23,076
13.18
Old ‘28E
2025
2026E
999,110
1,343,909
- 555
1,337,407
1,280,271
57,136
30,768
26,368
(3,808)
22,560
4,738
17,531
10.01
Diff.
2027E
2028E
1,405,714
1,551,645
16%
4.603
1243:
16%
30%
30%
32%
32%
We raise 2026-28e EPS by 32% each: This factors in the 1Q26 revenue result and 2Q26 guidance. We expect the strong AI computing-driven growth to more than offset a weak non-AI outlook, driving 34.5% Y/Y revenue growth in 2026, and maintain that growth into 2028. We also expect AI supply chain to drive elevated gross margin levels, from 3.96% in 2025 to ~4.3% from 2026 to 2028. 0.2 ppt -0.2 ppt 1.49% 2.06% 1.31% 2.30% 0.2 ppt -0.2 ppt
9.68
4.28%
2.32%
1.82%
1.41%
12.82
5,430
2.10%
(1,521)
3,909
1.5%
878
4.35%
22%
2,843
2.55%
Lt:
2.13%
1.62
1.67%
4,906
1.90%
(1,795)
3,111
12%
833
27%
2.136
aste
1.25
20:
1.96%
1.80%
Change us Year Ago
5,350
2K0:
(1.311)
4,039
1736
781
3.178
1.2r
1.81
4,284
152%
(1,688)
2,596
100:
618
243:
1,898
1.08
403
Exhibit 6: WPG: Earnings Estimate Revisions
Source: Company data, Morgan Stanley Research estimates
Exhibit 7: Quarterly Financial Statement
Source: Company data, Morgan Stanley Research estimates
1Q27E
338,521
4Q27E
1Q28E
364,550
Old ‘27E
1,211,624
1,159,862
51,762
25,994
25,768
(4,336)
CAmole 7.
NT$million
Total Equity
22
Net Profit
ROAE
vur o. neoluual mootte mouel vr o. Tlolutival r/L
2026E
108,449
2028E
117,014
2029E
123,831
131,022
M
Spread
14.5%
11.0%
2030E
25,684
20.2%
13,203
10.7%
WPG: Valuation Methodology
12
PV of Continuing Value
Equity Value
No. of Shares
Projected Price (NTS)
8
6
Exhibit 8: WPG: Residual Income Model
Source: Morgan Stanley Research estimates
98,738
1,751
280,247
160
101,426
2027E
2031E
138,609
27,097
20.1%
13,895
10.6%
2032E
146,614
28,587
20.0%
14,625
10.6%
2034E
163,968
31,818
19.9%
16,208
10.5%
2035E
173,367
33,568
19.9%
17,065
10.4%
2036E
35,415
183,283
19.9%
17,970
10.4%
Our updated price target is NT$160: We update our residual income model to reflect earnings estimate revisions. Our key RI assumptions remain: cost of equity of 9.5% (1.5% risk-free rate, 6% risk premium, 1.34 beta), cash dividend payout ratio of 80%, mediumterm growth rate of 5.5% and long-term growth rate of 2.0%.
Exhibit 9: WPG: Historical P/E
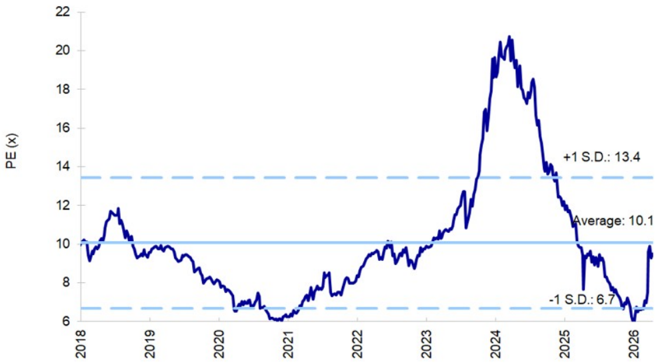
Source: Factset, company data, Morgan Stanley Research estimates
2033E
155,059
30,160
20.0%
15,395
10.5%
M
Risk Reward - WPG Holdings (3702.TW) Risk Reward - WPG Holdings (3702.TW)
Outgrowth from non-GPU components to drive distributors’ ongoing outperformance
NT$160.00 PRICE TARGET
Base case, residual income model. We assume a cost of equity of 9.5% (1.5% risk-free rate, 6% risk premium, 1.34 beta), a medium-term growth rate of 5.5% and a long-term growth rate of 2.0%.
RISK REWARD CHART
Key:
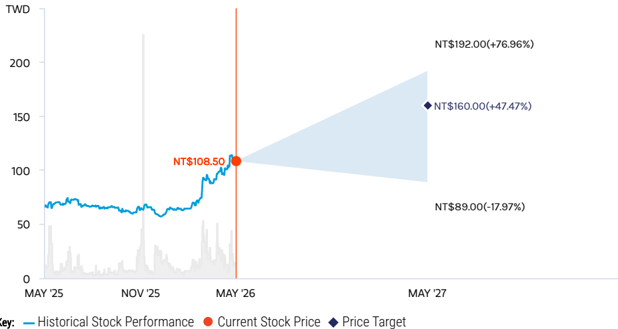
Source: Refinitiv, Morgan Stanley Research
15.0x 2026e EPS
BULL CASE
NT$192.00
Stronger non - AI semi consumption with improved gross margin : The semis industry shows +40% Y/Y growth in 2026. WPG generates revenue growth of +40% Y/Y in 2026. Gross margin rises to 5%+ vs. 3.96% in 2025. Opex is lighter given productivity improvement. Market share and ROWC expand further. WPG enjoys cost savings and product line enhancement from more efficient use of capital.
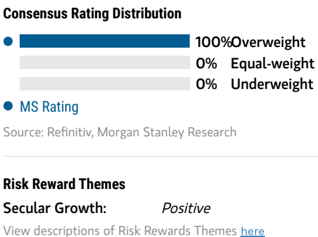
OVERWEIGHT THESIS
- WPG still has high revenue exposure to consumer markets, which are likely to remain weak given high memory costs.
- However, the AI story is now strong enough to lift earnings for WPG.
- WPG has limited exposure to AI GPUs (most of which go through direct sales) and AI ASICs, but has good exposure to AI computing. 1Q26 revenue featured demand from CPU, networking, memory and PMIC.
- Our PT implies 12.5x 2026e EPS vs. 100%+ EPS growth in 2026
▪ ▪ ▪ ▪
Risk Reward Themes
Pricing Power:
Positive
Secular Growth:
Positive
View descriptions of Risk Rewards Themes here
BEAR CASE
6.9x 2026e EPS
Non - AI semi demand contracts in view of macro risk : The non-AI semis industry shows a 15% Y/Y decline in 2026. WPG’s revenue decreases -15% Y/Y in 2026. Gross margin is down to 3.0% vs. 3.96% in 2025. Opex increases. Market share is lost to competitors.
NT$89.00
BASE CASE
NT$160.00
12.5x 2026e EPS
AI lifts earnings in 2026: The non-AI semis industry remains sluggish in 2026. WPG generates revenue growth of 34.5% Y/Y in 2026. Gross margin rises to 4.35% in 2026 vs. 3.96% in 2025.
M
Risk Reward - WPG Holdings (3702.TW)
KEY EARNINGS INPUTS
| Drivers | 2025 | 2026e | 2027e | 2028e |
|---|---|---|---|---|
| Gross margin rate (%) | 3.96 | 4.35 | 4.28 | 4.28 |
| Operating margin rate (%) | 2.0 | 2.5 | 2.4 | 2.2 |
| Automotive revenue (NT$, mn) | 34,969 | 47,037 | 49,200 | 54,308 |
| Industrial revenue (NT$, mn) | 89,920 | 120,952 | 126,514 | 139,648 |
| IoT and other revenue (NT$, mn) | 109,902 | 147,830 | 154,629 | 170,681 |
INVESTMENT DRIVERS
- Growth in dividend payout
- Operating margin expansion
- Progress of non-3C business
- Continual non-operating investments
GLOBAL REVENUE EXPOSURE
Source: Morgan Stanley Research Estimate View explanation of regional hierarchies here
MS ALPHA MODELS
3 Month
Horizon
Source: Refinitiv, FactSet, Morgan Stanley Research; 1 is the highest favored Quintile and 5 is the least favored Quintile
RISKS TO PT/RATING
RISKS TO UPSIDE
- Margin trends up amid better-than-expected non-AI business.
- Global semi inventory drops, reflecting strong mobile device demand.
- Market share expands.
RISKS TO DOWNSIDE
- Margin trends down dramatically amid slowerthan-expected non-3C business development and pressure on client margins.
- Global semi inventory rises, reflecting poor mobile/PC device demand.
- Market share is lost.
OWNERSHIP POSITIONING
Inst. Owners, % Active
73.9%
Source: Refinitiv, Morgan Stanley Research
MS ESTIMATES VS. CONSENSUS
M
Risk Reward Reference links
- View explanation of Options Probabilities methodology -Options_Probabilities_Exhibit_Link.pdf
- View descriptions of Risk Rewards Themes - RR_Themes_Exhibit_Link.pdf
- View explanation of regional hierarchies - GEG_Exhibit_Link.pdf
- View explanation of Theme/Exposure methodology -ESG_Sustainable_Solutions_External_Link.pdf
- View explanation of HERS methodology - ESG_HERS_External_Link.pdf
M
Disclosure Section
The information and opinions in Morgan Stanley Research were prepared or are disseminated by Morgan Stanley Asia Limited (which accepts the responsibility for its contents) and/or Morgan Stanley Asia (Singapore) Pte. (Registration number 199206298Z) and/or Morgan Stanley Asia (Singapore) Securities Pte Ltd (Registration number 200008434H), regulated by the Monetary Authority of Singapore (which accepts legal responsibility for its contents and should be contacted with respect to any matters arising from, or in connection with, Morgan Stanley Research), and/or Morgan Stanley Taiwan Limited and/or Morgan Stanley & Co International plc, Seoul Branch, and/or Morgan Stanley Australia Limited (A.B.N. 67 003 734 576, holder of Australian financial services license No. 233742, which accepts responsibility for its contents), and/or Morgan Stanley Wealth Management Australia Pty Ltd (A.B.N. 19 009 145 555, holder of Australian financial services license No. 240813, which accepts responsibility for its contents), and/or Morgan Stanley India Company Private Limited having Corporate Identification No (CIN) U22990MH1998PTC115305, regulated by the Securities and Exchange Board of India (‘SEBI’) and holder of licenses as a Research Analyst (SEBI Registration No. INH000001105); Stock Broker (SEBI Stock Broker Registration No. INZ000244438), Merchant Banker (SEBI Registration No. INM000011203), and depository participant with National Securities Depository Limited (SEBI Registration No. IN-DP-NSDL-567-2021) having registered office at Altimus, Level 39 & 40, Pandurang Budhkar Marg, Worli, Mumbai 400018, India; Telephone no. +91-22-61181000; Compliance Officer Details: Mr. Tejarshi Hardas, Tel. No.: +91-22-61181000 or Email: tejarshi.hardas@morganstanley.com; Grievance officer details: Mr. Tejarshi Hardas, Tel. No.: +91-22-61181000 or Email: msic-compliance@morganstanley.com which accepts the responsibility for its contents and should be contacted with respect to any matters arising from, or in connection with, Morgan Stanley Research, and their affiliates (collectively, “Morgan Stanley”). Morgan Stanley India Company Private Limited (MSICPL) may use AI tools in providing research services. All recommendations contained herein are made by the duly qualified research analysts.
For important disclosures, stock price charts and equity rating histories regarding companies that are the subject of this report, please see the Morgan Stanley Research Disclosure Website at www.morganstanley.com/eqr/disclosures/webapp/generalresearch, or contact your investment representative or Morgan Stanley Research at 1585 Broadway, (Attention: Research Management), New York, NY, 10036 USA.
For valuation methodology and risks associated with any recommendation, rating or price target referenced in this research report, please contact the Client Support Team as follows: US/Canada +1 800 303-2495; Hong Kong +852 2848-5999; Latin America +1 718 754-5444 (U.S.); London +44 (0)20-7425-8169; Singapore +65 6834-6860; Sydney +61 (0)2-9770-1505; Tokyo +81 (0)3-6836-9000. Alternatively you may contact your investment representative or Morgan Stanley Research at 1585 Broadway, (Attention: Research Management), New York, NY 10036 USA.