PDF 原檔:6488_20260630_Nomura_original.pdf
圖片清單(已驗證 2026-06-30)
| 檔名 | size | 分類 | 親眼所見內容 |
|---|---|---|---|
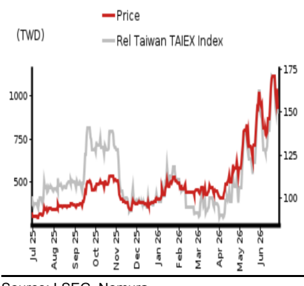
| 6488_20260630_Nomura_001.png | 36KB | 裝飾·logo·banner | 股價相對表現縮圖,無座標標示 |
| 6488_20260630_Nomura_002.png | 81KB | 真資料圖 | Fig.1 nVidia Feynman GPU 樓層圖與剖面圖:Feynman(A16?) die 兩兩堆疊、左右側 HBM4E 與 I/O;剖面標 Carrier silicon→SiC(?)、GPU die(A16?) hybrid bond、reconstituted interposer(6-7x ret.)、microbump、LSI |
| 6488_20260630_Nomura_003.png | 42KB | 真資料圖 | Fig.5 GWC P/E band 歷史走勢圖 |
| 6488_20260630_Nomura_004.png | 52KB | 真資料圖 | Fig.6 GWC P/B vs ROE 歷史走勢圖 |
| 6488_20260630_Nomura_005.png | 110KB | 真資料圖 | 三年評等與目標價歷史圖:股價走勢 + 表列 21-May-26 Buy TP850、05-Nov-24 Neutral TP480、24-Jul-23 Buy TP600,收盤 936(26-Jun-26) |
原始內容
Relative performance chart
EQUITY: TECHNOLOGY
Price
(TWD)
10001
7501
5001
150
-125
-100
GlobalWafers 6488.TWO 6488 TT
EQUITY: TECHNOLOGY
Churra. I CEC Namura
Refreshed semi wafer cycle and material
Continued improvement in semi wafer supply/demand dynamics; new SiC opportunity in sight
Action: maintain Buy and raise TP to TWD1,200, implying 28% upside
In our Anchor Report of May 2026, 'Greater China Semi - A guide to Semi renaissance in 2026-30F,' we highlighted a variety of emerging semiconductor technologies for 2027F, such as wafer-bonded NAND, backside power deliver (BPD), and photonics SOI demand, and noted that improving semiconductor wafer supply/demand dynamics had us believe that some related supply-chain names including Globalwafers (GWC) could be among the key beneficiaries of such technologies. We see potential upside for GWC's fundamentals in the near and long term, including: (1) continued improvement in the semiconductor wafer cycle and pricing environment; and (2) SiC possibly acting as an emerging new material in advanced packaging toward 2028F. We thus raise our TP for GWC to TWD1,200 (from TWD850), based on 4.8x 2028F BVPS of TWD252 (previously 3.2x 2028F BVPS). We raise our 2026-28F earnings by 11-41%. The stock is trading at 3.7x 2028F BVPS of TWD252.
Semi wafer supply/demand: rising demand with continuously improving spot price
In our previously published reports (link 1 , link 2 ), we had indicated some bottom-up checks, including: (1) a spot price recovery of around 5-10% h-h in 1H26F, and another 10% h-h recovery in 2H26F; and (2) the leading semi wafer companies potentially running at tight utilization rates for 12″ semi wafers. We now expect the magnitude of spot price hikes in 2H26F to surpass our previous estimates as now both memory companies and logic foundries are procuring increasingly more semi wafers (vs previously procurement was mainly driven by memory companies). With customers procuring higher volumes than previously committed, we expect companies such as GWC to hike prices. As the spot price was 20% lower than the LTA price during 2023-25, after the spot price hike in 2026F, we expect some semi wafers' spot prices to be on par with the LTA price by end-2026F.
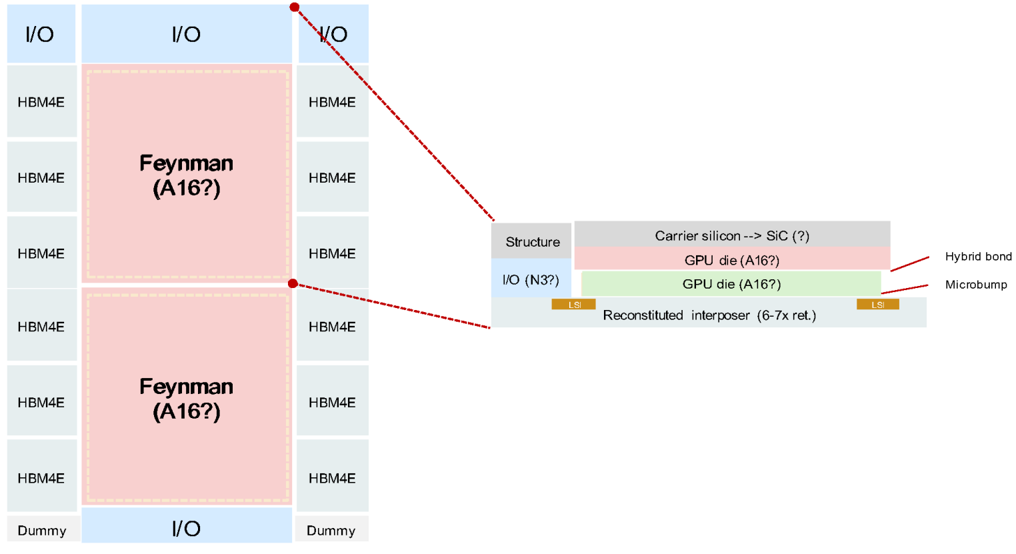
SiC for advanced packaging may start with chip-level thermal plate in Feynman
We expect nVidia's (NVDA US, Not rated) next-gen GPU (Feynman) to target the GPU-onGPU SoIC stack which would lead to higher computational power even with limited growth interposer reticle size. Given rising heat dissipation requirements, Feynman could start adopting SiC thermal plates which function as an integrated silicon carrier (fill up the height gap in between GPU and HBM) and thermal interface material (TIM); Fig. 1 . We believe this will contribute around 5-10% to GWC's total revenue from 2028F at the earliest (Fig. 2 ).
| Year-end 31 Dec Currency (TWD) | FY25 Actual | Old | FY26F New | Old | FY27F New | Old | FY28F New |
|---|---|---|---|---|---|---|---|
| Revenue (mn) | 60,598 | 61,159 | 61,726 | 71,372 | 73,535 | 83,460 | 88,666 |
| Reported net profit (mn) | 7,311 | 8,248 | 11,633 | 10,825 | 12,082 | 15,322 | 19,163 |
| Normalised net profit (mn) | 7,311 | 8,248 | 11,633 | 10,825 | 12,082 | 15,322 | 19,163 |
| FD normalised EPS | 15.36 | 17.25 | 24.33 | 22.64 | 25.27 | 32.05 | 40.08 |
| FD norm. EPS growth (%) | -29.8 | 12.3 | 58.4 | 31.3 | 3.9 | 41.5 | 58.6 |
| FD normalised P/E (x) | 60.9 | - | 38.5 | - | 37.0 | - | 23.4 |
| EV/EBITDA (x) | 32.7 | - | 34.6 | - | 24.3 | - | 16.0 |
| Price/book (x) | 4.8 | - | 4.5 | - | 4.2 | - | 3.7 |
| Dividend yield (%) | 0.7 | - | 1.2 | - | 1.2 | - | 1.6 |
| ROE (%) | 7.9 | 8.6 | 12.0 | 10.6 | 11.7 | 13.9 | 16.9 |
| Net debt/equity (%) | 7.1 | 3.8 | net cash | 0.3 | net cash | net cash | net cash |
Source: Company data, Nomura estimates
Global Markets Research 30 June 2026
| Rating Remains | Buy |
|---|---|
| Target price Increased from TWD 850.00 | TWD 1,200.00 |
| Closing price 26 June 2026 | TWD 936.00 |
| Implied upside | +28.2% |
| Market Cap (USD mn) | 14,033.5 |
| ADT (USD mn) | 161.7 |
Relative performance chart
Source: LSEG, Nomura
Research Analysts
Semiconductor
Donnie Teng - NIHK donnie.teng@nomura.com +852 2252 1439
Aaron Jeng, CFA - NITB
aaron.jeng@nomura.com +886(2) 21769962
Production Complete: 2026-06-29 20:30 UTC
Key data on GlobalWafers
Performance
| (%) | 1M | 3M | 12M | ||
|---|---|---|---|---|---|
| Absolute (TWD) | 8.1 | 105.9 | 194.3 | M cap (USDmn) | 14,033.5 |
| Absolute (USD) | 6.6 | 106.1 | 167.8 | Free float (%) | 27.5 |
| Rel to Taiwan TAIEX Index | 5.7 | 72.2 | 96.2 | 3-mth ADT (USDmn) | 161.7 |
Income statement (TWDmn)
| Year-end 31 Dec | FY24 | FY25 | FY26F | FY27F | FY28F |
|---|---|---|---|---|---|
| Revenue | 62,626 | 60,598 | 61,726 | 73,535 | 88,666 |
| Cost of goods sold | -42,823 | -45,974 | -48,565 | -54,686 | -60,324 |
| Gross profit | 19,804 | 14,624 | 13,162 | 18,850 | 28,342 |
| SG&A | -3,365 | -3,770 | -3,988 | -4,412 | -5,024 |
| Employee share expense | -2,320 | -2,218 | -2,109 | -2,427 | -2,834 |
| Operating profit | 14,119 | 8,636 | 7,065 | 12,011 | 20,485 |
| EBITDA | 18,987 | 13,797 | 12,587 | 17,870 | 26,559 |
| Depreciation | -4,829 | -5,120 | -5,478 | -5,812 | -6,026 |
| Amortisation | -39 | -41 | -44 | -47 | -48 |
| EBIT | 14,119 | 8,636 | 7,065 | 12,011 | 20,485 |
| Net interest expense | 2,489 | 1,124 | 3,386 | 3,479 | 4,083 |
| Associates & JCEs | 186 | 85 | 15 | 0 | 0 |
| Other income | -4,364 | -329 | 4,365 | 0 | 0 |
| Earnings before tax | 12,429 | 9,516 | 14,831 | 15,490 | 24,568 |
| Income tax | -2,590 | -2,205 | -3,197 | -3,408 | -5,405 |
| Net profit after tax | 9,840 | 7,311 | 11,633 | 12,082 | 19,163 |
| Minority interests | 7 | 0 | 0 | 0 | 0 |
| Other items | 0 | 0 | 0 | 0 | 0 |
| Preferred dividends | 0 | 0 | 0 | 0 | 0 |
| Normalised NPAT | 9,847 | 7,311 | 11,633 | 12,082 | 19,163 |
| Extraordinary items | 0 | 0 | 0 | 0 | 0 |
| Reported NPAT | 9,847 | 7,311 | 11,633 | 12,082 | 19,163 |
| Dividends | -5,259 | -3,290 | -5,235 | -5,437 | -7,068 |
| Transfer to reserves | 4,588 | 4,021 | 6,398 | 6,645 | 12,095 |
| Valuations and ratios | |||||
| Reported P/E (x) | 42.3 | 60.9 | 38.5 | 37.0 | 23.4 |
| Normalised P/E (x) | 42.3 | 60.9 | 38.5 | 37.0 | 23.4 |
| FD normalised P/E (x) | 42.7 | 60.9 | 38.5 | 37.0 | 23.4 |
| Dividend yield (%) | 1.2 | 0.7 | 1.2 | 1.2 | 1.6 |
| Price/cashflow (x) | 16.2 | - | 9.7 | 28.4 | 19.8 |
| Price/book (x) | 4.9 | 4.8 | 4.5 | 4.2 | 3.7 |
| EV/EBITDA (x) | 23.3 | 32.7 | 34.6 | 24.3 | 16.0 |
| EV/EBIT (x) | 31.2 | 52.1 | 61.7 | 36.1 | 20.8 |
| Gross margin (%) | 31.6 | 24.1 | 21.3 | 25.6 | 32.0 |
| EBITDA margin (%) | 30.3 | 22.8 | 20.4 | 24.3 | 30.0 |
| EBIT margin (%) | 22.5 | 14.3 | 11.4 | 16.3 | 23.1 |
| Net margin (%) | 15.7 | 12.1 | 18.8 | 16.4 | 21.6 |
| Effective tax rate (%) | 20.8 | 23.2 | 21.6 | 22.0 | 22.0 |
| Dividend payout (%) | 53.4 | 45.0 | 45.0 | 45.0 | 36.9 |
| ROE (%) | 12.5 | 7.9 | 12.0 | 11.7 | 16.9 |
| ROA (pretax %) | 8.2 | 4.5 | 3.7 | 6.3 | 10.5 |
| Growth (%) | |||||
| Revenue | -11.4 | -3.2 | 1.9 | 19.1 | 20.6 |
| EBITDA | -24.0 | -27.3 | -8.8 | 42.0 | 48.6 |
| Normalised EPS | -51.8 | -30.6 | 58.4 | 3.9 | 58.6 |
| Normalised FDEPS | -51.8 | -29.8 | 58.4 | 3.9 | 58.6 |
Source: Company data, Nomura estimates
Cashflow statement (TWDmn)
| Year-end 31 Dec | FY24 | FY25 | FY26F | FY27F | FY28F | FY28F |
|---|---|---|---|---|---|---|
| EBITDA | 18,987 | 13,797 | 12,587 | 17,870 | 26,559 | 26,559 |
| Change in working capital Other operating cashflow | 11,289 -4,298 | -28,021 | 28,805 | -2,179 | -2,649 | -2,649 |
| Cashflow from operations | 25,978 | -1,297 | 4,570 | 71 15,762 | -1,322 22,589 | -1,322 22,589 |
| Capital expenditure | -48,319 | -15,520 | 45,962 -25,033 | -20,956 | -17,398 | -17,398 |
| -22,342 | -33,130 -48,650 | 20,929 | -5,193 | 5,190 | 5,190 | |
| Free cashflow | ||||||
| Reduction in investments | -6,052 | 498 | -127 | 0 | 0 | 0 |
| Net acquisitions | 0 | 0 | 0 | 0 | 0 | 0 |
| Dec in other LT assets | 4,302 | 39,845 | 14,538 | 13,418 | 8,679 | 8,679 |
| Inc in other LT liabilities | 0 | 0 | 0 | 0 | ||
| Adjustments | 0 | 0 | 0 | 0 | 0 | 0 |
| CF after investing acts | -24,092 | -8,307 | 35,339 | 8,224 | 13,869 | 13,869 |
| Cash dividends | -8,748 | -5,259 | -3,290 | -5,235 | -5,437 | -5,437 |
| Equity issue | 0 | 0 | 0 | 0 | 0 | 0 |
| Debt issue | 9,776 | -11,511 | -7,141 | 0 | 0 | 0 |
| Convertible debt | 0 | 0 | 0 | 0 | 0 | 0 |
| issue Others | 35,829 | 5,632 | -14,495 | 0 | 0 | 0 |
| CF from financial | acts 36,857 | -11,139 | -24,927 | -5,235 | -5,437 | -5,437 |
| Net cashflow | 12,765 | -19,445 | 10,413 | 2,989 | 8,432 | 8,432 |
| Beginning cash | 26,165 | 29,896 | 32,886 | 32,886 | ||
| Ending cash | 38,929 | 38,929 | 19,484 | |||
| Ending net debt | 19,484 | 29,897 | 32,886 | 41,318 | 41,318 | |
| Balance sheet | -13,891 | |||||
| (TWDmn) | -1,282 | 6,652 | -10,901 | -22,323 | -22,323 | |
| As at 31 Dec Cash & equivalents | FY24 38,929 29 | FY25 | FY26F 19,484 29,896 | FY27F 32,886 | FY28F 41,318 0 | FY28F 41,318 0 |
| Marketable securities Accounts receivable | 10,265 | 1 | 0 9,586 | 0 11,497 | ||
| Inventories | 10,113 10,399 | 10,148 | 11,090 | 13,889 12,114 | 13,889 12,114 | |
| Other current | 11,238 20,030 | 46,632 | 31,636 | 31,636 | 31,636 | 31,636 |
| assets Total current assets | 80,492 | 87,109 | 98,956 | 98,956 | ||
| LT investments | 7,445 | 86,629 6,947 | 81,266 7,074 | 7,074 | 7,074 | 7,074 |
| Fixed assets | 119,074 0 | 107,241 | 111,560 | 113,239 0 | 115,885 | 115,885 |
| Goodwill Other | 0 | 0 | 0 | 0 | ||
| intangible assets Other LT assets | 0 | 0 | 0 | 0 | 0 | 0 |
| 17,570 | 18,179 | 18,179 | 18,179 | 18,179 | ||
| Total assets | 224,581 | 17,525 218,343 | 218,080 | 225,602 | 240,094 | 240,094 |
| Short-term debt | 27,117 | 18,571 | 14,252 | 14,252 | 14,252 | 14,252 |
| Accounts payable | 4,464 | 5,138 | 5,905 | 5,905 | ||
| Other current | 5,371 | 4,161 | 44,105 | 44,105 | 44,105 | 44,105 |
| liabilities Total current liabilities | 32,577 | 31,377 54,109 | 63,495 | 64,262 | 64,262 | |
| Long-term debt | 65,065 10,531 | 7,565 | 62,821 | 4,743 | 4,743 | 4,743 |
| Convertible debt | 0 | 0 | 4,743 0 | 0 | 0 | 0 |
| Other LT liabilities Total liabilities | 57,958 | 63,374 125,048 | 50,690 118,254 | 50,690 118,929 | 50,690 119,695 | 50,690 119,695 |
| 133,553 | -4 | -4 | -4 | -4 | ||
| Minority interest | -3 | -3 0 | 0 | 0 | 0 | |
| Preferred stock | 0 | 0 4,781 | 4,781 | 4,781 | 4,781 | |
| Common stock Retained | 4,781 | 4,781 | 47,769 | 59,864 | 59,864 | |
| earnings Proposed | 37,451 3,290 | 41,124 5,235 | 5,437 | 7,068 | 7,068 | |
| dividends | 31,640 5,259 | 48,690 | 48,690 | |||
| Other equity and Total shareholders' | 49,350 91,030 | 47,776 93,298 | 48,690 99,830 | 48,690 106,677 | 120,403 | 120,403 |
| reserves equity | ||||||
| Total equity & liabilities | 224,580 | 218,342 | 225,602 | 240,094 | 240,094 | |
| Liquidity (x) | ||||||
| 218,080 | ||||||
| Current ratio | net cash net cash | 0.48 7.1 | 1.24 1.60 1.29 - - - net cash cash | 1.37 - net cash net cash | 1.54 - net cash net cash | 1.54 - net cash net cash |
| Interest cover Leverage Net debt/EBITDA | (x) | net | ||||
| Net debt/equity (%) Per share Reported EPS (TWD) | 22.14 22.14 21.90 | 15.36 15.36 15.36 | 24.33 24.33 | 25.27 25.27 | 40.08 40.08 | 40.08 40.08 |
| Norm EPS (TWD) FD norm EPS (TWD) BVPS (TWD) | 190.39 | 195.14 6.88 | 24.33 | 223.12 | 251.83 | 251.83 |
| DPS (TWD) | 11.00 | 25.27 | 40.08 | 40.08 | ||
| 11.37 | 14.78 | 14.78 | ||||
| (days) | 208.80 10.95 | |||||
| Activity | 58.2 | 52.4 | 52.4 | |||
| 59.4 | 61.4 | 77.2 | 52.3 70.9 | 70.4 | 70.4 | |
| Days receivable Days inventory | 87.8 | 85.9 37.8 | 32.4 | 32.0 | 33.5 | 33.5 |
| Days payable Cash cycle | 44.3 | 109.4 | ||||
| 102.9 | ||||||
| 103.0 | ||||||
| 89.3 | ||||||
| 91.2 |
Source: Company data, Nomura estimates
Company profile
GlobalWafers is the world's third-largest and largest non-Japanese wafer manufacturer that specializing in 3' to 12' silicon wafer manufacturing, possessing a complete production line from ingot growth, slicing, etching, diffusion, polishing and epitaxy.
Valuation Methodology
Our TP of TWD1200 is based on 4.8x 2028F BVPS TWD252. The 4.8x P/B is based on the upper-half of 2-6x P/B range during the full Semi wafer cycle in 2017-2020. The benchmark index is TAIEX.
Risks that may impede the achievement of the target price
Downside risks include: · Faster-than-expected entry of China into the 12' semi wafer market. · Slower-than-expected of market consolidation. · Worse-than-expected end-demand for the semi industry. · Less favorable demand/supply dynamics in the semi wafer industry. · Less favorable FX volatility and rising material/utility costs.
ESG
In response to global climate change and latest development trends in corporate social responsibilities (CSR), GlobalWafers has taken the initiative to compile a CSR report. Based on long-term in-depth interactions with local communities and engagement with stakeholders, GlobalWafers discloses in the report relevant information on material issues regarding the four aspects of corporate governance, economy, environment, and society, as well as execution & improvement results, in addition to presenting the the future vision and goals in terms of sustainable development.
Ur u anu Trom anle motmet mohlaue matchlatrniwy
Note
11 Annual shipment
Ulu tlelmal plate lo lunlutlol do alt mel g'aleu omuun valel a up tie helgm yap m wetweeh
I/0
HBM4E
HBM4E
ASP per 12" SiC substrate (USD)(5)
HBM4E
GWC market share (%)(7)
HBM4E
HBM4E
HBM4E
Dummy
1/0
VO
Feynman shipment (mn)(1)
Fig. 1: The floor plan and cross-section chart of nVidia's Feynman GPU
SiC thermal plate to function as an intergrated silicon carrier (fill up the height gap in between GPU and HBM) and thermal interface material (TIM)
Source: Nomura estimates, Company data
Fig. 2: The revenue contribution assumption for SiC thermal plate for Feynman
Source: Nomura estimates
Net Sales
(TWD mn)
Net Sales
Gross profit
15,595
Previous
2Q25
3Q25
2026F
16,008
61,159
Revised
1Q26
4Q25
14,493
Change (%; pp) Previous
14,502
13,985
61,726
4,112
4,123
2,662
3,726
0.9
2,914
71,372
Earnings forecast revisions
2027F
2Q26F 3Q26F 4Q26F
15,396
15,762
16,584
2025
60,598
8,636
14,624
83,460
9,516
3,358
Revised Change (%; pp) Previous
3,208
18,850
23,593
16,752
1,669
73,535
1,797
6,445
We revise up our 2026-28F earnings forecasts by 11-41%. We expect a moderate revenue recovery in 2026F, but believe revenues will accelerate from 2H26F onward, as well as a more favorable supply-demand environment in 2027-28F. YTD 2026, GWC has also recognized meaningful non-operating gains from its investment in Siltronic (WAF GR, Not rated) due to the sharp rise in Siltronic's share price. We have not yet factored any Siltronic stock price impact into our forecasts from 2H26F onward. 19,644 1.3 20.1 18.4 4.75 7,312 5.11 15.36
EPS
EPS
In the near term, we believe GWC's profitability is still under pressure due to rising depreciation costs from new capacity expansion, but as market demand continues to grow, we believe price hike potential is also likely to increase. 4.7%
Op income
Fig. 3: GWC: earnings estimate revisions
204.2%
2,909
12,011
7.7%
-54.9%
-54.9%
3.0
3,682
2,123
7.0
3,129
4.1
18.1%
7.6%
7.6%
15.5%
17.1%
12.0%
-19.3%
-14.0%
174.7%
165.2%
| 3.4% | -8.7% -11.3% -10.3% | -8.7% -11.3% -10.3% | -8.7% -11.3% -10.3% | 8.8% 14.4% -3.2% | 8.8% 14.4% -3.2% | 8.8% 14.4% -3.2% | 19.1% 20.6% | 19.1% 20.6% | 19.1% 20.6% |
|---|---|---|---|---|---|---|---|---|---|
| -20.4% | 4.5% -16.7% | 44.2% | -24.2% -29.1% | -3.8% -22.2% | 26.1% | -1.2% -26.2% | 1.9% -10.0% | 43.2% | 50.4% |
| -34.7% | -27.6% | -61.6% -33.6% | 43.0% | -31.6% | 46.2% -10.8% | -38.8% | -18.2% | 70.0% | 70.6% |
| -35.2% | -38.3% 265.2% | 10.0% | 181.6% | 33.0% | 7.6% -23.4% | 55.8% | 4.4% | 58.6% | |
| -53.2% -58.8% | 41.6% | -33.3% 360.5% | 30.2% | 198.9% | 15.2% 10.7% | -25.7% | 59.1% | 3.9% | 58.6% |
Growth (YoY)
Net Sales
Gross profit
Op income
Pretax income
Net income
Source: Nomura estimates
Fig. 4: GWC: P&L
Source: Company data, Nomura estimates
2026F
2028F
2027F
Revised Change (%; pp)
73,535
88,666
88,666
61,726
6.2
7,065
28,342
12,011
14,831
15,490
11,633
20,485
12,082
19,163
24,568
21.3%
25.6%
11.4%
40.1
16.3%
24.0%
21.1%
18.8%
32.0
23.1
16.4%
24.33
25.27
21.6
13,162
18,850
28,342
20.1
20,485
24,568
19,163
25.1
22.3
25.1
32.0%
- 1%
25.1
27.7%
21.6%
3.0
3.7
3.3
40.08
50
45
40
35
30
25
20
15
10
5
10/28/2014
Valuation methodology and risks
9
6
5
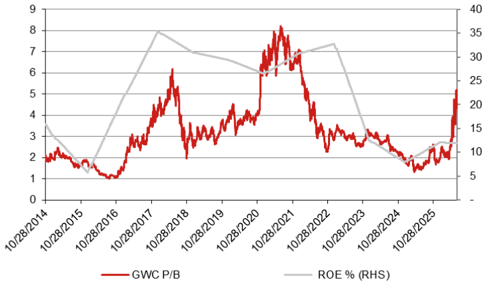
Our new TP of TWD1,200 is based on 4.8x 2028F BVPS of TWD252. The 4.8x target multiple is at the upper-half of the historical P/B range of 2-6x during the full semi wafer cycle in 2017-20. 2
Downside risks include:
- Faster-than-expected entry of China into the 12' semi wafer market.
- Slower-than-expected of market consolidation.
- Worse-than-expected end-demand for the semi industry.
- Less favorable demand/supply dynamics in the semi wafer industry.
- Less favorable FX volatility and rising material/utility costs.
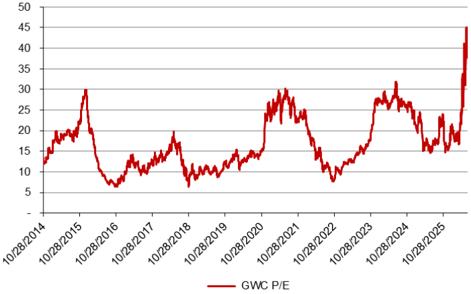
Fig. 5: GWC: P/E
Source: Bloomberg, Nomura estimates
Fig. 6: GWC: P/B
Source: Bloomberg, Nomura estimates
10/28/2018
10/28/2017
10/28/2019
GWC P/B
10/28/2020
1
10/28/2021
10/28/2022
10/28/2023
10/28/2024
10/28/2025
ROE % (RHS)
35
30
25
20
15
10
5
Rating and target price chart (three year history)
GlobalWafers
Appendix A-1
1100.00
1000.00
900.00
800.00
700.00
600.00
400.00
300.00
200.00
100.00
As of 29-Jun-2026
Currency = TWD
Di
21
21
05
05
24
24
This report has been produced by Nomura International (Hong Kong) Ltd. (NIHK), Hong Kong.
See Disclaimers for Nomura Group entity details.