圖片清單(已驗證 2026-07-02)
| 檔名 | size | 分類 | 親眼所見內容 |
|---|---|---|---|
| _001.png | 27KB | 裝飾·valuation | 股價表現圖 |
| _002.png | 39KB | 裝飾·valuation | 稅前/營業利益率趨勢圖 |
| _003.png | 48KB | 裝飾·valuation | 1-year forward PER 圖 |
全數為財務/估值圖表 → lib 頁不嵌入。
PDF 原檔:260701_1319_東陽_daiwa_Tong Yang_original.pdf
原始內容
Taiwan
Tong Yang Industry (1319 TT)
Target price:
TWD81.00 (from TWD102.00)
Share price (30 Jun):
TWD77.40 | Up/downside: +4.7%
Downgrading: waiting for better order visibility
- QTD unaudited pre-tax income came in below expectations
- EPS likely to see downward revisions
- Downgrading to Hold (3) from Outperform (2); new 12M TP of TWD81
What's new: Tong Yang released its unaudited profit data for May 2026 after market hours on 15 June 2026. We downgrade Tong Yang to Hold (3) from Outperform (2), as we believe weaker-than-expected earnings for 5M26 are partially factored into its share price, but we do not see any nearterm share price catalysts and see some pressure to cut its 2026 EPS due to the likely weaker-than-expected YTD revenue outlook. We suggest investors to revisit after better earnings visibility. Its dividend yield of 5.96.9% over 2026-28E, on Daiwa forecasts, should support its share price.
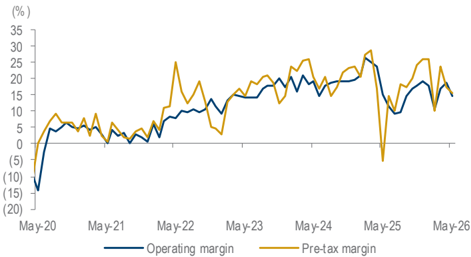
What's the impact: QTD unaudited operating profit below our and market estimates. Tong Yang posted operating profit of TWD273m (27.0% MoM; -0.5% YoY) for May 2026, with its QTD operating profit accounting for 64.1% and 60.8% of our previous and consensus 2Q26 operating profit forecasts, respectively. Its operating margin was 14.8% in May, down from 18.6% in April and 15.2% in May 2025. Its pre-tax profit was TWD289m (-18.2% MoM) in May, with QTD pre-tax profit accounting for 56.4% and 56.1% of our and consensus 2Q26 forecasts, respectively, with an FX loss of TWD27m. For 5M26, its aftermarket (AM) revenue was down 17.8% YoY and OEM revenue was down 14.2% YoY.
Rising AM penetration expected to continue in the long term despite a lack of share price catalysts and pressure on 2026E earnings in the near term. The US tariff has been lowered to 15% (from 27.5%) since 1 May 2026 (see news ), which we believe should be positive for its fundamentals. However, due to the off-season effect, we expect its revenue momentum to be subdued in the near term. We cut our 2026-27E EPS by 10-13%, mainly on our more conservative AM revenue and gross margin assumptions. We also introduce our 2028 forecasts.
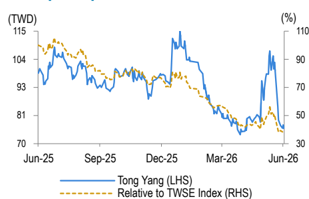
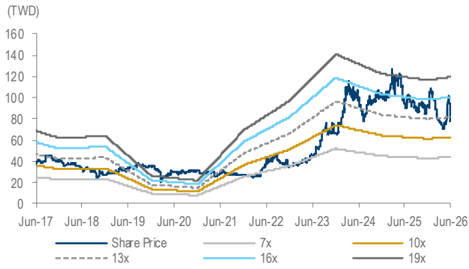
What we recommend: We downgrade Tong Yang to Hold (3) from Outperform (2), due to the lack of near-term catalysts and the likely downward revisions to earnings. Our new 12-month TP of TWD81 (from TWD102), is based on a PER of 14x (from 15x) and applied to our 1-yearforward EPS. Its share price has corrected by 21.0% since February 2026, mainly due to ETF sell-offs, and we believe this also reflects the lacklustre near-term outlook. We suggest investors to revisit later once order visibility improves. Key upside/downside risks: stronger-/weaker-than-expected gross margin expansion and AM revenue.
How we differ: Our 2026-27E EPS are 10-15% below Bloomberg consensus, likely on our more conservative revenue estimates and lower operating leverage assumptions.
1 July 2026
Daiwa
5
3
Hold
Helen Chien
Helen Chien
(886) 2 8758 6254
helen.chien@daiwacm-cathay.com.tw
Neil Teng (886) 2 8758 6256 neil.teng@daiwacm-cathay.com.tw
Forecast revisions (%)
| Year to 31 Dec | 26E | 27E | 28E |
|---|---|---|---|
| Revenue change | (7.5) | (7.5) | n.a. |
| Net profit change | (9.8) | (13.3) | n.a. |
| Core EPS (FD) change | (9.8) | (13.3) | n.a. |
Source: Daiwa forecasts
Share price performance
| 12-month range | 73.60-115.00 |
|---|---|
| Market cap (USDbn) | 1.44 |
| 3m avg daily turnover (USDm) | 15.21 |
| Shares outstanding (m) | 591 |
| Major shareholder | Wu family (50.0%) |
Financial summary (TWD)
| Year to 31 Dec | 26E | 27E | 28E |
|---|---|---|---|
| Revenue (m) | 23,236 | 24,323 | 25,476 |
| Operating profit (m) | 3,905 | 4,351 | 4,806 |
| Net profit (m) | 3,618 | 3,808 | 4,195 |
| Core EPS (fully-diluted) | 6.116 | 6.438 | 7.092 |
| EPS change (%) | (4.9) | 5.3 | 10.2 |
| Daiwa vs Cons. EPS (%) | (10.1) | (14.7) | n.a. |
| PER (x) | 12.7 | 12.0 | 10.9 |
| Dividend yield (%) | 5.9 | 6.2 | 6.9 |
| DPS | 4.6 | 4.8 | 5.3 |
| PBR (x) | 1.6 | 1.5 | 1.5 |
| EV/EBITDA (x) | 6.3 | 6.2 | 5.0 |
| ROE (%) | 12.7 | 12.9 | 13.7 |
Source: FactSet, Daiwa forecasts
Tong Yang: Daiwa revenue and earnings forecast revisions
| (TWDm) | 2026E | 2026E | 2026E | 2027E | 2027E | 2027E | 2028E | 2028E | 2028E |
|---|---|---|---|---|---|---|---|---|---|
| New | Previous | Change | New | Previous | Change | New | Previous | Change | |
| Sales | 23,236 | 25,111 | -7.5% | 24,323 | 26,286 | -7.5% | 25,476 | n.a. | n.a. |
| Gross profit | 7,669 | 8,447 | -9.2% | 8,194 | 9,018 | -9.1% | 8,754 | n.a. | n.a. |
| Gross profit margin | 33.0% | 33.6% | -0.6pp | 33.7% | 34.3% | -0.6pp | 34.4% | n.a. | n.a. |
| Operating profit | 3,905 | 4,529 | -13.8% | 4,351 | 5,023 | -13.4% | 4,806 | n.a. | n.a. |
| Operating profit margin | 16.8% | 18.0% | -1.2pp | 17.9% | 19.1% | -1.2pp | 18.9% | n.a. | n.a. |
| Net profit | 3,618 | 4,009 | -9.8% | 3,808 | 4,391 | -13.3% | 4,195 | n.a. | n.a. |
| Net profit margin | 15.6% | 16.0% | -0.4pp | 15.7% | 16.7% | -1pp | 16.5% | n.a. | n.a. |
| Diluted EPS (TWD) | 6.12 | 6.78 | -9.8% | 6.44 | 7.42 | -13.3% | 7.09 | n.a. | n.a. |
Source: Daiwa forecasts
Tong Yang: quarterly P&L
| 2026E | 2026E | 2026E | 2026E | 2027E | 2026E | 2027E | 2028E | ||||
|---|---|---|---|---|---|---|---|---|---|---|---|
| (TWDm) | 1Q26 | 2Q26E | 3Q26E | 4Q26E | 1Q27E | 2Q27E | 3Q27E | 4Q27E | |||
| Revenue | 5,631 | 5,627 | 5,625 | 6,353 | 5,850 | 5,900 | 5,700 | 6,873 | 23,236 | 24,323 | 25,476 |
| Gross profit | 1,830 | 1,868 | 1,856 | 2,115 | 1,931 | 1,947 | 1,853 | 2,464 | 7,669 | 8,194 | 8,754 |
| Operating profit | 887 | 968 | 936 | 1,113 | 951 | 1,007 | 923 | 1,471 | 3,905 | 4,351 | 4,806 |
| Pre-tax profit | 1,188 | 1,053 | 1,021 | 1,199 | 1,044 | 1,100 | 1,016 | 1,564 | 4,461 | 4,725 | 5,199 |
| Net profit | 956 | 825 | 828 | 1,010 | 840 | 886 | 817 | 1,264 | 3,618 | 3,808 | 4,195 |
| Basic EPS (TWD) | 1.62 | 1.39 | 1.40 | 1.71 | 1.42 | 1.50 | 1.38 | 2.14 | 6.12 | 6.44 | 7.09 |
| Margin | |||||||||||
| Gross margin | 32.5% | 33.2% | 33.0% | 33.3% | 33.0% | 33.0% | 32.5% | 35.8% | 33.0% | 33.7% | 34.4% |
| Operating margin | 15.8% | 17.2% | 16.6% | 17.5% | 16.2% | 17.1% | 16.2% | 21.4% | 16.8% | 17.9% | 18.9% |
| Pre-tax margin | 21.1% | 18.7% | 18.2% | 18.9% | 17.8% | 18.7% | 17.8% | 22.8% | 19.2% | 19.4% | 20.4% |
| Net margin | 17.0% | 14.7% | 14.7% | 15.9% | 14.4% | 15.0% | 14.3% | 18.4% | 15.6% | 15.7% | 16.5% |
| YoY | |||||||||||
| Revenue | -22.8% | -4.5% | 4.1% | -2.4% | 3.9% | 4.9% | 1.3% | 8.2% | -7.4% | 4.7% | 4.7% |
| Gross profit | -34.1% | -4.0% | 22.7% | -3.5% | 5.5% | 4.2% | -0.2% | 16.5% | -9.0% | 6.8% | 6.8% |
| Operating profit | -50.0% | -6.4% | 51.4% | -5.3% | 7.1% | 4.0% | -1.5% | 32.1% | -15.1% | 11.4% | 10.4% |
| Pre-tax profit | -36.7% | 90.9% | 22.7% | -21.6% | -12.2% | 4.5% | -0.5% | 30.5% | -6.9% | 5.9% | 10.0% |
| Net profit | -34.8% | 80.6% | 25.9% | -17.5% | -12.1% | 7.5% | -1.2% | 25.2% | -4.9% | 5.3% | 10.2% |
| QoQ | |||||||||||
| Revenue | -13.5% | -0.1% | 0.0% | 12.9% | -7.9% | 0.9% | -3.4% | 20.6% | |||
| Gross profit | -16.5% | 2.1% | -0.6% | 13.9% | -8.7% | 0.9% | -4.9% | 33.0% | |||
| Operating profit | -24.5% | 9.1% | -3.3% | 18.9% | -14.6% | 5.9% | -8.4% | 59.5% | |||
| Pre-tax profit | -22.3% | -11.4% | -3.0% | 17.3% | -12.9% | 5.4% | -7.7% | 54.0% | |||
| Net profit | -21.9% | -13.7% | 0.3% | 22.0% | -16.8% | 5.5% | -7.8% | 54.6% |
Source: Company, Daiwa forecasts
Tong Yang: pre-tax margin and operating margin
Source: Company
Tong Yang Industry (1319 TT): 1 July 2026
Tong Yang: 1-year forward PER
Source: Company, Daiwa forecasts
Daiwa
Financial summary
Key assumptions
| Year to 31 Dec | 2021 | 2022 | 2023 | 2024 | 2025 | 2026E | 2027E | 2028E |
|---|---|---|---|---|---|---|---|---|
| Sales growth of OEM business (%) | 12 | 12.8 | 3.9 | 0.9 | (6.4) | (6.8) | 1.7 | 1.8 |
| Sales growth of AM business (%) | 3.7 | 17.1 | 15.6 | 9.8 | (0.4) | (7.6) | 5.7 | 5.7 |
| Consolidated gross margin (%) | 19 | 23.6 | 29.9 | 33.3 | 33.6 | 33.0 | 33.7 | 34.4 |
Profit and loss (TWDm)
| Year to 31 Dec | 2021 | 2022 | 2023 | 2024 | 2025 | 2026E | 2027E | 2028E |
|---|---|---|---|---|---|---|---|---|
| AM | 12,716 | 14,891 | 17,216 | 18,895 | 18,818 | 17,387 | 18,375 | 19,421 |
| OEM-China | 3,658 | 4,408 | 4,639 | 4,602 | 4,264 | 3,838 | 3,838 | 3,838 |
| Other Revenue | 2,007 | 1,983 | 2,004 | 2,099 | 2,012 | 2,011 | 2,111 | 2,217 |
| Total Revenue | 18,380 | 21,283 | 23,859 | 25,596 | 25,094 | 23,236 | 24,323 | 25,476 |
| Other income | 0 | 0 | 0 | 0 | 0 | 0 | 0 | 0 |
| COGS | (14,893) | (16,255) | (16,725) | (17,065) | (16,667) | (15,566) | (16,129) | (16,721) |
| SG&A | (2,434) | (2,591) | (2,823) | (3,025) | (2,950) | (2,951) | (3,016) | (3,083) |
| Other op.expenses | (510) | (503) | (567) | (692) | (875) | (813) | (827) | (866) |
| Operating profit | 543 | 1,935 | 3,744 | 4,813 | 4,602 | 3,905 | 4,351 | 4,806 |
| Net-interest inc./(exp.) | (110) | (72) | 29 | 97 | 78 | 42 | 49 | 49 |
| Assoc/forex/extraord./others | 334 | 738 | 39 | 619 | 111 | 514 | 324 | 344 |
| Pre-tax profit | 767 | 2,600 | 3,812 | 5,530 | 4,791 | 4,461 | 4,725 | 5,199 |
| Tax | (130) | (564) | (765) | (1,074) | (889) | (828) | (876) | (964) |
| Min. int./pref. div./others | 50 | 115 | (28) | (78) | (99) | (16) | (40) | (40) |
| Net profit (reported) | 688 | 2,151 | 3,019 | 4,377 | 3,804 | 3,618 | 3,808 | 4,195 |
| Net profit (adjusted) | 688 | 2,151 | 3,019 | 4,377 | 3,804 | 3,618 | 3,808 | 4,195 |
| EPS (reported)(TWD) | 1.162 | 3.637 | 5.105 | 7.400 | 6.431 | 6.117 | 6.439 | 7.092 |
| EPS (adjusted)(TWD) | 1.162 | 3.637 | 5.105 | 7.400 | 6.431 | 6.117 | 6.439 | 7.092 |
| EPS (adjusted fully-diluted)(TWD) | 1.160 | 3.636 | 5.104 | 7.399 | 6.430 | 6.116 | 6.438 | 7.092 |
| DPS (TWD) | 0.850 | 2.500 | 4.000 | 5.300 | 5.000 | 4.588 | 4.829 | 5.319 |
| EBIT | 543 | 1,935 | 3,744 | 4,813 | 4,602 | 3,905 | 4,351 | 4,806 |
| EBITDA | 3,511 | 4,794 | 6,507 | 7,436 | 7,186 | 6,547 | 7,235 | 7,921 |
Cash flow (TWDm)
| Year to 31 Dec | 2021 | 2022 | 2023 | 2024 | 2025 | 2026E | 2027E | 2028E |
|---|---|---|---|---|---|---|---|---|
| Profit before tax | 767 | 2,600 | 3,812 | 5,530 | 4,791 | 4,461 | 4,725 | 5,199 |
| Depreciation and amortisation | 2,967 | 2,859 | 2,762 | 2,623 | 2,583 | 2,642 | 2,884 | 3,115 |
| Tax paid | (130) | (564) | (765) | (1,074) | (889) | (828) | (876) | (964) |
| Change in working capital | (537) | (438) | 125 | (778) | (2,084) | 3,903 | (4,822) | 4,760 |
| Other operational CF items | 819 | 1,134 | 1,152 | 885 | 15 | 55 | 35 | 15 |
| Cash flow from operations | 3,886 | 5,592 | 7,087 | 7,186 | 4,417 | 10,234 | 1,946 | 12,125 |
| Capex | (2,373) | (2,216) | (2,824) | (3,479) | (2,949) | (3,300) | (3,000) | (3,000) |
| Net (acquisitions)/disposals | 451 | 1,522 | 187 | 70 | 114 | 0 | 0 | 0 |
| Other investing CF items | (349) | (100) | (337) | 37 | (329) | 0 | 0 | 0 |
| Cash flow from investing | (2,271) | (793) | (2,974) | (3,372) | (3,163) | (3,300) | (3,000) | (3,000) |
| Change in debt | 0 | 0 | 0 | 0 | 0 | 0 | 0 | 0 |
| Net share issues/(repurchases) | 0 | 0 | 0 | 0 | 0 | 0 | 0 | 0 |
| Dividends paid | (473) | (503) | (1,479) | (2,366) | (3,135) | (2,713) | (2,856) | (3,146) |
| Other financing CF items | (1,209) | (3,449) | (1,177) | (578) | (207) | 0 | 0 | 0 |
| Cash flow from financing | (1,682) | (3,952) | (2,655) | (2,943) | (3,342) | (2,713) | (2,856) | (3,146) |
| Forex effect/others | 0 | 0 | 0 | 0 | 0 | 0 | 0 | 0 |
| Change in cash | (67) | 847 | 1,458 | 870 | (2,088) | 4,220 | (3,911) | 5,979 |
| Free cash flow | 1,513 | 3,376 | 4,263 | 3,706 | 1,468 | 6,934 | (1,054) | 9,125 |
Source: FactSet, Daiwa forecasts
Tong Yang Industry (1319 TT): 1 July 2026
Daiwa
Financial summary continued …
Balance sheet (TWDm)
| Year to 31 Dec | 2021 | 2022 | 2023 | 2024 | 2025 | 2026E | 2027E | 2028E |
|---|---|---|---|---|---|---|---|---|
| Cash & short-term investment | 1,454 | 2,344 | 3,817 | 4,737 | 2,662 | 6,886 | 2,989 | 8,982 |
| Inventory | 3,047 | 3,057 | 2,687 | 3,089 | 3,179 | 2,382 | 3,532 | 2,521 |
| Accounts receivable | 3,769 | 4,159 | 5,030 | 5,099 | 7,060 | 3,167 | 8,078 | 3,417 |
| Other current assets | 374 | 426 | 572 | 332 | 292 | 292 | 292 | 292 |
| Total current assets | 8,643 | 9,987 | 12,106 | 13,257 | 13,192 | 12,727 | 14,891 | 15,211 |
| Fixed assets | 18,884 | 18,192 | 17,605 | 17,346 | 18,228 | 18,887 | 19,003 | 18,887 |
| Goodwill & intangibles | 1,261 | 874 | 590 | 424 | 598 | 598 | 598 | 598 |
| Other non-current assets | 5,666 | 4,487 | 4,745 | 7,264 | 6,574 | 6,574 | 6,574 | 6,574 |
| Total assets | 34,453 | 33,540 | 35,046 | 38,292 | 38,592 | 38,786 | 41,066 | 41,271 |
| Short-term debt | 2,202 | 1,620 | 916 | 736 | 939 | 939 | 939 | 939 |
| Accounts payable | 4,411 | 4,269 | 5,152 | 5,417 | 5,307 | 4,521 | 5,760 | 4,848 |
| Other current liabilities | 295 | 1,000 | 984 | 883 | 711 | 711 | 711 | 711 |
| Total current liabilities | 6,908 | 6,890 | 7,052 | 7,036 | 6,958 | 6,171 | 7,410 | 6,498 |
| Long-term debt | 4,568 | 1,839 | 1,452 | 1,143 | 801 | 801 | 801 | 801 |
| Other non-current liabilities | 710 | 545 | 630 | 1,957 | 2,149 | 2,149 | 2,149 | 2,149 |
| Total liabilities | 12,186 | 9,275 | 9,134 | 10,136 | 9,907 | 9,121 | 10,360 | 9,448 |
| Share capital | 5,915 | 5,915 | 5,915 | 5,915 | 5,915 | 5,915 | 5,915 | 5,915 |
| Reserves/R.E./others | 15,723 | 17,834 | 19,537 | 21,696 | 22,151 | 23,115 | 24,116 | 25,193 |
| Shareholders' equity | 21,637 | 23,749 | 25,451 | 27,610 | 28,066 | 29,030 | 30,030 | 31,108 |
| Minority interests | 630 | 517 | 461 | 546 | 619 | 635 | 675 | 715 |
| Total equity & liabilities | 34,453 | 33,540 | 35,046 | 38,292 | 38,592 | 38,786 | 41,066 | 41,271 |
| EV | 51,727 | 47,413 | 44,792 | 43,468 | 45,478 | 41,270 | 45,207 | 39,254 |
| Net debt/(cash) | 5,316 | 1,115 | (1,449) | (2,858) | (921) | (5,146) | (1,249) | (7,242) |
| BVPS (TWD) | 36.582 | 40.151 | 43.030 | 46.681 | 47.450 | 49.080 | 50.772 | 52.593 |
Key ratios (%)
| Year to 31 Dec | 2021 | 2022 | 2023 | 2024 | 2025 | 2026E | 2027E | 2028E |
|---|---|---|---|---|---|---|---|---|
| Sales (YoY) | 6.1 | 15.8 | 12.1 | 7.3 | (2.0) | (7.4) | 4.7 | 4.7 |
| EBITDA (YoY) | (8.4) | 36.6 | 35.7 | 14.3 | (3.4) | (8.9) | 10.5 | 9.5 |
| Operating profit (YoY) | 0.6 | 256.2 | 93.6 | 28.6 | (4.4) | (15.1) | 11.4 | 10.4 |
| Net profit (YoY) | (16.1) | 212.9 | 40.4 | 45.0 | (13.1) | (4.9) | 5.3 | 10.2 |
| Core EPS (fully-diluted) (YoY) | (16.3) | 213.4 | 40.4 | 45.0 | (13.1) | (4.9) | 5.3 | 10.2 |
| Gross-profit margin | 19.0 | 23.6 | 29.9 | 33.3 | 33.6 | 33.0 | 33.7 | 34.4 |
| EBITDA margin | 19.1 | 22.5 | 27.3 | 29.1 | 28.6 | 28.2 | 29.7 | 31.1 |
| Operating-profit margin | 3.0 | 9.1 | 15.7 | 18.8 | 18.3 | 16.8 | 17.9 | 18.9 |
| Net profit margin | 3.7 | 10.1 | 12.7 | 17.1 | 15.2 | 15.6 | 15.7 | 16.5 |
| ROAE | 3.2 | 9.5 | 12.3 | 16.5 | 13.7 | 12.7 | 12.9 | 13.7 |
| ROAA | 2.0 | 6.3 | 8.8 | 11.9 | 9.9 | 9.4 | 9.5 | 10.2 |
| ROCE | 1.8 | 6.8 | 13.4 | 16.5 | 15.2 | 12.6 | 13.6 | 14.6 |
| ROIC | 1.6 | 5.7 | 12.0 | 15.6 | 14.1 | 12.2 | 13.1 | 14.5 |
| Net debt to equity | 24.6 | 4.7 | n.a. | n.a. | n.a. | n.a. | n.a. | n.a. |
| Effective tax rate | 16.9 | 21.7 | 20.1 | 19.4 | 18.5 | 18.5 | 18.5 | 18.5 |
| Accounts receivable (days) | 72.9 | 68 | 70.3 | 72.2 | 88.4 | 80.3 | 84.4 | 82.3 |
| Current ratio (x) | 1.3 | 1.4 | 1.7 | 1.9 | 1.9 | 2.1 | 2.0 | 2.3 |
| Net interest cover (x) | 5.0 | 26.7 | n.a. | n.a. | n.a. | n.a. | n.a. | n.a. |
| Net dividend payout | 73.1 | 68.7 | 78.4 | 71.6 | 77.7 | 75.0 | 75.0 | 75.0 |
| Free cash flow yield | 3.3 | 7.4 | 9.3 | 8.1 | 3.2 | 15.1 | n.a. | 19.9 |
Source: FactSet, Daiwa forecasts
Company profile
Founded in 1967, Tong Yang Industry is the world's leading after-market (AM) collision-parts manufacturer, with 2025 global revenue market shares of 70% for plastic parts and 38% for sheet-metal parts. The company is also a major OEM auto parts supplier to China and international automakers.
Tong Yang Industry (1319 TT): 1 July 2026
Daiwa
ESG analysis
ESG risks
| Risks | Risks | Management | Analyst comments |
|---|---|---|---|
| G | Executive/board quality | 2 | The CEO and Chairperson of Tong Yang are not the same individual. Tong Yang's board has 7 directors, including 3 independent directors. The board is led by the Wu family (three brothers: Chairman, Vice Chairman, and CEO), which we view as a sign of a stable board as the directors have worked together since the company was established. |
| Capital management | 2 | Tong Yang maintained its dividend payout ratio between 58-78% between 2020-25, which is relatively lower than that of its peers; the company is considered to be a mature player with a limited capacity expansion plan. | |
| Related party & transaction | 2 | Revenue generated from related-party transactions is currently between 1-2%, and the transaction conditions are no different than those of normal transactions. Thus, we see limited risk. | |
| S | Product quality & safety | 1 | Through advanced product and quality planning (APQP), Tong Yang can better manage the product development process, which allows it to fulfil clients' needs in a timely manner. Tong Yang is focused on developing high-quality, eco-friendly, lightweight, and automated products. This is reflected in its 2022 CSR report and we believe that Tong Yang is putting in considerable effort into this area. |
| S | Materials sourcing & efficiency | 2 | Tong Yang has set up an online supply chain management (SCM) platform to communicate effectively with its suppliers. This allows it to conduct evaluations and provide feedback to its suppliers to improve efficiency. Moreover, we see an increasing usage of renewable materials in its Aftermarket division, indicating its continuous efforts in boosting efficiency along its production line. |
| E | Product design & lifecycle management | 2 | We note Tong Yang's product design and lifecycle management follows four focal points: high- quality, eco-friendly, lightweight, and automated products. This allows the company to effectively engage in the ESG trend, in our view. As shown in its 2022 CSR report, it also focuses on waste reduction and water management in order to create a more eco-friendly production lifecycle. |
Note: Management score represents a company's ability to manage/benefit from certain ESG topics. The scores range from 1 to 3, with 1 being the strongest.
Update Date: 1 Jul 2026
Source: Daiwa, Company
Tong Yang Industry (1319 TT): 1 July 2026
Daiwa