PDF 原檔:260624_2303_ubs_umc_original.pdf
原始內容
UMC
Time to shine with structural shift in supply
Mature foundry and UMC fundamentals turning around fast
YTD we have maintained an anti-consensus Buy on UMC, as we are constructive on mature foundry fundamentals improving in coming years. Industry dynamics are now strengthening much faster than our expectation. 1) On the supply side, large foundry makers continue to streamline resources on mature nodes. Our industry studies suggest UMC is seeing an increasing number of new product opportunities as clients diversify. 2) As for China, our view is the expansion for mature nodes should slow down from here as large players re-focus on leading edge. 3) Mature foundry pricing has inflected upward YTD. We believe UMC could raise prices by 5-10% for selected products in H226, followed by a 10% increase for its broader product range in early 2027. An improving product mix should also lift blended ASP . We forecast UMC's blended wafer price to steadily increase by 10-11% CAGR in 2026-30E.
Potential new opportunity if TSMC were to reallocate 28nm capacity in Taiwan
On industry supply, based on our industry surveys, we believe it is possible that TSMC might re-pivot parts of its Fab 15 for leading edge nodes such as N3. TSMC may reallocate the N28 capacity at Fab 15 P1 (50kwpm) in 2027 for its Germany expansion of N28/12. If this were to happen, we would see it as positive for UMC, as it could drive: 1) tighter supply-demand in 28/40nm; and 2) overflow opportunities as TSMC reduces supply in Taiwan. We expect UMC's 28nm utilisation to exceed 90% in 2027E, especially with several new wins, including Sony's ISP and Omnivision's auto CIS.
Intel collaboration and silicon photonics likely to contribute to 2028 earnings
UMC's 12nm collaboration with Intel has attracted steady client interest. We expect the business to be margin-accretive, contributing 6% of operating profit by 2028E. Firstwave products for mass production include TV controllers, connectivity and high-speed I/O, likely followed by OLED drivers in the second wave. The collaboration should focus on 12nm mass production for now (see Figure 1 u O r I n t e l p a s h i c o y for more analysis). On silicon photonics, although UMC is a latecomer, it should benefit from tight industry supply. We anticipate pluggables to contribute more meaningfully by 2028E, with a potential sales opportunity of US$0.2-0.3bn (2% of 2028E sales), assuming a 10% share of the US$23bn TAM. See Figure 2 i S l c o n p t h f u r d y T A M a e v b s g w m F G - Figure 4 T o w r e S m i c n d t u ' s b l h v p a k for industry commentary on silicon photonics.
Valuation: reiterate Buy, raising price target from NT$108 to NT$230
We raise 2027/28E EPS by 18%/55% on more favourable supply-demand, price hikes, a better product mix, and more robust margin expansion. With earnings growth reaccelerating, we shift our valuation from a 3x PB to a 25x 2027-28E PE, raising our price target from NT$108 to NT$230. We think a multiple at the high end of its 7-28x historical PE range is justified, given 1) the industry is undergoing a structural, not cyclical, shift in fundamentals; and 2) we forecast a 32% earnings CAGR in 2027-30E.
| Highlights (NT$m) | 12/23 | 12/24 | 12/25 | 12/26E | 12/27E | 12/28E | 12/29E | 12/30E |
|---|---|---|---|---|---|---|---|---|
| Revenues | 222,533 | 232,303 | 237,553 | 273,854 | 346,239 | 447,135 | 510,723 | 564,912 |
| EBIT (UBS) | 57,891 | 51,613 | 43,949 | 56,547 | 94,417 | 162,248 | 191,828 | 213,492 |
| Net earnings (UBS) | 60,990 | 47,211 | 41,716 | 58,213 | 84,034 | 143,922 | 172,176 | 193,168 |
| EPS (UBS, diluted) (NT$) | 4.93 | 3.80 | 3.34 | 4.66 | 6.73 | 11.52 | 13.78 | 15.46 |
| DPS (net) (NT$) | 3.02 | 2.87 | 2.34 | 3.26 | 4.71 | 8.07 | 9.65 | 10.83 |
| Net (debt) / cash | 57,781 | 29,957 | 37,691 | 70,342 | 125,463 | 214,852 | 289,517 | 360,102 |
| Profitability/valuation | 12/23 | 12/24 | 12/25 | 12/26E | 12/27E | 12/28E | 12/29E | 12/30E |
| EBIT (UBS) margin% | 26.0 | 22.2 | 18.5 | 20.6 | 27.3 | 36.3 | 37.6 | 37.8 |
| ROIC (EBIT)% | 31.1 | 20.5 | 16.2 | 21.4 | 36.8 | 65.3 | 78.4 | 87.4 |
| EV/EBITDA (UBS core) x | 4.4 | 5.2 | 4.3 | 16.4 | 12.0 | 8.3 | 7.2 | 6.5 |
| P/E (UBS, diluted) x | 9.9 | 13.4 | 13.3 | 36.5 | 25.3 | 14.8 | 12.3 | 11.0 |
| Equity FCF (UBS) yield% | 0.2 | 1.0 | 9.1 | 2.6 | 3.4 | 5.7 | 7.6 | 8.2 |
| Dividend yield (net)% | 6.2 | 5.6 | 5.3 | 1.9 | 2.8 | 4.7 | 5.7 | 6.4 |
| Equities | Equities | Equities | Equities |
|---|---|---|---|
| Taiwan Semiconductors | Taiwan Semiconductors | Taiwan Semiconductors | Taiwan Semiconductors |
| 12-month rating | 12-month rating | 12-month rating | Buy |
| 12m price target | 12m price target | 12m price target | NT$230.00 Prior : NT$108.00 |
| Price (23 Jun 2026) | Price (23 Jun 2026) | Price (23 Jun 2026) | NT$171.50 |
| RIC: 2303.TW BBG: 2303 TT | RIC: 2303.TW BBG: 2303 TT | RIC: 2303.TW BBG: 2303 TT | RIC: 2303.TW BBG: 2303 TT |
| Trading data and key metrics | Trading data and key metrics | Trading data and key metrics | Trading data and key metrics |
| 52-wk range | 52-wk range | 52-wk range | NT$171.50-40.40 |
| Market cap. Shares o/s | Market cap. Shares o/s | Market cap. Shares o/s | NT$2,159b/US$68.3b 12,588m (ORD) |
| Free float | Free float | Free float | 89% |
| Avg. daily volume ('000) | Avg. daily volume ('000) | Avg. daily volume ('000) | 241,464 |
| Avg. daily value (m) | Avg. daily value (m) | Avg. daily value (m) | NT$26,080.8 |
| Common s/h equity (12/26E) | Common s/h equity (12/26E) | Common s/h equity (12/26E) | NT$420b |
| P/BV | (12/26E) | 5.1x | |
| Net debt to EBITDA (12/26E) | Net debt to EBITDA (12/26E) | Net debt to EBITDA (12/26E) | NM |
| EPS (UBS, diluted) (NT$) | EPS (UBS, diluted) (NT$) | EPS (UBS, diluted) (NT$) | |
| From | To | %ch Cons. | |
| 12/26E | 4.56 | 4.66 | 2 4.47 |
| 12/27E | 5.72 | 6.73 | 18 5.42 |
| 12/28E | 7.43 | 11.52 | 55 6.53 |
| Sunny Lin Analyst sunny.lin@ubs.com 7346 | |||
| +886-2-8722 Ryan Sun Associate | |||
| Analyst ryan-za.sun@ubs.com +886-2-8722 7267 | |||
| Christine Chen Associate Analyst christine.chen@ubs.com +886-2-8722 7352 |
Thesis Map UBS Research THESIS MAP a guide to our thinking and what´s where in this report
Pivotal Questions
UBS VIEW
EVIDENCE
WHAT´S PRICED IN?
Upside/Downside Spectrum
Company Description
Q: Can UMC's blended ASP rebound in 2026 after a two-year downtrend?
Yes. We think UMC's blended ASP can improve in 2026 and beyond, due to: 1) mature foundry supply-demand improving; 2) more rational pricing competition among Chinese foundries; and 3) a stronger restocking cycle, given very clean inventory downstream. Rising memory costs remain an overhang and may continue to impact consumer demand and restocking in H226. However, with a stable ASP , improving product mix, and utilisation upside, we forecast UMC's sales to grow 15% in 2026E and 26% in 2027E, after the muted 2% growth in 2025.
Q: Will Chinese competition undermine UMC's stabilising capacity utilisation?
No. We believe industry competition will be manageable, at least in 2026-27. UMC's 28nm utilisation has remained resilient with held above 80% through the industry downturn in 2023-25. UMC's differentiated 22nm can also support its market share, with greater power efficiency than the competition. Meanwhile, UMC's key customers are likely to maintain balanced procurement across regions to diversify geopolitical risk, supporting continued demand. Over the longer term, collaboration with Intel on 12nm FinFET should differentiate UMC from Chinese peers.
UMC is our top pick in the mature foundry space, considering: 1) its technological position, with differentiated 22nm offering greater power efficiency, the need for its customers to maintain balanced procurement across regions amid geopolitical risks, and its partnership with Intel over the longer term; and 2) improving earnings momentum in 2026, with rising utilisation, stabilising pricing dynamics and slower depreciation growth.
Among mature foundries, most (UMC, GlobalFoundries, Vanguard, SMIC and Hua Hong) have guided for relatively stable like-for-like pricing from Q225. Most non-Chinese foundries have also guided for more stable sales growth in coming quarters, suggesting some demand upside from broad-based restocking. TSMC's comments on mature foundry business reallocation also read positively for the mature foundry industry. If TSMC drives meaningful optimisation of mature capacity for advanced packaging, we would view UMC as a key beneficiary of order outflow in upcoming years.
We think UMC's YTD re-rating may reflect increasing optimism about TSMC's capacity reallocation benefits, Intel's partnership opportunities, along with a healthier supply-demand outlook and UMC's GM recovery in 2026E and beyond. At 15x 2028E PE, UMC's valuation is at a discount to the upper end of its 14-22x NTM PE range in the previous upcycle (2021-early 2022). The premium over its 14x PE historical mean likely bakes in the improvement we expect in UMC's earnings momentum from 2026E.
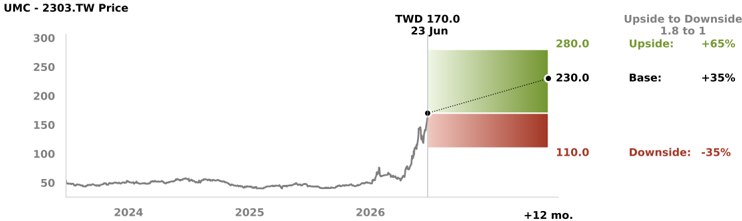
| Value drivers (2027/28E) | Utilisation rate | Wafer ASP growth throughout the year | Gross margin |
|---|---|---|---|
| NT$280.00 upside | 94.1%/98.2% | 15%/19% | 38.2%/46.9% |
| NT$230.00 base | 91.8%/97.0% | 11%/15% | 37.3%/45.4% |
| NT$110.00 downside | 88.2%/91.9% | 5%/6% | 35.1%/42.3% |
Source: UBS estimates
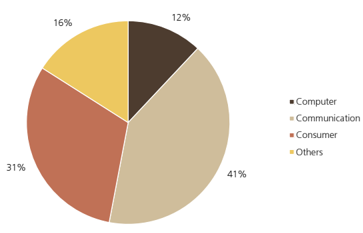
Founded in 1980, UMC is a leading dedicated foundry service provider, with annual capacity of around 11.6m 8-inch equivalent wafers as of 2025. In 2025, communications applications accounted for 41% of its total revenue, consumer electronics 31%, computer applications 12% and other 16%.
Figure 1: Our Intel partnership scenario analysis
| Scenario analysis | 2028E |
|---|---|
| Wafer volume (kwpm) | 25.0 |
| N12 wafer ASP (US$) | 5,500 |
| Total wafer revenue (US$mn) | 1,650 |
| %recognition by UMC | 50% |
| Sales to UMC (US$mn) | 825 |
| %of UMC sales | 5.8% |
| Gross profit (US$mn) | 371 |
| Assumed GM | 45% |
| %of UMC gross profit | 5.8% |
| OPEX | 58 |
| as %of sales | 7% |
| Operating income | 314 |
| OPM | 38.0% |
| Operating profit to UMC (US$mn) | 314 |
| Operating profit to UMC (NT$mn) | 9,916 |
| %to UMC's operating profit | 6.1% |
Source: Company data, UBS estimates
Figure 2: Silicon photonic foundry TAM and revenue by leaders including Tower Semiconductor and GlobalFoundries
| US$ | 2024 | 2025 | 2026F | 2027F | 2028F | 2029F | 2030F | 2031F | 2032F | Implied CAGR |
|---|---|---|---|---|---|---|---|---|---|---|
| Silicon Photonics Wafer SAM | ~$700m | ~$6.5bn | ~45% CAGR FY26-32F | |||||||
| US$ Silicon Photonics Revenue | 2024 | 2025 | 2026F | 2027F | 2028F | 2029F | 2030F | 2031F | 2032F | Implied CAGR |
| Tower Semiconductor | $106m | $228m | Q1 grew 3x yoy | $1.3Bn | ||||||
| GlobalFoundries | ~$100m | ~$200m | $400m target | >$1Bn exit run rate | ~$2Bn | ~50% CAGR FY26-30F |
Source: Company data and company targets, UBS. Note: SiPh wafer SAM source from Nov 2025 GFS presentation .
Figure 3: GlobalFoundries' bullish view on the silicon photonic market
| May 2026 | "We've accelerated our targets [for silicon photonics]: US$1bn run rate by the exit of 2028. We're targeting US$2bn of revenue in 2030 as we target share gains in pluggables and the ramp in near and co-packaged optics. The demand for power is insatiable across all of the markets we serve." - Sam Franklin, CFO of GFS |
|---|---|
| Feb 2026 | "We believe we are on a path to reach a US$1bn run rate revenue level for silicon photonics by the end of 2028, a substantial acceleration from our prior objective " - Tim Breen, CEO of GFS |
| Nov 2025 | GFS announced acquisition (closed in February 2026) of AMF, a pureplay SiPh foundry based in Singapore. This acquisition will expand GF's silicon photonics technology portfolio, production capacity and research and development in Singapore, complementing its existing technology capabilities in the US and unlocking new market opportunities with a broader set of datacenter and communication technologies - GFS Nov 25 press release |
| Nov 2025 | " We see this [silicon photonics] as a tremendous opportunity over time for GlobalFoundries, and speaks to both our history in silicon photonics, as well as our analog mixed signal differentiation. Again, back to that point. So [we are] very, very bullish about this opportunity over time." - Tim Breen, CEO of GFS |
| Sep 2025 | ' Silicon photonics technology is essential for AI infrastructure. As data moves faster and workloads grow more complex, the ability to move information with greater speed, precision and power efficiency is now fundamental to AI datacenters and advanced telecom networks,' - Tim Breen, CEO of GFS |
Source: Company data, UBS
Figure 4: Tower Semiconductor's bullish view on the silicon photonic market
| May 2026 | "So if you just look again, the growth of SiPho ports is 4.5x from 2025 to 2028, and that entire amount of port growth is added from 2028 to 2030. So a lot of room for a tremendous amount of SiPho growth ." - Russell C. Ellwanger, CEO of TSEM |
|---|---|
| May 2026 | "Our expansion remains on track to grow SiPho capacity 5 times from the base of our Q4 2025 wafer revenue shipments by the end of this year, 2026." - Russell C. Ellwanger, CEO of TSEM |
| Feb 2026 | "In our recent announcement with NVIDIA, the insatiable demand for compute bandwidth in both scale-up and scale-out architectures and Towers' exceptional ability to scale the capacity flawlessly in partnership with our customer has made 1.6 terabyte per second, the fastest- growing silicon photonics node in the industry to-date, with Tower being by far the majority supplier of 1.6T silicon PICs. The partnership announced with NVIDIA, as with all our direct module customers, underscores our commitment to deliver best-in-class technology and the manufacturing agility required to meet such an exceptional demand trajectory ." - Russell C. Ellwanger, CEO of TSEM |
| Feb 2026 | We also see co-package optics as a substantially incremental opportunity for us in the coming years, as optics gets adopted and scale up interconnects, as well as XPU to high bandwidth memory interconnects that are today largely copper. - Russell C. Ellwanger, CEO of TSEM |
| Feb 2026 | We continue to work with several customers on dense wavelength division multiplexing laser sources, which are a critical component of many CPO implementations and can significantly expand our served optical market by now including the laser source. - Russell C. Ellwanger, CEO of TSEM |
Source: Company data, UBS
Figure 5: Industry P/BV vs. ROE
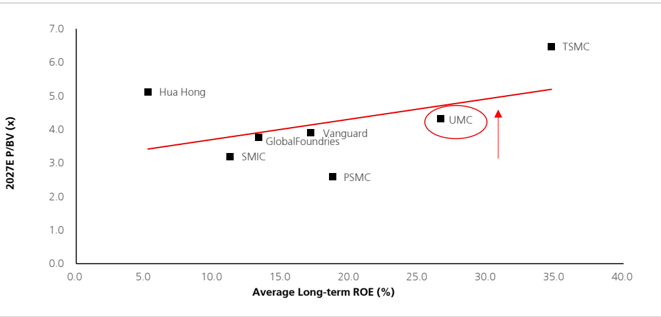
Source: Company data, UBS estimates
Figure 6: UMC's operating metrics
| Q126 | Q226E | Q326E | Q426E | Q127E | Q227E | Q327E | Q427E | 2022 | 2023 | 2024 | 2025 | 2026E | 2027E | 2028E | |
|---|---|---|---|---|---|---|---|---|---|---|---|---|---|---|---|
| Capacity (8" eq.) Sequential Change Shipment (8" eq.) | 2,886 2,297 | 2,936 2% | 2,949 0% | 2,983 1% | 3,017 1% | 3,051 1% | 3,118 2% | 3,152 1% | 10,031 6% | 10,519 5% | 11,305 7% | 11,617 3% | 11,754 1% | 12,337 5% | 13,113 6% |
| (%) | -2% | 2,466 | 2,566 | 2,625 | 2,655 | 2,745 3% | 2,931 | 2,994 | 9,945 | 7,189 | 7,754 | 8,710 | 9,954 | 11,325 | 12,721 |
| Sequential Change (%) | 3% | 7% | 4% | 2% | 1% | 7% | 2% | 1% | -28% | 8% | 12% | 14% | 14% | 12% | |
| Utilization rate (%) | 80% | 84% | 87% | 88% | 88% | 90% | 94% | 95% | 99% | 68% | 69% | 75% | 85% | 92% | 97% |
| ASP (US$) Sequential Change (%) | 840 -5% | 861 2% | 878 2% | 896 2% | 923 3% | 950 3% | 979 3% | 1,008 3% | 928 20% | 994 7% | 928 -7% | 869 -6% | 870 0% | 967 11% 10,947 | 1,111 15% |
| Wafer Revenue (US$mn) Total Revenue (NT$mn) | 1,930 | 2,123 | 2,253 | 2,352 | 2,449 | 2,609 | 2,869 | 3,019 | 9,231 | 7,147 | 7,196 | 7,567 | 8,658 | 14,136 | |
| Revenue %at 28nm | 61,038 | 67,160 | 71,276 | 74,379 | 77,477 | 82,528 | 90,747 | 95,486 | 278,705 | 222,533 | 232,303 | 237,553 | 273,854 | 346,239 | 447,135 |
| Capex (US$mn) | 396 | 300 | 300 | 504 | 300 | 300 | 300 | 600 | 24% 2,632 | 31% 2,928 | 2,739 | 1,517 | 1,500 | 1,500 | 1,500 |
| Capex/Revenue (%) | 21% | 14% 67,160 | 13% 71,276 | 21% 74,379 | 12% | 11% | 10% | 20% | 29% 278,705 | 41% | 38% 232,303 | 20% 237,553 | 17% 273,854 | 14% 346,239 | 11% |
| Revenue (NT$mn) Sequential Change EPS (NT$) | 61,038 -1.2% | 6.1% | 4.4% | 77,477 4.2% | 82,528 6.5% | 90,747 10.0% | 95,486 5.2% | 222,533 -20.2% | 4.4% | 26.4% | 447,135 29.1% | ||||
| 10.0% 1.01 | 1.21 | 2.02 | 30.8% 7.09 | 2.3% | 15.3% 4.66 | 6.73 | |||||||||
| 1.29 | 1.15 | 1.25 | 1.58 | 1.88 | 4.93 | 3.80 | 3.34 | 37.3% | 11.52 | ||||||
| Gross margin (%) | 29.2% | 31.0% | 31.8% | 32.3% | 38.7% | 39.5% | 45.1% | 31.2% | 45.4% | ||||||
| Operating margin (%) | 18.5% | 20.3% | 21.4% | 22.1% | 33.2% 22.7% | 37.1% 26.8% | 28.8% | 29.9% | 37.4% | 34.9% 26.0% | 32.6% 22.2% | 29.0% 18.5% | 20.6% | 27.3% | 36.3% |
Source: Company data, UBS estimates
."
Figure 7: Revisions to UBS earnings estimates
| New | New | New | Old | Old | Old | Change | Change | Change | |
|---|---|---|---|---|---|---|---|---|---|
| (NT$m) | 2026E | 2027E | 2028E | 2026E | 2027E | 2028E | 2026E | 2027E | 2028E |
| Revenue | 273,854 | 346,239 | 447,135 | 272,190 | 315,403 | 358,179 | 1% | 10% | 25% |
| - YoY chg (%) | 15% | 26% | 29% | 15% | 16% | 14% | |||
| Revenue (US$m) | 8,658 | 10,947 | 14,136 | 8,605 | 9,972 | 11,324 | 1% | 10% | 25% |
| - YoY chg (%) | 14% | 26% | 29% | 14% | 16% | 14% | |||
| Gross profit | 85,315 | 129,103 | 202,824 | 84,457 | 114,327 | 140,897 | 1% | 13% | 44% |
| - Gross margin | 31.2% | 37.3% | 45.4% | 31.0% | 36.2% | 39.3% | |||
| Operating profit | 56,547 | 94,417 | 162,248 | 55,756 | 81,000 | 104,237 | 1% | 17% | 56% |
| - Operating margin | 20.6% | 27.3% | 36.3% | 20.5% | 25.7% | 29.1% | |||
| Net profit | 58,213 | 84,034 | 143,922 | 56,949 | 71,423 | 92,820 | 2% | 18% | 55% |
| - Net margin | 21.3% | 24.3% | 32.2% | 20.9% | 22.6% | 25.9% | |||
| UBS EPS (NT$) | 4.66 | 6.73 | 11.52 | 4.56 | 5.72 | 7.43 | 2% | 18% | 55% |
| - YoY chg (%) | 39% | 44% | 71% | 36% | 25% | 30% |
Source: UBS estimates
Figure 8: UBS vs consensus earnings estimates
| UBSe | UBSe | UBSe | Consensus | Consensus | Consensus | Difference | Difference | Difference | |
|---|---|---|---|---|---|---|---|---|---|
| (NT$m) | 2026E | 2027E | 2028E | 2026F | 2027F | 2028F | 2026E | 2027E | 2028E |
| Revenue | 273,854 | 346,239 | 447,135 | 273,607 | 317,789 | 351,107 | 0% | 9% | 27% |
| - YoY chg | 15% | 26% | 29% | n.a. | 16% | 10% | |||
| Gross profit | 85,315 | 129,103 | 202,824 | 85,571 | 107,638 | 124,448 | 0% | 20% | 63% |
| - Gross margin | 31.2% | 37.3% | 45.4% | 31.3% | 33.9% | 35.4% | |||
| Operating profit | 56,547 | 94,417 | 162,248 | 58,205 | 77,565 | 92,079 | -3% | 22% | 76% |
| - Operating margin | 20.6% | 27.3% | 36.3% | 21.3% | 24.4% | 26.2% | |||
| Net profit | 58,213 | 84,034 | 143,922 | 58,628 | 69,840 | 82,584 | -1% | 20% | 74% |
| - Net margin | 21.3% | 24.3% | 32.2% | 21.4% | 22.0% | 23.5% | |||
| EPS (NT$) | 4.66 | 6.73 | 11.52 | 4.68 | 5.58 | 6.71 | -1% | 20% | 72% |
| - YoY chg | 39% | 44% | 71% | n.a. | 19% | 20% |
Source: Visible Alpha consensus estimates, UBS estimates
Figure 9: UBS earnings forecasts
| (NT$m) | 2025 | Q126 | Q226E | Q326E | Q426E | 2026E | Q127E | Q227E | Q327E | Q427E | 2027E | 2028E | 2029E | 2030E |
|---|---|---|---|---|---|---|---|---|---|---|---|---|---|---|
| Revenue | 237,553 | 61,038 | 67,160 | 71,276 | 74,379 | 273,854 | 77,477 | 82,528 | 90,747 | 95,486 | 346,239 | 447,135 | 510,723 | 564,912 |
| - YoY chg (%) | 2% | 5% | 14% | 21% | 20% | 15% | 27% | 23% | 27% | 28% | 26% | 29% | 14% | 11% |
| - QoQ chg (%) | - | -1% | 10% | 6% | 4% | - | 4% | 7% | 10% | 5% | - | - | - | - |
| Revenue (US$m) | 7,567 | 1,930 | 2,123 | 2,253 | 2,352 | 8,658 | 2,449 | 2,609 | 2,869 | 3,019 | 10,947 | 14,136 | 16,147 | 17,860 |
| - YoY chg (%) | 5% | 10% | 11% | 16% | 19% | 14% | 27% | 23% | 27% | 28% | 26% | 29% | 14% | 11% |
| - QoQ chg (%) | - | -2% | 10% | 6% | 4% | - | 4% | 7% | 10% | 5% | - | - | - | - |
| Gross profit | 68,906 | 17,818 | 20,818 | 22,682 | 23,996 | 85,315 | 25,739 | 30,594 | 35,089 | 37,681 | 129,103 | 202,824 | 237,001 | 263,849 |
| - Gross margin | 29.0% | 29.2% | 31.0% | 31.8% | 32.3% | 31.2% | 33.2% | 37.1% | 38.7% | 39.5% | 37.3% | 45.4% | 46.4% | 46.7% |
| Operating profit | 43,949 | 11,276 | 13,623 | 15,227 | 16,420 | 56,547 | 17,604 | 22,137 | 26,171 | 28,505 | 94,417 | 162,248 | 191,828 | 213,492 |
| - Operating margin | 18.5% | 18.5% | 20.3% | 21.4% | 22.1% | 20.6% | 22.7% | 26.8% | 28.8% | 29.9% | 27.3% | 36.3% | 37.6% | 37.8% |
| Non-op profit | 5,699 | 5,367 | 1,190 | 1,654 | 1,347 | 9,557 | 803 | 1,031 | 1,481 | 1,131 | 4,446 | 7,071 | 10,731 | 13,764 |
| Pre-tax profit | 49,648 | 16,644 | 14,813 | 16,881 | 17,767 | 66,104 | 18,408 | 23,168 | 27,652 | 29,636 | 98,863 | 169,320 | 202,559 | 227,256 |
| Net profit | 41,717 | 16,171 | 12,591 | 14,349 | 15,102 | 58,213 | 15,647 | 19,693 | 23,504 | 25,190 | 84,034 | 143,922 | 172,176 | 193,168 |
| UBS EPS (NT$) | 3.34 | 1.29 | 1.01 | 1.15 | 1.21 | 4.66 | 1.25 | 1.58 | 1.88 | 2.02 | 6.73 | 11.52 | 13.78 | 15.46 |
| - YoY chg (%) - QoQ chg (%) | -12% - | 108% 61% | 41% -22% | -4% 14% | 50% 5% | 39% - | -3% 4% | 56% 26% | 64% 19% | 67% 7% | 44% - | 71% - | 20% - | 12% - |
Source: Company data, UBS estimates
Figure 10: UMC's 12-month-forward P/BV (x)
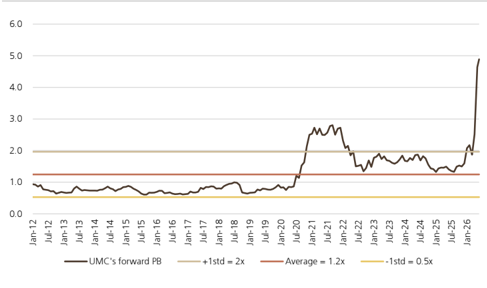
Source: LSEG, UBS estimates
Figure 11: UMC's 12-month-forward PE (x)
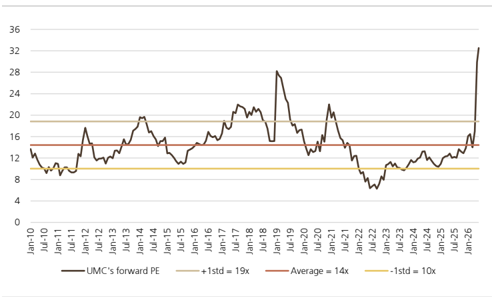
Source: LSEG, UBS estimates
Company Description
Company Description
Founded in 1980, UMC is a leading dedicated foundry services provider, with annual capacity of around 10.0m 8-inch equivalent wafers as of 2022. In 2022, communication applications accounted for 45% of its total revenue, consumer electronics 26%, computer applications 15% and other 14%.
Industry Outlook
While industry excess capacity may continue in the near term, we believe the competitive dynamics stabilised in 2025, based on the consumer restocking opportunity and less significant Chinese expansion. We believe the pace of capacity growth in China likely peaked in 2024 and may start to moderate in 2025-26. On the demand side, we are optimistic about structural positives stemming from silicon content growth on technology spec upgrades (eg, 5G, Wi-Fi, OLED and camera image sensors/image signal processing) and new applications (eg, IoT and auto/ industrial).
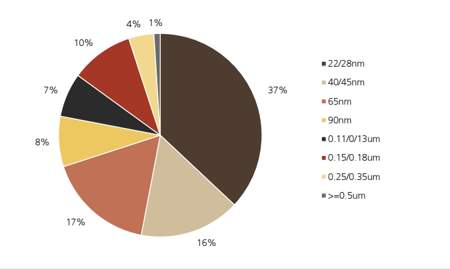
Revenue by technology (2025)
Source: Company data, UBS
Revenue by application (2025)
Source: Company data, UBS
UMC (2303.TW)
| Income Statement (NT$m) | 12/23 | 12/24 | 12/25 | 12/26E | %ch | 12/27E | %ch | 12/28E | 12/29E | 12/30E |
|---|---|---|---|---|---|---|---|---|---|---|
| Revenues | 222,533 | 232,303 | 237,553 | 273,854 | 15.3 | 346,239 | 26.4 | 447,135 | 510,723 | 564,912 |
| Gross profit | 77,744 | 75,654 | 68,906 | 85,315 | 23.8 | 129,103 | 51.3 | 202,824 | 237,001 | 263,849 |
| EBITDA (UBS) | 98,375 | 99,780 | 103,208 | 122,068 | 18.3 | 162,885 | 33.4 | 226,143 | 249,479 | 265,289 |
| Depreciation & amortisation | (40,484) | (48,168) | (59,259) | (65,521) | -10.6 | (68,468) | -4.5 | (63,895) | (57,651) | (51,797) |
| EBIT (UBS) | 57,891 | 51,613 | 43,949 | 56,547 | 28.7 | 94,417 | 67.0 | 162,248 | 191,828 | 213,492 |
| Associates & investment income | 6,913 | 411 | 2,418 | 3,015 | 24.7 | 200 | -93.4 | 200 | 200 | 200 |
| Other non-operating income | 2,559 | 2,022 | 2,344 | 4,816 | 105.5 | 400 | -91.7 | 400 | 400 | 400 |
| Net interest | 3,549 | 2,174 | 937 | 1,726 | 84.3 | 3,846 | 122.8 | 6,471 | 10,131 | 13,164 |
| Exceptionals (incl goodwill) | 0 | 0 | 0 | 0 | - | 0 | - | 0 | 0 | 0 |
| Pre-tax profit | 70,912 | 56,220 | 49,648 | 66,104 | 33.1 | 98,863 | 49.6 | 169,320 | 202,559 | 227,256 |
| Tax | (9,472) | (9,113) | (8,113) | (7,946) | 2.1 | (14,829) | -86.6 | (25,398) | (30,384) | (34,088) |
| Profit after tax | 61,440 | 47,106 | 41,535 | 58,158 | 40.0 | 84,034 | 44.5 | 143,922 | 172,176 | 193,168 |
| Preference dividends | 0 | 0 | 0 | 0 | - | 0 | - | 0 | 0 | 0 |
| Minorities | (450) | 105 | 182 | 54 | -70.0 | 0 | - | 0 | 0 | 0 |
| Extraordinary items | 0 | 0 | 0 | 0 | - | 0 | - | 0 | 0 | 0 |
| Net earnings (local GAAP) | 60,990 | 47,211 | 41,716 | 58,213 | 39.5 | 84,034 | 44.4 | 143,922 | 172,176 | 193,168 |
| Net earnings (UBS) | 60,990 | 47,211 | 41,716 | 58,213 | 39.5 | 84,034 | 44.4 | 143,922 | 172,176 | 193,168 |
| Tax rate (%) | 13.4 | 16.2 | 16.3 | 12.0 | -26.4 | 15.0 | 24.8 | 15.0 | 15.0 | 15.0 |
| Per Share (NT$) | 12/23 | 12/24 | 12/25 | 12/26E | %ch | 12/27E | %ch | 12/28E | 12/29E | 12/30E |
| EPS (UBS, diluted) | 4.93 | 3.80 | 3.34 | 4.66 | 39.5 | 6.73 | 44.4 | 11.52 | 13.78 | 15.46 |
| EPS (local GAAP, diluted) | 4.93 | 3.80 | 3.34 | 4.66 | 39.5 | 6.73 | 44.4 | 11.52 | 13.78 | 15.46 |
| EPS (UBS, basic) | 4.93 | 3.80 | 3.34 | 4.66 | 6.73 | 44.4 | 11.52 | 15.46 | ||
| DPS (net) (NT$) | 3.02 | 39.5 | 4.71 | 44.4 | 8.07 | 13.78 | ||||
| Cash EPS (UBS, diluted) 1 | 8.20 | 2.87 7.67 | 2.34 | 3.26 | 39.5 22.5 | 12.21 | 23.2 | 16.64 | 9.65 18.40 | 10.83 19.61 |
| Book value per share | 28.67 | 30.16 | 8.09 30.17 | 9.91 33.59 | 11.3 | 37.05 | 10.3 | 43.86 | 49.58 | 55.40 |
| Average shares (diluted) | 12,371 | 12,436 | 12,485 | 12,491 | 0.1 | 12,491 | 0.0 | 12,491 | 12,491 | 12,491 |
| Balance Sheet (NT$m) | 12/23 | 12/24 | 12/25 | 12/26E | %ch | 12/27E | %ch | 12/28E | 12/29E | 12/30E |
| Cash and equivalents Other current assets | 132,554 84,244 | 105,000 84,678 | 110,660 94,123 | 140,395 116,552 | 26.9 23.8 | 195,517 145,275 | 39.3 24.6 | 284,905 176,475 | 359,570 194,044 | 430,155 213,791 |
| Total current assets | 216,797 | 189,678 | 204,783 | 461,380 | 553,614 | 643,946 | ||||
| Net tangible fixed assets | 239,123 | 279,059 | 271,395 | 256,947 | 25.5 | 340,791 | 32.6 | 215,820 | 205,614 | 201,262 |
| Net intangible fixed assets | 4,373 | 4,154 | 4,743 | 253,293 | -6.7 -6.0 | 232,270 4,460 | -8.3 0.0 | 4,460 | 4,460 | 4,460 |
| Investments / other assets | 98,894 | 97,309 | 98,075 | 4,460 116,467 | 18.8 | 124,833 | 7.2 | 134,161 | 139,089 | 144,445 |
| 559,187 | 570,201 | 702,354 | 11.3 | |||||||
| Total assets | 578,996 | 631,166 | 9.0 | 815,821 | 902,777 | 994,113 | ||||
| Trade payables & other ST liabilities | 69,478 | 55,750 | 60,001 | 60,601 | 1.0 | 65,536 | 8.1 | 68,309 | 70,257 | 74,199 |
| Short term debt Total current liabilities | 29,537 | 19,510 | 27,597 | 22,888 83,489 | -17.1 -4.7 | 22,888 | 0.0 5.9 | 22,888 91,198 | 22,888 | 22,888 97,088 |
| Long term debt | 99,015 45,236 | 75,260 55,533 | 87,598 45,372 | 47,165 | 4.0 | 88,424 47,165 | 0.0 | 47,165 | 93,145 47,165 | 47,165 |
| Other long term | 55,358 | 22.3 | 103,905 | 28.4 | 129,501 | 143,078 | ||||
| liabilities Preferred shares | 0 | 61,222 0 | 66,170 | 80,937 | - | 0 | - | 0 | 0 | 157,827 0 |
| Total liabilities (incl pref shares) | 199,608 | 192,016 | 0 199,141 | 0 211,591 | 6.3 | 239,494 | 13.2 | 267,863 | 283,388 | 302,080 |
| Common s/h equity Minority interests | 359,238 | 377,928 | 379,768 | 419,540 | 10.5 | 462,824 | 0.0 | 36 | 619,353 | 691,998 |
| 341 | 257 | 87 | 36 | -59.2 | 36 | 10.3 | 547,923 | 36 | 36 | |
| Total liabilities & equity | 559,187 | 570,201 | 578,996 | 631,166 | 9.0 | 702,354 | 11.3 | 815,821 | 902,777 | 994,113 |
| Cash Flow (NT$m) | 12/23 | 12/24 | 12/25 | 12/26E | %ch | 12/27E | %ch | 12/28E | 12/29E | 12/30E |
| Net income (before pref divs) | 60,990 | 47,211 | 41,716 | 58,213 | 39.5 | 84,034 | 44.4 | 143,922 63,895 | 172,176 | 193,168 |
| Depreciation & amortisation | 40,484 | 48,168 | 59,259 | 65,521 | 10.6 | 68,468 | 4.5 | (17,076) | 57,651 | 51,797 |
| Net change in working capital | 916 | (2,889) | 1,617 | (5,228) | - | (15,785) | -201.9 | (9,707) | (10,965) | |
| Other operating | (10,301) | 2,350 | (4,299) | (15,543) | -261.6 | (16,369) | -5.3 | (20,679) | (10,842) | (10,196) |
| Operating cash flow | 92,089 (91,150) | 94,840 | 98,293 | 102,963 | 4.8 | 120,348 | 16.9 | 170,061 (47,445) | 209,278 | 223,803 |
| Tangible capital expenditure | 0 | (88,423) | (47,616) 0 | (47,445) | 0.4 | (47,445) | 0.0 | (47,445) 0 | (47,445) | |
| Intangible capital expenditure | 0 | 0 | - | 0 | - | 0 | 0 | |||
| Net (acquisitions) & disposals | 0 | 0 | 0 | - | 0 0 | - - | 0 0 | 0 | 0 | |
| Other investing | (6,636) | 2,482 | 0 (5,538) | (8,832) | -59.5 | 0 | 0 | |||
| Investing cash flow | (97,787) | (85,941) | (53,154) | (56,277) | -5.9 | (47,445) | 15.7 | (47,445) | (47,445) | (47,445) |
| Equity dividends paid | (45,018) | (37,586) | (35,788) 0 | (29,202) | 18.4 | (40,749) | -39.5 - | (58,823) 0 | (100,745) 0 | (120,523) 0 |
| Share issues / (buybacks) | 0 | 0 | - | 0 | ||||||
| Other financing | 0 (11,445) | (1,265) | (1,596) | 13,879 | - | 22,968 | 65.5 | 25,596 | 13,577 | 14,750 |
| Change in debt & pref shares | 27,377 | (337) | (1,812) | (3,044) | -68.0 | 0 | - | 0 | 0 | 0 |
| Financing cash flow | (29,086) | (39,188) | (39,195) | (18,368) | 53.1 | (17,781) | 3.2 | (33,227) | (87,168) | (105,773) 70,585 |
| Cash flow inc/(dec) in cash | (34,783) | (30,289) | 5,944 | 28,318 1,417 | 376.5 - | 55,122 0 | 94.7 -100.0 | 89,388 0 | 74,665 0 | 0 |
| FX / non cash items | (6,482) | 2,736 | (284) | 29,735 | NM | 55,122 | 85.4 | 89,388 | ||
| Balance sheet inc/(dec) in cash | (41,265) | 5,660 | 74,665 | |||||||
| (27,553) | 70,585 |
Source: Company accounts, UBS estimates. (UBS) metrics use reported figures which have been adjusted by UBS analysts. 1 Cash EPS (UBS, diluted) is calculated using UBS net income adding back depreciation and amortization.
UMC (2303.TW)
| Valuation (x) | 12/23 | 12/24 | 12/25 | 12/26E | 12/27E | 12/28E | 12/29E | 12/30E |
|---|---|---|---|---|---|---|---|---|
| P/E (local GAAP, diluted) | 9.9 | 13.4 | 13.3 | 36.8 | 25.5 | 14.9 | 12.4 | 11.1 |
| P/E (UBS, diluted) | 9.9 | 13.4 | 13.3 | 36.8 | 25.5 | 14.9 | 12.4 | 11.1 |
| P/CEPS | 5.9 | 6.7 | 5.5 | 17.3 | 14.0 | 10.3 | 9.3 | 8.7 |
| Equity FCF (UBS) yield% | 0.2 | 1.0 | 9.1 | 2.6 | 3.4 | 5.7 | 7.5 | 8.2 |
| Dividend yield (net)% | 6.2 | 5.6 | 5.3 | 1.9 | 2.7 | 4.7 | 5.6 | 6.3 |
| P/BV | 1.7 | 1.7 | 1.5 | 5.1 | 4.6 | 3.9 | 3.5 | 3.1 |
| EV/revenues (core) | 2.0 | 2.3 | 1.9 | 7.4 | 5.7 | 4.3 | 3.6 | 3.1 |
| EV/EBITDA (UBS core) | 4.4 | 5.2 | 4.3 | 16.5 | 12.1 | 8.4 | 7.3 | 6.6 |
| EV/EBIT (core) | 7.5 | 10.1 | 10.2 | 35.7 | 20.9 | 11.7 | 9.5 | 8.2 |
| EV/OpFCF (core) | 53.6 | 61.8 | 7.8 | 29.1 | 19.8 | 11.8 | 9.5 | 8.4 |
| EV/op. invested capital | 2.3 | 2.1 | 1.6 | 7.6 | 7.7 | 7.7 | 7.4 | 7.2 |
| Enterprise value (NT$m) | 12/23 | 12/24 | 12/25 | 12/26E | 12/27E | 12/28E | 12/29E | 12/30E |
| Market cap. | 602,268 | 639,158 | 556,509 | 2,158,869 | 2,158,869 | 2,158,869 | 2,158,869 | 2,158,869 |
| Net debt (cash) | (92,068) | (43,869) | (33,824) | (54,016) | (97,902) | (170,158) | (252,184) | (324,809) |
| Buy out of minorities | 342 | 299 | 172 | 61 | 36 | 36 | 36 | 36 |
| Pension provisions/other | 0 | 0 | 0 | 0 | 0 | 0 | 0 | 0 |
| Total enterprise value | 510,542 | 595,588 | 522,857 | 2,104,914 | 2,061,002 | 1,988,747 | 1,906,720 | 1,834,095 |
| Non core assets | (74,255) | (72,487) | (75,373) | (86,828) | (86,784) | (86,739) | (86,695) | (86,650) |
| Core enterprise value | 436,288 | 523,100 | 447,484 | 2,018,086 | 1,974,218 | 1,902,008 | 1,820,025 | 1,747,445 |
| Growth (%) | 12/23 | 12/24 | 12/25 | 12/26E | 12/27E | 12/28E | 12/29E | 12/30E |
| Revenue | (20.2) | 4.4 | 2.3 | 15.3 | 26.4 | 29.1 | 14.2 | 10.6 |
| EBITDA (UBS) | (33.7) | 1.4 | 3.4 | 18.3 | 33.4 | 38.8 | 10.3 | 6.3 |
| EBIT (UBS) | (44.5) | (10.8) | (14.8) | 28.7 | 67.0 | 71.8 | 18.2 | 11.3 |
| EPS (UBS, diluted) | (30.4) | (23.0) | (12.0) | 39.5 | 44.4 | 71.3 | 19.6 | 12.2 |
| Net DPS | (17.0) | (5.2) | (18.4) | 39.5 | 44.4 | 71.3 | 19.6 | 12.2 |
| Margins & Profitability (%) | 12/23 | 12/24 | 12/25 | 12/26E | 12/27E | 12/28E | 12/29E | 12/30E |
| Gross profit margin | 34.9 | 32.6 | 29.0 | 31.2 | 37.3 | 45.4 | 46.4 | 46.7 |
| EBITDA margin | 44.2 | 43.0 | 43.4 | 44.6 | 47.0 | 50.6 | 48.8 | 47.0 |
| EBIT (UBS) margin | 26.0 | 22.2 | 18.5 | 20.6 | 27.3 | 36.3 | 37.6 | 37.8 |
| Net earnings (UBS) margin | 27.4 | 20.3 | 17.6 | 21.3 | 24.3 | 32.2 | 33.7 | 34.2 |
| ROIC (EBIT) | 31.1 | 20.5 | 16.2 | 21.4 | 36.8 | 65.3 | NM | NM |
| ROIC post tax | 26.5 | 17.2 | 13.4 | 18.7 | 31.3 | 55.5 | 66.6 | 74.3 |
| ROE (UBS) | 17.6 | 12.8 | 11.0 | 14.6 | 19.0 | 28.5 | 29.5 | 29.5 |
| Capital structure & Coverage (x) | 12/23 | 12/24 | 12/25 | 12/26E | 12/27E | 12/28E | 12/29E | 12/30E |
| Net debt / EBITDA | (0.6) | (0.3) | (0.4) | (0.6) | (0.8) | (1.0) | (1.2) | (1.4) |
| Net debt / total equity% | (16.1) | (7.9) | (9.9) | (16.8) | (27.1) | (39.2) | (46.7) | (52.0) |
| Net debt / (net debt + total equity)% | (19.1) | (8.6) | (11.0) | (20.1) | (37.2) | (64.5) | (87.8) | NM |
| Net debt/EV% | (18.0) | (7.4) | (6.5) | (2.6) | (4.8) | (8.6) | (13.2) | (17.7) |
| Capex / depreciation% | NM | 183.6 | 80.4 | 72.4 | 69.3 | 74.3 | 82.3 | 91.6 |
| Capex / revenue% EBIT / net interest | NM - | NM - | 20.0 - | 17.3 - | 13.7 - | 10.6 - | 9.3 - | 8.4 - |
| Dividend cover (UBS) | 1.6 | 1.3 | 1.4 | 1.4 | 1.4 | 1.4 | 1.4 | 1.4 |
| Div. payout ratio (UBS)% | 61.3 | 75.5 | 70.0 | 70.0 | 70.0 | 70.0 | 70.0 | 70.0 |
| 12/25 | ||||||||
| Revenues by division (NT$m) | 12/23 | 12/24 | 12/26E | 12/27E | 12/28E | 12/29E | 12/30E | |
| Foundry | 222,533 | 232,303 | 237,553 | 273,854 | 346,239 | 447,135 | 510,723 | 564,912 |
| Others | 0 | 0 | 0 | 0 | 0 | 0 | 0 | 0 |
| Total | 222,533 | 232,303 | 237,553 | 273,854 | 346,239 | 447,135 | 510,723 | 564,912 |
| EBIT (UBS) by division (NT$m) | 12/23 | 12/24 | 12/25 | |||||
| others | 57,891 | 51,613 | 12/26E | 12/27E | 12/28E | 12/29E | 12/30E | |
| Foundry and Others | 0 | 0 | 43,949 0 | 56,547 0 | 94,417 0 | 162,248 0 | 191,828 0 | 213,492 0 |
| Total | 57,891 | 51,613 | 43,949 | 56,547 | 94,417 | 162,248 | 191,828 | 213,492 |
Source: Company accounts, UBS estimates. (UBS) metrics use reported figures which have been adjusted by UBS analysts.
Forecast returns
| Forecast price appreciation | 34.1% |
|---|---|
| Forecast dividend yield | 1.9% |
| Forecast stock return | 36.0% |
| Market return assumption | 6.2% |
| Forecast excess return | 29.8% |
Company Description
Founded in 1980, UMC is a leading dedicated foundry services provider, with annual capacity of around 10.0m 8-inch equivalent wafers as of 2022. In 2022, communication applications accounted for 45% of its total revenue, consumer electronics 26%, computer applications 15% and other 14%.
Valuation Method and Risk Statement
We base our price target for UMC on a PE methodology.
In our view, UMC faces a variety of risks, including rapidly changing technology, intense competition, high capital investment and cyclical demand. The company has a history of paying out stock options to employees, which could dilute earnings.
Quantitative Research Review
UBS Global Research publishes a quantitative assessment of its analysts' responses to certain questions about the likelihood of an occurrence of a number of short term factors in a product known as the 'Quantitative Research Review'. The views for this month can be found below. Views contained in this assessment on a particular stock reflect only the views on those short term factors which are a different timeframe to the 12-month timeframe reflected in any equity rating set out in this note. For previous responses please make reference to (i) previous UBS Global Research reports; and (ii) where no applicable research report was published that month, the Quantitative Research Review which can be found at https://neo.ubs.com/quantitative, or contact your UBS sales representative for access to the report or the Quantitative Research Team on ubs-quant-answers@ubs.com. A consolidated report which contains all responses is also available and again you should contact your UBS sales representative for details and pricing or the Quantitative Research Team on the email above.
UMC
| Question | Response |
|---|---|
| 1. Is the industry structure facing the firm likely to improve or deteriorate over the next six months? Rate on a scale of 1-5 (1 = getting worse, 3 = no change, 5 = getting better, N/A = no view) | 4 |
| 2. Is the regulatory/government environment facing the firm likely to improve or deteriorate over the next six months? Rate on a scale of 1-5 (1 = getting tougher 3 = no change, 5 = getting better, N/A = no view) | 3 |
| 3. Over the last 3-6 months in broad terms have things been improving/no change/getting worse for this stock? Rate on a scale of 1-5 (1 = getting a lot worse, 3 = not much change, 5 = getting a lot better, N/A = no view) | 4 |
| 4. Relative to the current CONSENSUS EPS forecast, is the next company EPS update likely to lead to: (1 = negative surprise vs consensus, 3 = in-line with consensus, 5 = positive surprise vs consensus expectations, N/A = no view) | 4 |
| 5. What's driving the difference? | |
| 6. Relative to YOUR current earnings forecast, is there relatively greater risk at the next earnings result of:(1 = downside skew risk to earnings, 3 = equal upside or downside risk to earnings, 5 = upside skew risk to earnings, N/A = no view) | 3 |
| 7. What's driving the difference? | |
| 8. Is there an upcoming catalyst for the company over the next three months? | |
| 9. Is there an actual or approximate date for the catalyst? | |
| 10. Is the catalyst date an actual or approximate date? | |
| 11. What is the catalyst? |
Required Disclosures
This document has been prepared by UBS Securities Pte. Ltd., Taipei Branch, an affiliate of UBS AG. UBS AG, its subsidiaries, branches and affiliates, including former Credit Suisse AG and its subsidiaries, branches and affiliates are referred to herein as "UBS".
For information on the ways in which UBS manages conflicts and maintains independence of its UBS Global Research product; historical performance information; certain additional disclosures concerning UBS Global Research recommendations; and terms and conditions for certain third party data used in research report, please visit https://www.ubs.com/disclosures. Unless otherwise indicated, information and data in this report are based on company disclosures including but not limited to annual, interim, quarterly reports and other company announcements. The figures contained in performance charts refer to the past; past performance is not a reliable indicator of future results. Additional information will be made available upon request. UBS Securities Co. Limited is licensed to conduct securities investment consultancy businesses by the China Securities Regulatory Commission. UBS acts or may act as principal in the debt securities (or in related derivatives) that may be the subject of this report. This recommendation was finalized on: 23 June 2026 01:33 PM GMT. UBS has designated certain UBS Global Research department members as Derivatives Research Analysts where those department members publish research principally on the analysis of the price or market for a derivative, and provide information reasonably sufficient upon which to base a decision to enter into a derivatives transaction. Where Derivatives Research Analysts coauthor research reports with Equity Research Analysts or Economists, the Derivatives Research Analyst is responsible for the derivatives investment views, forecasts, and/or recommendations. Quantitative Research Review: UBS Global Research publishes a quantitative assessment of its analysts' responses to certain questions about the likelihood of an occurrence of a number of short term factors in a product known as the 'Quantitative Research Review'. Views contained in this assessment on a particular stock reflect only the views on those short term factors which are a different timeframe to the 12-month timeframe reflected in any equity rating set out in this note. For the latest responses, please see the Quantitative Research Review Addendum at the back of this report, where applicable. For previous responses please make reference to (i) previous UBS Global Research reports; and (ii) where no applicable research report was published that month, the Quantitative Research Review which can be found at https://neo.ubs.com/ quantitative, or contact your UBS sales representative for access to the report or the Quantitative Research Team on ubs-quantanswers@ubs.com. A consolidated report which contains all responses is also available and again you should contact your UBS sales representative for details and pricing or the Quantitative Research team on the email above.