PDF 原檔:260617_citi_TUC_original.pdf
原始內容
(RIC: 62(4.1WO, BB: 62(4 11)
TWD
1,750
1,500
1,250
1,000
750
500
250
30
Jun
17 Jun 2026 17:44:56 ET │ 15 pages
Sep
Dec
Mar
TUC (6274.TWO)
Sales/GM upside potential; Buy
CITI'S TAKE
CCL price hike is ongoing with TUC and EMC continuously posting monthly sales uptick in April and May. We expect the price hike to continue in June and 2H26E. EMC just posted unaudited May ESP likely implied to GM upside on price hike and enhanced product mix. We believe TUC would also benefit from the CCL tightness given its more aggressive pricing strategies. Thus, we raise our TP to NT$1,950 (25x 2027E EPS) to factor in strong price hike benefit and open a 30-day positive Catalyst Watch on upcoming monthly sales/unaudited earnings upside potential. Buy.
Enhanced product mix and aggressive price hike -Our industry check suggests that leading CCL makers like EMC may be facing capacity constraint and cherrypicking of orders, resulting in enhanced product mix or aggressive price hike to those non-AI demand. We expect TUC either to receive some outflowing orders or to hike the prices to customers continuously. We believe TUC's pricing would be more aggressive on those non-AI demand and be at least on par with EMC for AI customers.
Read-across from EMC's unaudited May earnings beat on price hike -EMC just reported unaudited May EPS of NT$9.07 vs 1Q26 Citi/BBG forecasts of NT$19.5/21.7. We think EMC unaudited May EPS likely implies GM profile of up to range 34-35% in May, higher than EMC's previous 2Q26 guidance range of 29.5-32.5%. To note that, EMC would see pricing benefit as well in June. We believe TUC would also see the price hike benefits as EMC does in 2Q26, leading to a GM beat in 2Q26.
CCL supply tightness continued with potential price hike again in 2H26 -We think CCL industry supply side will just increase 20-30%/30-40% YoY in 2026/27E, which we believe couldn't catch up with PCB capacity expansion pace or endcustomer demand. Even if CCL makers now are converting their capacity from midto-low end capacity to high-end one, we think it wouldn't alleviate the tightness in the near term. We expect another round of CCL price hike in 2H26 given the high season impact. TUC's new Thailand capacity now targets to ramp by end-3Q26, which would help the company to secure more demand going forward.
Earnings/TP raise. Buy -We lift our 2026/27/28E earnings by 14%/25%/24% to factor in better benefits from price hike. We lift our TP to NT$1,950 (25x 2027E EPS) from NT$1,600 (25x 2027E EPS) and reiterate our Buy rating.
Earnings Summary
| Year to 31Dec | Net Profit (NT$M) | DilutedEPS (NT$) | EPSgrowth (%) | P/E (x) | P/B (x) | ROE (%) | Yield (%) |
|---|---|---|---|---|---|---|---|
| 2024A | 2,604 | 9.15 | 204 | 182.6 | 33.6 | 20.1 | 0.2 |
| 2025A | 3,409 | 11.71 | 28.1 | 142.6 | 26.2 | 20.7 | 0.4 |
| 2026E | 10,432 | 35.78 | 205.4 | 46.7 | 16.8 | 43.8 | 0.4 |
| 2027E | 22,951 | 78.71 | 120 | 21.2 | 9.4 | 56.6 | 1.4 |
| 2028E | 34,731 | 119.11 | 51.3 | 14 | 5.6 | 50.1 | 3 |
Source: Powered by dataCentral
See Appendix A-1 for Analyst Certification, Important Disclosures and Research Analyst Affiliations.
| n Buy Catalyst Watch: Upside Price (17 Jun 2615:00) | NT$1,670.00 |
|---|---|
| Target price from NT$1,600.00 | NT$1,950.00↑ |
| Expected share price return | 16.8% |
| Expected dividend yield | 0.4% |
| Expected total return | 17.2% |
| MarketCap | NT$482,254M |
| US$15,327M |
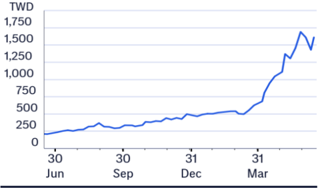
Price Performance (RIC: 6274.TWO, BB: 6274 TT)
Jack Chen AC
+886-2-8726-9091 jack1.chen@citi.com
Laura (Chia Yi) Chen +886-2-8726-9090 laura.cy.chen@citi.com
Nicholas Lai +886-2-8726-9093 nicholas.lai@citi.com
| 6274.TWO: Fiscalyearend31-Dec | Price: | NT$1,670.00; TP: NT$1,950.00; MarketCap:NT$482,254m; Recomm:Buy | NT$1,670.00; TP: NT$1,950.00; MarketCap:NT$482,254m; Recomm:Buy | NT$1,670.00; TP: NT$1,950.00; MarketCap:NT$482,254m; Recomm:Buy | NT$1,670.00; TP: NT$1,950.00; MarketCap:NT$482,254m; Recomm:Buy | NT$1,670.00; TP: NT$1,950.00; MarketCap:NT$482,254m; Recomm:Buy | |||||
|---|---|---|---|---|---|---|---|---|---|---|---|
| Profit&Loss(NT$m) | 2024 | 2025 | 2026E | 2027E | 2028E | Valuation ratios | 2024 | 2025 | 2026E | 2027E | 2028E |
| Sales revenue | 23,070 | 30,340 | 58,970 | 99,923 | 139,104 | PE(x) | na | na | 46.7 | 21.2 | 14.0 |
| Cost of sales | -17,729 | -23,442 | -41,255 | -63,020 | -84,356 | PB(x) | 33.6 | 26.2 | 16.8 | 9.4 | 5.6 |
| Gross profit | 5,342 | 6,898 | 17,715 | 36,902 | 54,748 | EV/EBITDA(x) | na | na | 33.7 | 14.9 | 9.6 |
| Gross Margin (%) | 23.2 | 22.7 | 30.0 | 36.9 | 39.4 | FCFyield (%) | -0.1 | -0.3 | -2.6 | 1.9 | 5.4 |
| EBITDA(Adj) | 3,784 | 4,803 | 14,585 | 32,912 | 49,425 | Dividend yield (%) | 0.2 | 0.4 | 0.4 | 1.4 | 3.0 |
| EBITDAMargin(Adj) (%) | 16.4 | 15.8 | 24.7 | 32.9 | 35.5 | Payout ratio (%) | 43 | 53 | 21 | 29 | 42 |
| Depreciation | -448 | -447 | -1,053 | -2,850 | -3,863 | ROE(%) | 20.1 | 20.7 | 43.8 | 56.6 | 50.1 |
| Amortisation | -5 | -13 | 0 | 0 | 0 | Cashflow(NT$m) | 2024 | 2025 | 2026E | 2027E | 2028E |
| EBIT (Adj) | 3,332 | 4,344 | 13,532 | 30,062 | 45,563 | EBITDA | 3,784 | 4,803 | 14,585 | 32,912 | 49,425 |
| EBIT Margin (Adj) (%) | 14.4 | 14.3 | 22.9 | 30.1 | 32.8 | Working capital | -2,379 | -3,272 | -13,675 | -8,755 | -8,465 |
| Net interest | 90 | 42 | 48 | 48 | 48 | Other | -728 | -935 | -3,100 | -7,111 | -10,832 |
| Associates | -49 | 35 | 40 | 40 | 40 | Operating cashflow | 677 | 596 | -2,190 | 17,046 | 30,129 |
| Non-Op/Except/Other Adj | 5 | 98 | 44 | 20 | 20 | Capex | -1,196 | -1,949 | -10,500 | -8,000 | -4,000 |
| Pre-tax profit | 3,378 | 4,519 | 13,665 | 30,171 | 45,671 | Net acq/disposals | -993 | -528 | 1,696 | 0 | 0 |
| Tax | -773 | -1,109 | -3,233 | -7,220 | -10,940 | Other | 1,059 | -4,025 | 0 | 0 | 1 |
| Extraord./Min.Int./Pref.div. | 0 | 0 | 0 | 0 | 0 | Investing cashflow | -1,130 | -6,502 | -8,804 | -8,000 | -3,999 |
| Reported net profit | 2,604 | 3,409 | 10,432 | 22,951 | 34,731 | Dividends paid | -1,090 | -1,797 | -2,165 | -6,624 | -14,574 |
| Net Margin (%) | 11.3 | 11.2 | 17.7 | 23.0 | 25.0 | Financing cashflow | 1,376 | 4,888 | 6,112 | 3,967 | 2,454 |
| CoreNPAT | 2,604 | 3,409 | 10,432 | 22,951 | 34,731 | Net change in cash | 1,322 | -1,018 | -4,882 | 13,013 | 28,584 |
| Per share data | 2024 | 2025 | 2026E | 2027E | 2028E | Free cashflow to s/holders | -519 | -1,353 | -12,690 | 9,046 | 26,129 |
| Reported EPS($) | 9.15 | 11.71 | 35.78 | 78.71 | 119.11 | ||||||
| Core EPS($) | 9.15 | 11.71 | 35.78 | 78.71 | 119.11 | ||||||
| DPS($) | 3.95 | 6.22 | 7.50 | 22.94 | 50.48 | ||||||
| CFPS($) | 2.38 | 2.05 | -7.51 | 58.46 | 103.33 | ||||||
| -1.82 | -4.65 | -43.52 | 31.02 | 89.61 | |||||||
| FCFPS($) BVPS($) | 49.64 | 63.84 | 99.62 | 178.33 | 297.44 | ||||||
| Wtdavgordshares(m) | 272 | 278 | 281 | 281 | 281 | ||||||
| Wtdavgdiluted shares (m) | 285 | 291 | 292 | 292 | 292 | ||||||
| Growthrates | 2024 | 2025 | 2026E | 2027E | 2028E | ||||||
| Sales revenue (%) | 44.2 | 31.5 | 94.4 | 69.4 | 39.2 | ||||||
| EBIT (Adj) (%) | 133.9 | 30.4 | 211.5 | 122.2 | 51.6 | ||||||
| CoreNPAT(%) | 216.3 | 30.9 | 206.0 | 120.0 | 51.3 | ||||||
| CoreEPS(%) | 204.0 | 28.1 | 205.4 | 120.0 | 51.3 | ||||||
| BalanceSheet(NT$m) | 2024 | 2025 | 2026E | 2027E | 2028E | ||||||
| Cash&cashequiv. | 6,280 | 5,165 | 283 | 13,296 | 41,879 | ||||||
| Accounts receivables | 9,711 | 13,823 | 27,558 | 36,174 | 44,439 | ||||||
| Inventory | 3,189 | 7,405 | 13,284 | 17,415 | 21,260 | ||||||
| Net fixed &other tangibles | 5,604 | 7,349 | 15,100 | 20,251 | 20,388 | ||||||
| Goodwill &intangibles | 10 | 36 | 36 | 36 | 36 | ||||||
| Financial &other assets | 1,084 | 5,963 | 10,899 | 14,255 | 17,451 | ||||||
| Total assets | 25,878 | 39,741 | 67,162 | 101,428 | 145,453 | ||||||
| Accounts payable | 5,499 | 10,320 | 19,418 | 25,516 | 31,193 | ||||||
| Short-term debt | 962 | 2,141 | 2,141 | 2,141 | 2,141 | ||||||
| Long-term debt | 3,449 | 6,304 | 12,416 | 16,383 | 18,837 | ||||||
| Provisions &other liab | 1,631 | 2,363 | 4,141 | 5,391 | 6,554 | ||||||
| Total liabilities | 11,541 | 21,127 | 38,116 | 49,431 | 58,725 | ||||||
| Shareholders' equity | 14,337 | 18,614 | 29,046 | 51,997 | 86,728 | ||||||
| Minority interests | 0 | 0 | 0 | 0 | 0 | ||||||
| Total equity | 14,337 | 18,614 | 29,046 | 51,997 | 86,728 | ||||||
| Net debt (Adj) | -1,869 | 3,280 | 14,274 | 5,228 | -20,901 | ||||||
| Net debt to equity (Adj) (%) | -13.0 | ||||||||||
| For definitions of the items in this table, | please click here. | 17.6 | 49.1 | 10.1 | -24.1 |
Figure 1. TUC - Earnings Revisions
| 2Q26E | 2Q26E | 2Q26E | 3Q26E | 3Q26E | 3Q26E | 2026E | 2026E | 2026E | 2027E | 2027E | 2027E | 2028E | 2028E | 2028E | |
|---|---|---|---|---|---|---|---|---|---|---|---|---|---|---|---|
| (NT$mn) | New | Old | Chg. | New | Old | Chg. | New | Old | Chg. | New | Old | Chg. | New | ||
| Sales | 14,297 | 14,110 | 1% | 16,654 | 15,697 | 6% | 58,970 | 56,056 | 5% | 99,923 | 89,957 | 11% | 139,104 | 125,848 | 11% |
| Sequential growth (%) | 42% | 40% | 16% | 11% | 94% | 85% | 69% | 60% | 39% | 40% | |||||
| Gross profit | 4,285 | 3,788 | 13% | 5,202 | 4,591 | 13% | 17,715 | 15,815 | 12% | 36,902 | 30,243 | 22% | 54,748 | 45,145 | 21% |
| Opex | -987 | -974 | 1% | -1,184 | -1,116 | 6% | -4,183 | -3,973 | 5% | -6,840 | -6,248 | 9% | -9,185 | -8,436 | 9% |
| Operating profit | 3,298 | 2,814 | 17% | 4,018 | 3,475 | 16% | 13,532 | 11,842 | 14% | 30,062 | 23,996 | 25% | 45,563 | 36,709 | 24% |
| Pre-tax profit | 3,320 | 2,836 | 17% | 4,032 | 3,489 | 16% | 13,665 | 11,975 | 14% | 30,171 | 24,104 | 25% | 45,671 | 36,818 | 24% |
| Net income | 2,557 | 2,184 | 17% | 3,064 | 2,652 | 16% | 10,432 | 9,116 | 14% | 22,951 | 18,339 | 25% | 34,731 | 27,998 | 24% |
| EPS(NT$) | 8.77 | 7.49 | 17% | 10.51 | 9.10 | 16% | 35.78 | 31.27 | 14% | 78.71 | 62.90 | 25% | 119.11 | 96.02 | 24% |
| Gross margin (%) | 30.0% | 26.8% | +3.1 ppt | 31.2% | 29.3% | +2.0 ppt | 30.0% | 28.2% | +1.8 ppt | 36.9% | 33.6% | +3.3 ppt | 39.4% | 35.9% | +3.5 ppt |
| Opexratio (%) | -6.9% | -6.9% | +0.0ppt | -7.1% | -7.1% | +0.0ppt | -7.1% | -7.1% | -0.0 ppt | -6.8% | -6.9% | +0.1 ppt | -6.6% | -6.7% | +0.1 ppt |
| Operating margin (%) | 23.1% | 19.9% | +3.1 ppt | 24.1% | 22.1% | +2.0 ppt | 22.9% | 21.1% | +1.8 ppt | 30.1% | 26.7% | +3.4 ppt | 32.8% | 29.2% | +3.6 ppt |
| Net margin (%) | 17.9% | 15.5% | +2.4 ppt | 18.4% | 16.9% | +1.5 ppt | 17.7% | 16.3% | +1.4 ppt | 23.0% | 20.4% | +2.6 ppt | 25.0% | 22.2% | +2.7 ppt |
© 2026 Citigroup Inc. No redistribution without Citigroup's written permission.
Source: Citi Research Estimates
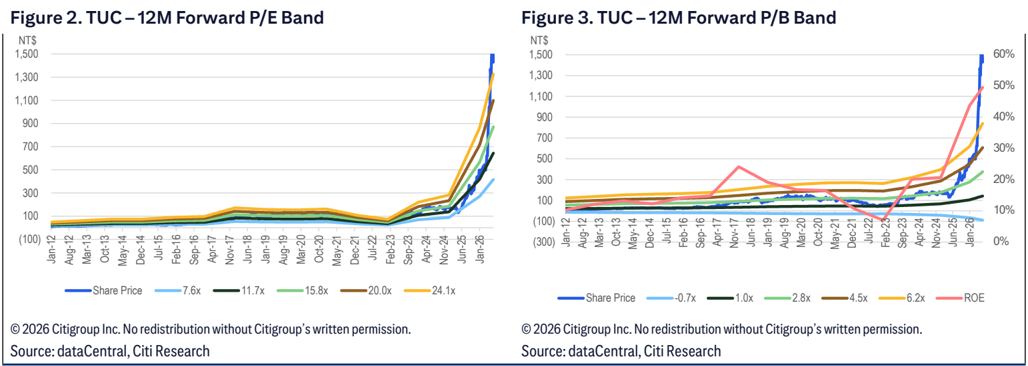
Figure 4. TUC - Forecast Summary
| TUC (NT$ inMn,year-endDec) | 1Q | 2QE 3QE 2026 | 2QE 3QE 2026 | 4QE | 4QE | 1QE 2QE 2027 | 3QE 4QE | 3QE 4QE | 2019 | 2019 | 2020 | 2021 2022 | 2021 2022 | 2023 | 2023 | 2024 | 2024 | 2025 | 2025 | 2026E 2027E | 2026E 2027E | ||
|---|---|---|---|---|---|---|---|---|---|---|---|---|---|---|---|---|---|---|---|---|---|---|---|
| Revenue | 10,054 | 14,297 | 16,654 | 17,965 | 19,211 | 22,656 | 28,862 29,194 | 17,527 | 18,047 | 21,132 | 18,472 | 16,003 | 23,070 | 30,340 | 58,970 | 99,923 | 139,104 | 139,104 | |||||
| COGS | -7,525 | -10,012 | -11,452 | -12,266 | -12,597 | -14,756 | -17,753 | -17,914 | -13,389 | -13,822 | -16,702 | -15,067 | -12,844 | -17,729 | -23,442 | -41,255 | -63,020 | -84,356 | -84,356 | ||||
| Depreciation costs | -113 | -162 | -238 | -317 | -455 | -534 | -597 | -660 | -317 | -332 | -360 | -379 | -375 | -363 | -359 | -829 | -2,245 | -3,043 | -3,043 | ||||
| Gross Profit | 2,529 | 4,285 | 5,202 | 5,700 | 6,614 | 7,900 | 11,109 | 11,280 | 4,138 | 4,225 | 4,430 | 3,405 | 3,159 | 5,342 | 6,898 | 17,715 | 36,902 | 54,748 | 54,748 | ||||
| Operating Expense | -701 | -987 | -1,184 | -1,311 | -1,364 | -1,586 | -1,965 | -1,925 | -1,981 | -1,951 | -2,050 | -1,908 | -1,735 | -2,010 | -2,554 | -4,183 | -6,840 | -9,185 | -9,185 | ||||
| SG&Aexpenses | -600 | -815 | -966 | -1,114 | -1,095 | -1,269 | -1,616 | -1,635 | -1,748 | -1,667 | -1,786 | -1,597 | -1,422 | -1,668 | -2,039 | -3,495 | -5,615 | -7,472 | -7,472 | ||||
| R&Dexpenses | -101 | -172 | -217 | -199 | -269 | -317 | -346 | -292 | -272 | -269 | -264 | -311 | -310 | -359 | -514 | -688 | -1,224 | -1,712 | -1,712 | ||||
| EBIT | 1,828 | 3,298 | 4,018 | 4,388 | 5,250 | 6,314 | 9,144 | 9,354 | 2,157 | 2,273 | 2,380 | 1,498 | 1,424 | 3,332 | 4,344 | 13,532 | 30,062 | 45,563 | 45,563 | ||||
| NetInterestIncome | 17 | 17 | 10 | 5 | 17 | 17 | 10 | 5 | 0 | 12 | 18 | 46 | 100 | 90 | 42 | 48 | 48 | 48 | 48 | ||||
| NetOtherIncome | 29 | 5 | 5 | 45 | 5 | 5 | 5 | 45 | 79 | -22 | 16 | 77 | 26 | -45 | 133 | 84 | 60 | 60 | 60 | ||||
| Pre-Tax Profit | 1,874 | 3,320 | 4,032 | 4,439 | 5,272 | 6,336 | 9,159 | 9,405 | 2,235 | 2,264 | 2,413 | 1,621 | 1,550 | 3,378 | 4,519 | 13,665 | 30,171 | 45,671 | 45,671 | ||||
| Tax | -614 | -764 | -968 | -888 | -1,371 | -1,394 | -2,198 | -2,257 | -483 | -488 | -532 | -360 | -726 | -773 | -1,109 | -3,233 | -7,220 | -10,940 | -10,940 | ||||
| NetProfit | 1,260 | 2,557 | 3,064 | 3,551 | 3,901 | 4,942 | 6,960 | 7,147 | 1,752 | 1,776 | 1,881 | 1,261 | 823 | 2,604 | 3,409 | 10,432 | 22,951 | 34,731 | 34,731 | ||||
| EPS-diluted (NT$) | 4.32 | 8.77 | 10.51 | 12.18 | 13.89 | 17.59 | 24.78 | 25.44 | 6.55 | 6.38 | 6.70 | 4.46 | 3.01 | 9.15 | 11.71 | 35.78 | 78.71 | 119.11 | 119.11 | ||||
| Revenue breakdown | |||||||||||||||||||||||
| HSD | 82% | 83% | 84% | 86% | 87% | 87% | 88% | 88% | 85% | 84% | 84% | 84% | 84% | 84% | 84% | 88% | 89% | 89% | |||||
| HDI | 6% | 6% | 6% | 6% | 6% | 5% | 5% | 5% | 8% | 8% | 8% | 8% | 6% | 7% | 6% | 5% | 4% | 4% | |||||
| Others | 12% | 11% | 10% | 9% | 8% | 8% | 7% | 7% | 7% | 9% | 8% | 8% | 11% | 9% | 10% | 7% | 7% | 7% | |||||
| Margins (%) | |||||||||||||||||||||||
| Gross Margin | 25.1% | 30.0% | 31.2% | 31.7% | 34.4% | 34.9% | 38.5% | 38.6% | 23.6% | 23.4% | 21.0% | 18.4% | 19.7% 22.7% | 30.0% | 23.2% 39.4% | 23.2% 39.4% | 23.2% 39.4% | 23.2% 39.4% | 36.9% | 23.2% 39.4% | 23.2% 39.4% | 23.2% 39.4% | |
| Operating Margin | 18.2% | 23.1% | 24.1% | 24.4% | 27.3% | 27.9% | 31.7% | 32.0% | 12.3% | 12.6% | 11.3% | 8.1% | 8.9% | 14.4% | 14.3% | 22.9% | 30.1% | 32.8% | 32.8% | ||||
| NetMargin | 12.5% | 17.9% | 18.4% | 19.8% | 20.3% | 21.8% | 24.1% | 24.5% | 10.0% | 9.8% | 8.9% | 6.8% | 5.1% | 11.3% | 11.2% | 17.7% | 23.0% | ||||||
| Sequential Growth (%) | |||||||||||||||||||||||
| Revenue | 10% | 42% | 16% | 8% | 7% | 18% | 27% | 1% | -1% | 3% | 17% | -13% | -13% | 44% | 32% | 94% | 69% | 39% | 39% | ||||
| Gross Profit | 26% | 69% | 21% | 10% | 16% | 19% | 41% | 2% | 3% | 2% | 5% | -23% | -7% | 69% | 29% | 157% | 108% | 48% | 48% | ||||
| EBIT | 42% | 80% | 22% | 9% | 20% | 20% | 45% | 2% | -10% | 5% | 5% | -37% | -5% | 134% | 30% | 212% | 122% | 52% | 52% | ||||
| NetProfit | 16% | 103% | 20% | 16% | 10% | 27% | 41% | 3% | -5% | 1% | 6% | -33% | -35% | 216% | 31% | 206% | 120% | 51% | 51% | ||||
| EPS | 16% | 103% | 20% | 16% | 14% | 27% | 41% | 3% | -8% | -3% | 5% | -33% | -33% | 120% | 51% | 51% | 51% | 51% | 51% | 51% | 51% | 51% | 51% |
© 2026 Citigroup Inc. No redistribution without Citigroup's written permission.
Source: Citi Research Estimates, Company Reports
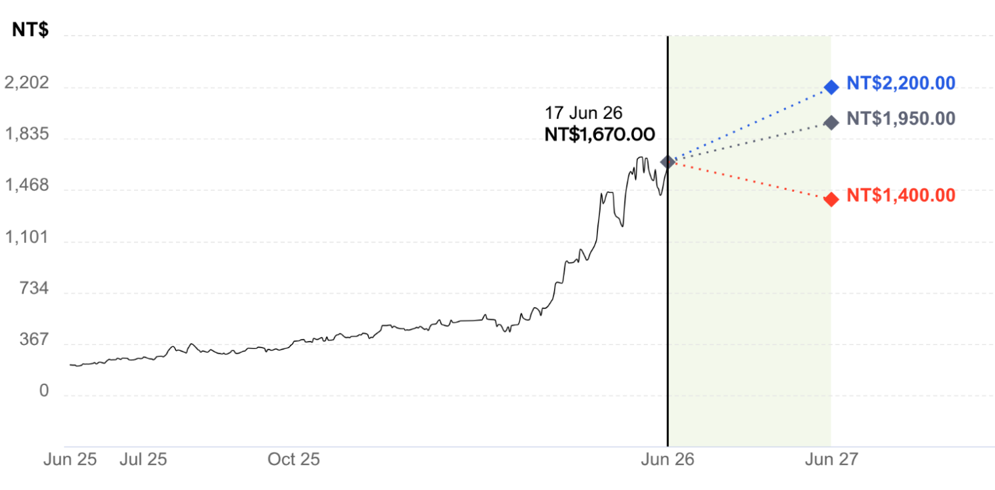
Adding Upside 30-Day Catalyst Watch on TUC (6274.TWO)
Direction:
Upside Within 30 Days
Duration:
Catalyst:
Earnings
We expect upcoming monthly sales or unaudited earnings, if released, would surprise to the upside.
NT$
2,202
1,835
1,468
1,101
734
367
0
Jun 25
4 32% Upside
NT$ 1,950.00
A 17% Upside
Bull/Bear: TUC (6274.TWO)
NT$1,670.00
NT$1,400.00
• 16% Downside
• Stronger-than-expected Al server/800G demand
BASE Assumptions
2nd supplier in Al ASIC customers' Al servers
• 800G entering into mass production industrywide
• CCL spec migration to M8 for Al ASIC servers or 800G switches
BEAR Assumptions
• Slower-than-expected CCL upgrade trend
• Weaker-than-expected Al server/800G demand
• Production bottlenecks in Al supply chain
TUC
Company description
TUC was established in 1974 and mainly produced optical glass initially. Since 1997, it started to provide copper clad laminate (CCL) and prepreg. Headquartered in Hsinchu, Taiwan, TUC has an extensive global service network spanning mainland China, Japan, Korea, the US and Germany. It has been specializing in high-speed CCL for networking and now has a strong position in supplying 800G switch opportunities. The company also started to supply AI ASIC from 2025.
Investment strategy
We expect increasing AI ASIC exposure for TUC as it continues to see new project opportunities among US CSP customers, including the high-end CCL market for Trainium chip. We like TUC as it has production expertise in highspeed CCL products, especially in networking, such as 800G, and has long built solid relationships with upstream high-end materials suppliers to ensure raw material support. We rate TUC a Buy given meaningful 800G ramp from 2026E onwards and its increasing opportunities in AI projects within CSPs and enterprise players.
Valuation
Our target price for TUC is set at NT$1,950, based on a target PE multiple of 25x on our 2027E EPS. We believe our target PE multiple, at the peak of TUC's PE average in the last upcycle, is justified by its strong margin expansion potential on a higher sales mix from AI ASIC server/800G products and price hikes on supply tightness. We believe TUC's growth outlook is well supported by AI ASIC and 800G with its capacity ramp in Thailand from 2Q26 onward. At our target price, the shares would trade at 2026E/27E PB of 19.4x/10.8x.
Risks
Citi's quant system rates TUC High Risk given high share price volatility, which we largely attribute to frequent debates over the spec upgrade for next-gen AI servers. In general, we believe some investors initially tend to have high hope for aggressive spec upgrade without sufficiently considering the scalability and cost structure of CCL products, which then leads to a shortfall in the end. However, from a longer-term perspective, we see a decent and clear spec upgrade trend with meaningful ASP growth potential among AI servers of different generations. As such, we do not assign a High Risk rating.
Key downside risks that could prevent the shares from reaching our target price include: 1) a slower-than-expected CCL upgrade trend; 2) weaker-thanexpected AI server/800G demand; 3) production bottlenecks in AI supply chain (e.g., glass, copper foil, foundry, or OSAT); 4) unexpected share loss in key AI server projects; 5) flexible practice of OOC policy by end customers; and 6) slow development of the PCB industry in Southeast Asia.
Analyst: Jack Chen
Date
Date
TWD
2,000
1,500
1,000
500
If you are visually impaired and would like to speak to a Citi representative regarding the details of the graphics in this document, please call USA 1-888-500-5008 (TTY: 711), from outside the US +1-210-677-3788
Appendix A-1
圖片清單(已驗證 2026-07-02)
回補驗證:僅涵蓋已被 lib 頁嵌入的圖片,非全量驗證。
| 檔名 | size | 分類 | 親眼所見內容 |
|---|---|---|---|
260617_citi_TUC_001.png |
16019 bytes | 真資料圖 | 股價走勢折線圖,Y軸TWD(0~1750),X軸Jun/Sep/Dec/Mar跨兩年區間 |
260617_citi_TUC_002.png |
135836 bytes | 真資料圖 | 左圖「Figure 2. TUC – 12M Forward P/E Band」、右圖「Figure 3. TUC – 12M Forward P/B Band」,皆為股價疊加多條估值倍數帶狀線,附Citi Research來源標示 |
260617_citi_TUC_003.png |
63814 bytes | 真資料圖 | 股價歷史折線圖標註「17 Jun 26 NT$1,670.00」,右側延伸三條目標價情境虛線分別指向NT$2,200.00(藍)/NT$1,950.00(灰)/NT$1,400.00(紅) |