PDF 原檔:2606052308_台達電_gs_delta_original.pdf
原始內容
Delta Electronics (2308.TW)
Accelerating pricing per watt for new AI products + faster than expected HVDC power rack contribution in 2027-28; Reiterate Buy with new NT$4,500 TP (from NT$2,420)
2308.TW
12m Pri c e Target:
NT$4,500.00
Pri c e:
NT$2,425.00
Upside:
85.6%
We reiterate our Buy rating on Delta, and raise our 12-m TP from
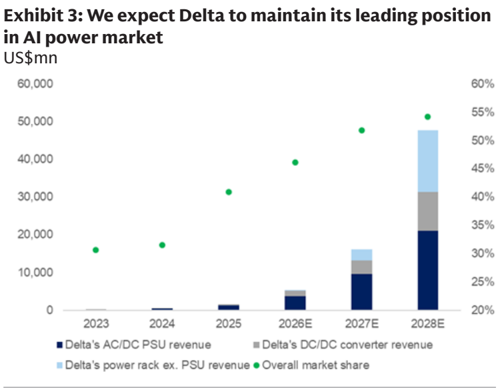
NT$2,420 to NT$4,500 (implying 96% upside) to re fl ect better visibility on the long-term growth opportunity for AI power products ( we expect Delta's overall AI power revenue, including AC/DC PSU+ DC/DC converter + Power rack ex. PSU, to go up by 210% 2025-28E CAGR ), whose pro fi tability should remain at a high level in coming years (we believe 50-60%+ for component level products), and the company's stable industry leadership position, based on our BOM cost analysis (Exhibit 4).
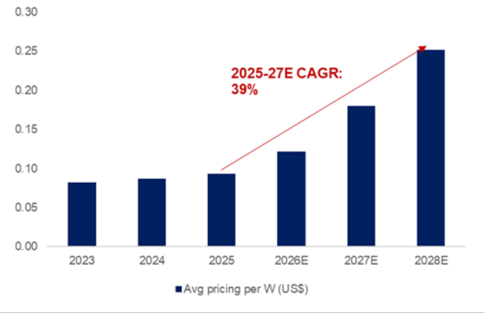
Our key fi nding in this report is that we see the AI PSU BOM cost per watt going up with higher power density (43% higher BOM per watt from 5.5kW PSU to 12kW PSU), which basically suggests a higher ASP per watt for Delta in coming years (we expect overall AI PSU industry ASP per watt will grow at a 40% 2025-28E CAGR), as the semiconductor and passive components will all continue to be upgraded. Moreover, given the adoption of new AI Power Rack will start from late 2026 (with accelerating demand YTD), we expect a new spec of 18.3kW PSU demand to ramp up quickly, which, based on our understanding, has a similar BOM / watt as the 5.5kW product; however, the high wattage requirement still suggests a high ASP/GM for Delta.
Moreover, the adoption of power rack (+-400V / 800V) from late 2026 will not only bene fi t Delta with 100% redundancy on PSU (vs. current power shelf solution redundancy ratio at 40-60%), it should also lead to a better DC/DC content for Delta, which in module level Delta has a dominant share. We now expect the AI DC/DC converter market should see a 142% 2025-28E CAGR, while contributing to Delta's 2026/27/28E revenue by 5%/9%/14% with 40%+ OPM, or 12/16/20% OPI contribution in 2026/27/28,
Overall, we revise up Delta's 2026/27/28E earnings estimate by 1/5/24/% to better re fl ect the solid demand uptrend from the
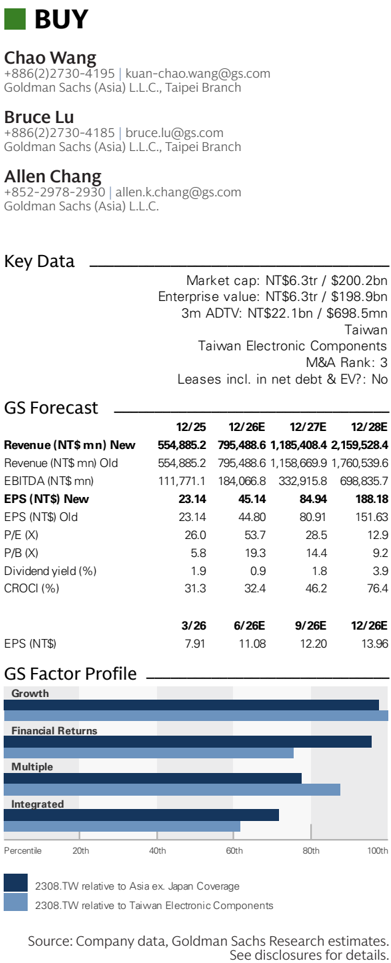
Goldman Sachs does and seeks to do business with companies covered in its research reports. As a result, investors should be aware that the fi rm may have a con fl ict of interest that could a ff ect the objectivity of this report. Investors should consider this report as only a single factor in making their investment decision. For Reg AC certi fi cation and other important disclosures, see the Disclosure Appendix, or go to www.gs.com/research/hedge.html. Analysts employed by non-US a ffi liates are not registered/quali fi ed as research analysts with FINRA in the U.S.
Key Data _____________________________________
Market cap: NT$6.3tr / $200.2bn
Enterprise value: NT$6.3tr / $198.9bn
3m ADTV: NT$22.1bn / $698.5mn
Taiwan
Taiwan Electronic Components
M&A Rank: 3
Leases incl. in net debt & EV?: No
| GS Forecast | 12/25 | __________ 12/26E | 12/27E | 12/28E |
|---|---|---|---|---|
| Revenue(NT$mn) New | 554,885.2 | 795,488.6 | 1,185,408.4 | 2,159,528.4 |
| Revenue (NT$ mn) Old | 554,885.2 | 795,488.6 | 1,158,669.9 | 1,760,539.6 |
| EBITD A (NT$ mn) | 111,771.1 | 184,066.8 | 332,915.8 | 698,835.7 |
| EPS(NT$) New | 23.14 | 45.14 | 84.94 | 188.18 |
| EPS (NT$) Old | 23.14 | 44.80 | 80.91 | 151.63 |
| P/E (X) | 26.0 | 53.7 | 28.5 | 12.9 |
| P/B (X) | 5.8 | 19.3 | 14.4 | 9.2 |
| Dividend yield (%) | 1.9 | 0.9 | 1.8 | 3.9 |
| CROCI (%) | 31.3 | 32.4 | 46.2 | 76.4 |
| 3/26 | 6/26E | 9/26E | 12/26E | |
| EPS (NT$) | 7.91 | 11.08 | 12.20 | 13.96 |
e92c7a75ab8b4efbba794e6b187208c8
BUY
Delta Electronics (2308.TW)
Rating since Oct 24, 2018
Ratios & Valuation __________________________________________
| 12/25 | 12/26E | 12/27E | 12/28E | |
|---|---|---|---|---|
| P/E (X) | 26.0 | 53.7 | 28.5 | 12.9 |
| P/B (X) | 5.8 | 19.3 | 14.4 | 9.2 |
| FCF y i eld (%) | 3.2 | 0.2 | 1.6 | 3.5 |
| EV/EBITD A R(X) | 13.4 | 34.0 | 18.7 | 8.8 |
| EV/EBITD A (excl. leases) (X) | 13.4 | 34.0 | 18.7 | 8.8 |
| CROCI (%) | 31.3 | 32.4 | 46.2 | 76.4 |
| ROE (%) | 24.1 | 39.4 | 57.8 | 87.4 |
| Net debt/equ i ty (%) | (39.2) | (27.5) | (29.2) | (33.5) |
| Net debt/equ i ty (excl. leases) (%) | (39.2) | (27.5) | (29.2) | (33.5) |
| I n te r est c ov e r (X) | 39.3 | 47.2 | 45.4 | 66.2 |
| Days inv e n t or y o utst , sales | 61.0 | 53.9 | 49.3 | 43.2 |
| Rece iv able days | 71.4 | 68.7 | 66.8 | 62.0 |
| Days p ayable o utsta n d ing | 81.9 | 67.9 | 55.7 | 51.2 |
| DuP on t ROE (%) | 18.5 | 29.8 | 42.6 | 62.1 |
| Tu rnov e r (X) | 0.9 | 1.0 | 1.2 | 1.4 |
| L e v e r a g e (X) | 2.0 | 2.0 | 2.0 | 2.0 |
| Gro ss cas h inv ested (ex cas h ) (NT $ ) | 402 , 630.9 | 513 , 143.3 | 620 , 646.1 | 808 , 236.8 |
| Av e r a g e ca pi tal e mp l o yed (NT $ ) | 196 , 978.7 | 241 , 547.3 | 325 , 888.1 | 445 , 018.0 |
| BVP S (NT $ ) | 103.20 | 125.77 | 168.24 | 262.33 |
Growth & Margins (%) ______________________________________
| 12/25 | 12/26E | 12/27E | 12/28E | |
|---|---|---|---|---|
| Total revenue growth | 31.8 | 43.4 | 49 | 82.2 |
| EBITDA growth | 53.8 | 64.7 | 80.9 | 109.9 |
| EPS growth | 70.6 | 95.1 | 88.2 | 121.5 |
| DPS growth | 65.7 | 94.6 | 88.2 | 121.5 |
| EBIT margin | 15.1 | 20.3 | 25.9 | 31 |
| EBITDA margin | 20.1 | 23.1 | 28.1 | 32.4 |
| Net income margin | 10.8 | 14.7 | 18.6 | 22.6 |
3m
93.2%
38.9%
6m
142.7%
12m
523.4%
47.7%
195.0%
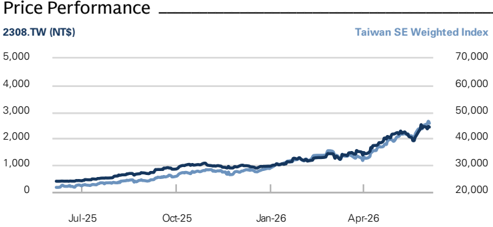
Source: FactSet. Price as of 4 Jun 2026 close.
Absolute
Rel. to the Ta
i
wan SE We
i
ghted Index
Income Statement (NT$ mn) ________________________________
Cash Flow (NT$ mn) ________________________________________
| 12/25 | 12/26E | 12/27E | 12/28E | |
|---|---|---|---|---|
| Tota l r e v e nu e | 55 4,885.2 | 795,488.6 | 1,185,408.4 | 2,159,528.4 |
| Co s t of good s s old | (364,728.6) | (486,983.2) | (682,389.2) | (1,184,755.9) |
| SG&A | (57,481.8) | (77,320.0) | (98,566.4) | (146,079.0) |
| R&D | (48,742.7) | (69,985.6) | (98,003.9) | (160,224.6) |
| Other operating inc./(exp.) | -- | -- | -- | -- |
| E BITDA | 111 , 771 . 1 | 18 4,0 66 . 8 | 33 2 ,9 15 . 8 | 6 9 8 , 8 3 5 . 7 |
| Depreciation& amortization | (27,839.1) | (22,866.9) | (26,466.9) | (30,366.9) |
| E BIT | 8 3,93 2 . 1 | 161 , 1 99.9 | 30 6 ,44 8 .9 | 668 ,4 68 .9 |
| Net intere s t inc./(exp.) | 1,578.5 | 1,369.8 | (1,165.7) | (1,709.5) |
| Income/(lo ss ) from a ss ociate s | 0.0 | -- | -- | -- |
| Pre-tax pro fi t | 87 , 866 .0 | 16 4, 625 .4 | 30 6 ,44 8 .9 | 668 ,4 68 .9 |
| Provi s ion for taxe s | (19,929.7) | (37,970.8) | (71,762.6) | (154,297.1) |
| Minority intere s t | (7,827.9) | (9,408.9) | (14,047.4) | (25,358.5) |
| Preferred dividend s | -- | -- | -- | -- |
| N et inc . ( pre-ex c ept i o n a ls) | 6 0, 1 0 8 .4 | 117 , 2 4 5 . 7 | 22 0, 6 3 8 .9 | 4 88 , 81 3.3 |
| Po s t-tax exceptional s | -- | -- | -- | -- |
| N et inc . ( po s t-ex c ept i o n a ls) | 6 0, 1 0 8 .4 | 117 , 2 4 5 . 7 | 22 0, 6 3 8 .9 | 4 88 , 81 3.3 |
| E P S(b a sic , pre-ex c ept ) (N T $) | 2 3. 1 4 | 4 5 . 1 4 | 8 4.94 | 188 . 18 |
| E P S(dilu te d , pre-ex c ept ) (N T $) | 2 3. 1 4 | 4 5 . 1 4 | 8 4.94 | 188 . 18 |
| E P S(b a sic , po s t-ex c ept ) (N T $) | 2 3. 1 4 | 4 5 . 1 4 | 8 4.94 | 188 . 18 |
| E P S(dilu te d , po s t-ex c ept ) (N T $) | 2 3. 1 4 | 4 5 . 1 4 | 8 4.94 | 188 . 18 |
| DPS (NT$) | 11.60 | 22.57 | 42.47 | 94.09 |
| Div. payout ratio (%) | 50.1 | 50.0 | 50.0 | 50.0 |
| Balance Sheet (NT$ mn) | 12/26E | ______ | 12/28E | |
| C a sh& c a sh equiv a lents | 12/25 151,172.2 | 176,558.5 174,353.7 | 12/27E 264,889.4 | 422,430.6 473,321.3 |
| Accounts receiv a ble | 125,020.2 | 259,815.5 | ||
| Inventory | 101,478.3 | 133,420.0 | 186,956.0 | 324,590.7 |
| Other current a ssets | 18,110.1 | 18,110.1 | 18,110.1 | 18,110.1 |
| Total current assets | 39 5,78 0. 8 | 5 0 2, 44 2 .3 | 72 9 ,771 .0 | 1,2 3 8, 4 52 . 7 |
| Net PP&E | 142,039.8 | 169,173.0 | 197,706.1 | 227,339.3 |
| Net int a ngibles | 75,326.3 | 75,326.3 | 75,326.3 | 75,326.3 |
| Tot a l investments | 4,876.2 | 4,876.2 | 4,876.2 | 4,876.2 |
| Other long-term a ssets | 21,595.5 | 21,595.5 | 21,595.5 | 21,595.5 |
| Total assets | 6 39 ,618 . 6 | 77 3 , 4 1 3.3 | 1, 0 2 9 ,275 . 1 | 1,567,5 90.0 |
| Accounts p a y a ble | 94,451.5 | 86,723.0 | 121,521.4 | 210,983.9 |
| Short-term debt | 2,364.1 | 2,364.1 | 2,364.1 | 2,364.1 |
| Short-term le a se li a bilities | -- 112,849.4 | -- | -- | -- |
| Other current li a bilities | 141,340.7 | 193,037.3 | 327,124.5 | |
| Total current liabilities | 2 09 ,665 .0 | 2 30 , 4 27 .9 | 3 16, 9 22 . 8 | 5 40 , 4 72 . 6 |
| Long-term debt | 21,142.6 | 66,142.6 | 111,142.6 | 156,142.6 |
| Long-term le a se li a bilities | -- | -- | -- | -- |
| Other long-term li a bilities | 83,422.0 | 83,422.0 | 83,422.0 | 83,422.0 |
| Total long-term liabilities | 1 04 ,56 4. 6 | 1 49 ,56 4. 6 | 1 94 ,56 4. 6 | 2 39 ,56 4. 6 |
| Total liabilities | 3 1 4 ,22 9. 6 | 3 7 9 , 99 2 . 5 | 511, 4 87 .4 | 78 0 , 03 7 . 2 |
| Preferred sh a res | 1.0 | 1.0 | 1.0 | 1.0 |
| Tot a l commonequity | 268,058.0 | 326,680.8 | 437,000.3 | 681,406.9 |
| Minority interest | 57, 33 1 .0 | 66,7 40.0 | 8 0 ,787 .4 | 1 0 6,1 4 5 . 8 |
| Total liabilities &equity | 6 39 ,618 . 6 | 77 3 , 4 1 3.3 | 1, 0 2 9 ,275 . 1 | 1,567,5 90.0 |
| Net debt, a djusted | (127,664.4) | (108,050.7) | (151,381.6) | (263,922.9) |
| 12/25 | 12/26E | 12/27E | 12/28E | |
|---|---|---|---|---|
| Net income | 60,108 . 4 | 117, 2 45 . 7 | 22 0,638 . 9 | 488,813 . 3 |
| D&Aadd-back | 2 7,839 . 1 | 22 ,866 . 9 | 2 6,466 . 9 | 30,366 . 9 |
| Minority interest add-back | 7,8 2 7 . 9 | 9,408 . 9 | 14,047 . 4 | 2 5,358 . 5 |
| Net (inc)/dec working capital | ( 2 4,348 . 1) | (89,003 . 7) | (104,199 . 4) | ( 2 61,677 . 9) |
| Other operating cash flow | 2 7,047 . 0 | -- | -- | -- |
| Cash flow fro m operations | 98 ,4 7 4. 3 | 6 0, 517 . 8 | 156 , 953 . 8 | 282 , 86 0. 7 |
| Capital expenditures | (46,091 . 3) | (50,000 . 0) | (55,000 . 0) | (60,000 . 0) |
| Acquisitions | (159 . 3) | -- | -- | -- |
| Divestitures | 141 . 8 | -- | -- | -- |
| Others | (7,105 . 4) | -- | -- | -- |
| Cash flow fro m investing | ( 53 , 21 4. 2 ) | ( 5 0,000.0) | ( 55 ,000.0) | ( 6 0,000.0) |
| Repayment of lease liabilities | -- | -- | -- | -- |
| Dividends paid(common& pref) | ( 2 0,31 2. 7) | (30,131 . 5) | (58,6 22. 9) | (110,319 . 5) |
| Inc/(dec) in debt | 84,439 . 4 | 45,000 . 0 | 45,000 . 0 | 45,000 . 0 |
| Other financing cash flows | (75,673 . 9) | 0 . 0 | 0 . 0 | 0 . 0 |
| Cash flow fro m financing | ( 11 , 5 4 7 . 2 ) | 1 4, 868 . 5 | ( 13 , 622 . 9 ) | ( 65 , 319 . 5 ) |
| Total cash flow | 33 , 712 . 9 | 25 , 386 . 3 | 88 , 33 0. 9 | 157 , 5 4 1 . 3 |
| Free cash flow | 5 2 ,383 . 0 | 10,517 . 8 | 101,953 . 8 | 222 ,860 . 7 |
Source: Company data, Goldman Sachs Research estimates.
e92c7a75ab8b4efbba794e6b187208c8
high-end/high margin AI projects (with better ASP/watt assumptions and higher redundancy assumptions, and the increasing demand on DC/DC converter due to +-400V/800V DC solution adoption). Our 2026/27/28E earnings is 19/50/95% higher than the Street, as we expect the high margin AI products contribution will continue to go up in coming years (from 9% in 2025 to 20/41/66% in 2026/27/28E), which should continue to drive the company's pro fi tability and earnings in coming years. Our new 12m TP is NT$4500 (from NT$2420), with 96% upside vs. today's close, with the revision due to our more positive view on the AI power products outlook so we rollover our valuation base from 2Q27-1Q28 to 2028 with the same target PE of 26.5x and discounted back to 2027 at a CoE of 11%.
Strong demand and pricing uptrend for 12kW PSU suggests better revenue and pro fi t outlook throughout 2026
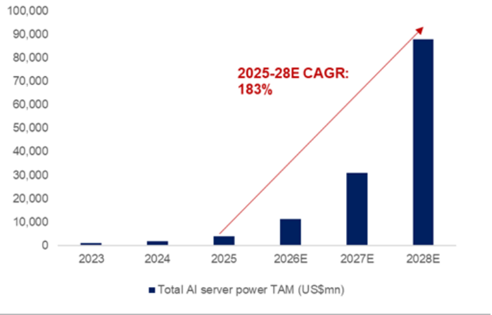
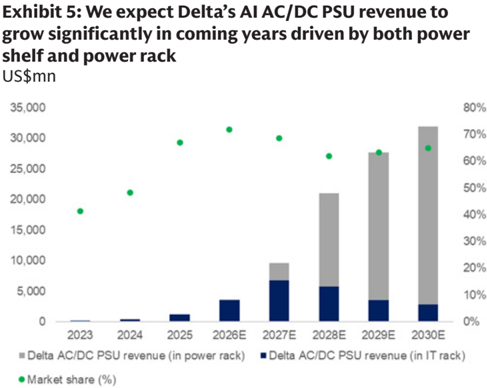
We expect Delta's overall AI power revenue (including AC/DC PSU+ DC/DC converter + Power rack ex. PSU) to go up by 210% 2025-28E CAGR, outpacing the overall market CAGR of 183%, driven by its leading market share position. The increasing product mix toward higher GM AI power revenue should support GM to reach 45% by 2028E from 34% in 2025 (Exhibit 1). We expect the following factors to drive the rising AI power contribution for Delta (to expand from 9% in 2025 to 66% in 2028E): (1) strong demand for 12kW AC/DC PSUs, supported by next gen GPU/ASIC, along with pricing uptrend, (2) incremental DC/DC content within IT racks, driven by the broader adoption of power rack, and (3) rapid scaling of power racks, with +10x CAGR over 2026-28E following initial shipment in 2H26.
e92c7a75ab8b4efbba794e6b187208c8
Illarket sildre
100,000
90,000
Al server power (USSmn)
80,000
TAM
70,000
Delta revenue
60,000
50,000
2023
928
Usemn
60,000
2024
50,000
1,864
587
2025
3,901
2026E
11,327
2027E
30,983
2028E
88,073
2025-28E CAR:
60%
50%
Exhibit 1: Delta's AI power revenue growth set to outpace overall AI server power market growth, driven by its leading market share 152 311 835 2,746 8,106 22,995 45%
40,000
Delta GM
AC/DC PSU
30,000
TAM
20,000
10,000
Delta revenue
Market share
Delta gross profit
Delta GM
DC/DC converter
TAM
Delta revenue
Market share
Delta gross profit
Delta GM
Power rack ex. PSU
TAM
Delta revenue
Market share
Delta gross profit
Delta GM
1,597
52%
5,222
53%
47,701
48%
183%
| 20,000 | • | |||||
|---|---|---|---|---|---|---|
| 10,000 | 30% | |||||
| 850 | 1,851 | 5,039 | 14,013 | 33,876 | 25% | |
| - | 409 | 1,239 | 3,622 - | 9,603 | 21,004 62% | 20% |
| 2023 2024 2025 2026E 2027E | 48% | 67% 2023 2024 | 72% 2025 | 69% 2026E | 2027E 2028E | |
| • Total Al server power TAM (US$mn) | 205 | 619 • Delta's AC/DC PSU revenue | 1,811 | 4,801 • Delta's DC/DC converter revenue | 10,502 50% | |
| 50% | 50% | 50% | 50% • Delta's power rack ex. PSU revenue • Overall market share | |||
| 2,050 | 28,945 | |||||
| 1,014 177 | 359 | 6,074 | 12,416 | |||
| 1,471 24% | 3,635 29% | 10,284 36% | ||||
| 18% 106 | 18% 215 | 883 | ||||
| 60% | 2,181 60% | 6,170 60% | ||||
| 60% | 60% | |||||
| 214 | 25,252 | |||||
| 129 | 4,554 | |||||
| 2,823 | 16,414 65% | |||||
| 0 | - 0 | 60% 53 | 62% | |||
| 1,124 | 6,323 39% | |||||
| 41% | 40% |
The PSU within the power rack is classi fi ed under AC/DC PSU, thus excluded from power rack
Source: Goldman Sachs Global Investment Research
Exhibit 2: We expect the AI power TAM will grow by 183% 2025-38E CAGR
Source: Company data, Goldman Sachs Global Investment Research
Source: Company data, Goldman Sachs Global Investment Research
For AC/DC PSU, the adoption of 12kW PSU is expected to accelerate in 2H26, and we expect Delta to maintain a leading market share. The transitioning from 5.5kW to 12kW PSU is likely to be mainly driven by Nvidia's Vera Rubin to be released in 2H26, followed by more ASIC adoption due to the rising TDP. We continue to see solid demand for Delta's new 12kW PSU from 2026 as the company's AI PSU order lead time remains long at 4-8 months. Overall, we expect Delta's AC/DC PSU business (5.5kW+ PSU) to grow by 192/165/119% YoY in 2026/27/28E (from NT$37bn in 2025 to NT$109/288/630bn in 2026/27/28E) and account for 14/24/29% of total revenue in
284
54%
40,000
53%
35%
16,061
50%
e92c7a75ab8b4efbba794e6b187208c8
Per PSU (5.5KW, 1U)
Magnetics (transformer, inductors)
PCB
Thermal (fans, heatsink)
Control ICs
Assembly
Others (connectors, chassis)
Total BOM per PSU
PSU ASP (assuming 50% GM)
BOM per kW
ASP per kW
Per power shelf (33KW, 1U)
PSU x 6
Connector (AC input, DC output)
Chassis
PMM (power management module)
Assembly
Rail kit
Others
Total BOM per power shelf
BOM (%) Total value
45%
150
12%
9%
40
30
Per PSU (12kW, 1U)
Power semiconductors (GaN, SiC, Si)
Capacitors (electrolytic, ceramic, etc)
Magnetics (transformer, inductors)
BOM (%) Total value
9%
90
2026/27/28E (up from 7% in 2025), maintaining its leading market share (+60% from 2026-28E). With our expectation that PSU GM will remain above the corporate average, the ramp up of next-gen PSUs should drive a higher contribution to gross pro fi t, accounting for 18/29/32% of total gross pro fi t in 2026/27/28E (up from 10% in 2025).
We expect ASP/BOM per watt for 12kW to increase by 43% vs. 5.5kW, driven by spec upgrades and rising component cost. We believe the increase in BOM per watt of 43% for 12kW PSU vs. 5.5kW PSU is mainly driven by signi fi cant content value increase and price increase for both power semiconductors (+2x) and capacitors (+3x), resulting in both components accounting for higher % of the BOM in the 12kW PSU (Exhibit 4). We assume a broadly stable competition landscape for 12kW PSU vs. 5.5kW PSU, thus expect Delta to maintain stable GM at 50%, which results in ASP per watt increase of a similar range of 43%. Others 1% 50
2,310
Total BOM per power shelf
cant increase in ASP per kW
Exhibit 4: PSU cost structure, 12kW PSU to see signi fi USD 140 ASP per kW
6,660
13,320
93
185
Source: Goldman Sachs Global Investment Research
Furthermore, based on our supply chain check, we believe the pricing for power semiconductors and capacitors used in the AI PSU will continue to rise, which would further drive Delta's PSU ASP in coming quarters, as the company is capable of passing through the additional costs to customer due to its strong pricing power based on the company's leading industry position.
Moreover, based on historical experience, if power semiconductors enter supply shortage, Delta is well-positioned in terms of supply security. This is supported by its leading market position in the AI PSU market (70%+ market share in 2026E per GSe). Being the single largest customer for key global power semiconductor suppliers, we believe the strength of Delta's procurement will help it maintain and potentially expand market share, further seeing better product pricing/GM with potential pricing hike opportunities, like we previously saw in 2022 (see here).
e92c7a75ab8b4efbba794e6b187208c8
and merencing) will consume more power in commo years
35,000
4,000
30,000
3,500
25,000
3,000
20,000
2,500
15,000
2,000
10,000
1,500
5,000
1,000
500
2023
• Delta AC/DC PSU revenue (in power rack) |
• Market share (%)
80%
70%
60%
50%
60,000
0.30
50,000
0.25
40,000
0.20
10,000
2023
2023
• Avg pricing per W (US$)
Source: Company data, Goldman Sachs Global Investment Research
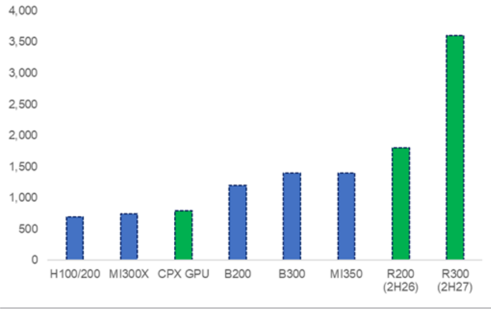
Exhibit 7: We expect the new AI GPUs (including training and inferencing) will consume more power in coming years
Source: Company data, Goldman Sachs Global Investment Research
2025-30E CAGR:
93%
0.30
0.20
2025-27E CAGR:
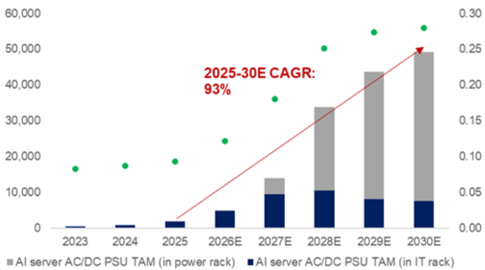
Exhibit 6: We expect the AI AC/DC PSU TAM will grow by 93% 2025-30E CAGR US$mn 0.10
0.05
Source: Company data, Goldman Sachs Global Investment Research
Exhibit 8: We believe AI AC/DC PSU ASP per W will grow by 39% 2025-28E CAGR
Source: Company data, Goldman Sachs Global Investment Research
Power rack contribution to start earlier in 2H26, and will be the key growth driver throughout 2027-30
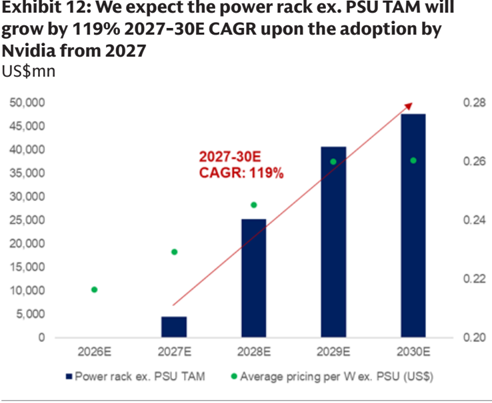
For power rack, CSPs are aggressive on early adoption, but we expect the ramp-up to be primarily driven by Nvidia, which would further support growth throughout 2027-2030, and we expect power rack ex. PSU TAM to grow by 119% 2027-30E
CAGR. We are seeing a faster than expected HVDC power rack demand as some CSPs have aggressive time schedules for HVDC deployment and are more wiling to adopt the new power architecture. We believe the new HVDC power rack will see mass volume shipment starting from 1H27, driven by Nvidia's adoption in the Kyber rack structure. Power racks have higher ASP per watt of US$0.5, of which AC/DC PSUs account for US$0.2, while other components contribute US$0.3 (vs. US$0.1 under the current AC/DC PSUs in IT rack structure, Exhibit 9), with the sharp increase in ASP mainly driven by additional contents, including BBU (battery backup unit) shelf, super capacitor shelf, etc.
We are positive on the penetration of power rack throughout 2027-30E, mainly due to (1) lower transition loss of power rack to support CSPs' e ff orts to reduce energy consumption and lower total cost of ownership, and (2) better scalability for future
•
e92c7a75ab8b4efbba794e6b187208c8
ruwel lacn
HVDC power rack for 880kW BOM (%)
57%
Total value
199,920
Gray space
Datacenter Infra
3%
19%
15%
3%
3%
ATS
10,560
Power rack (800VDC)
racks, as we expect the current 54V standard will become a bottleneck when AI server shifts from kW level to mW level. We forecast the overall power rack penetration to increase to 60% by 2030E from 11% in 2027E. We expect Delta to maintain a leading market share of 60%+ in power racks throughout 2027-30E, supported by its strong vertical integration capabilities, and to potentially gain additional share in power rack AC/DC PSUs, given its leading position in AC to DC technology. PSU (48V to 12V)
White space
PSU
We expect Delta's power rack ex. PSU business (we assume PSU within power racks are recognized in power electronics while the remaining is recognized in infrastructure) to grow by ~20x/~5x YoY in 2027/28E (from NT$4bn in 2026 to NT$89/495bn in 2027/28E) and account for 7/23% of total revenue in 2027/28E (up from <1% in 2026). Despite a relatively lower GM vs. the company's average AI power component, but still higher than overall GM of 32% in 2025. We believe related products will account for <1%/7%/19% of total gross pro fi t in 2026/27/28E. AC/DC)
Exhibit 9: Power rack to see signi fi cant increase in content value
USD
Source: Goldman Sachs Global Investment Research
Exhibit 10: The new power rack architecture will drive up the ASP per watt due to more additional content within the power rack
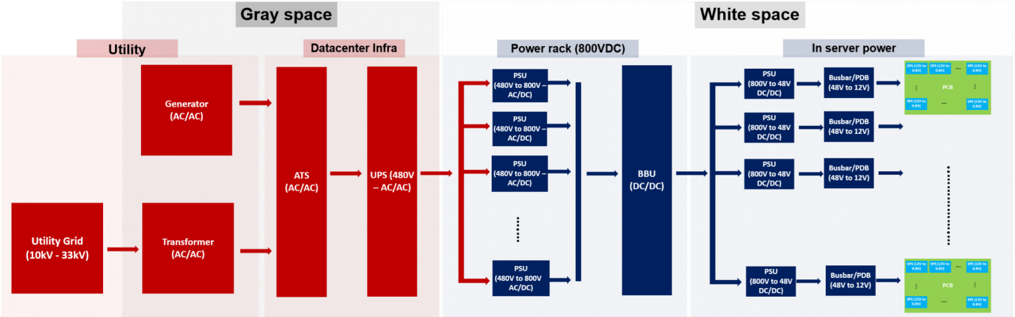
Red: Non-Delta products (power infrastructure) Light Blue: Non-Delta products (Power IC) *Blue: Delta products
Source: Company data, Goldman Sachs Global Investment Research
PDU
Utility
BBU shelf
Supercapacitor shelf
Rack bus bar
Rack
Total
Power rack ASP (assuming 20% GM)
BOM per kW
ASP per kW
Utility Grid
(10kV - 33kV)
Generator
(AC/AC)
Transformer
(AC/AC)
-
e92c7a75ab8b4efbba794e6b187208c8
Copill
Usemn
35,000
18000
16000
30,000
14000
25,000
12000
20,000
10000
15,000
8000
10,000
6000
5,000
4000
2000
2023
Usemn
50,000
45,000
45,000
40,000
40,000
35,000
35,000
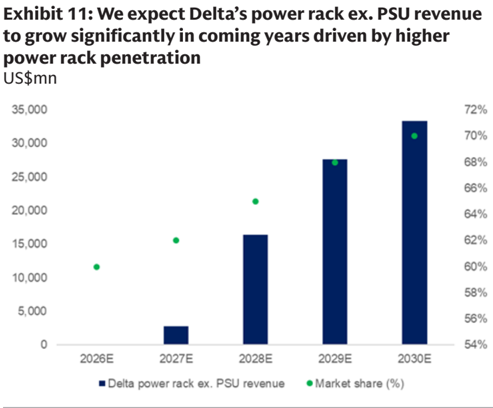
Source: Company data, Goldman Sachs Global Investment Research
2027-30E
CAGR: 119%
0.28
0.45
0.35
0.26
2023
•Busbar/PDB =V-core
Source: Company data, Goldman Sachs Global Investment Research
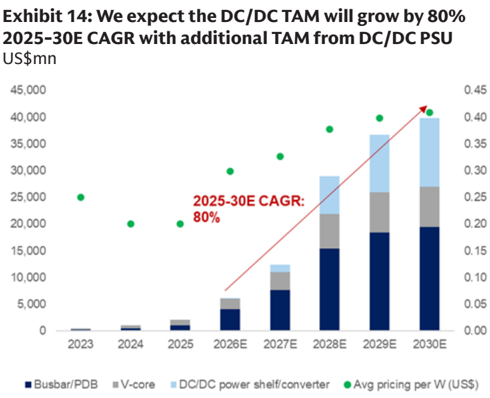
For DC/DC converter, the additional DC/DC PSUs should grow along with power rack, and we assume Delta to maintain similar market share. Under the HVDC architecture, PSU is split into two sections, AC/DC PSU within power rack for AC to 800VDC conversion and DC/DC PSU within IT rack for DC step down, this would suggest a better DC/DC content for Delta, and we expect the DC/DC PSU to see similar market share as power rack. Overall, we expect Delta's DC/DC converter business to grow by 310/147/183% YoY in 2026/27/28E (from NT$11bn in 2025 to NT$44/109/308bn in 2026/27/28E) and account for 6/9/14% of total revenue in 2026/27/28E (up from 2% in 2025) while expanding market share to reach 46% in 2028E from 35% in 2025. With DC/DC converter GM set to remain above the corporate average, we expect the ramp up of DC/DC PSU along with power rack will drive a higher contribution to gross pro fi t, accounting for 9/13/19% of total gross pro fi t in 2026/27/28E (up from 3% in 2025).
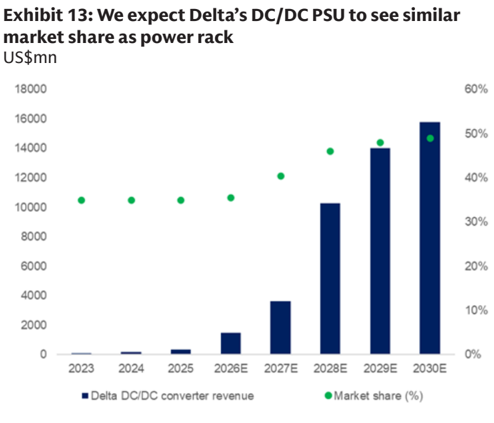
Source: Company data, Goldman Sachs Global Investment Research
Source: Company data, Goldman Sachs Global Investment Research
•
72%
60%
70%
50%
68%
66%
e92c7a75ab8b4efbba794e6b187208c8
Exmolt 10. Our numbers vs. bloombers consensus
Delta P&L (NT$ mn)
Sales
Gross Profit
EBIT
Revenue
Net Income
EPS (NT$).
Ratio analysis
2026E New
795,489
795,489
2026E
2026E Old
Consensus
Diff.
Diff (%)
795,489
743,938
308,505
161.200
2027E New
2027E
1,185,408
2027E Old
1,158,670
Consensus
503,019
GS est,
0%
7%
0%
1,185.408
1%
Diff.
Diff (%)
984,709
Earnings revision and where we stand vs. consensus
Net earnings
EPS, NT$
Gross margin
Gross margin (%)
EBIT margin
EBIT margin (%)
Net margin
Net margin (%)
117,246
45.14
38.8%
20.3%
98,617
38.8%
20.3%
........
14.7%
14.7%
Diff.
47%
24%
24%
82%
95%
95%
24%
96%
6.0ppt
0.1pp
0.3pp
2%
4%
20%
41%
5%
5%
5%
54%
50%
51%
6.1ppt
0.5p.p
0.6pp
84.94
292,463
485,937
210.156
146,782
42.4%
80.91
56.10
25.9%
2028E New
2028E
2,159,528
974.773
GS est,
2,159,528
1,470,951
974,773
668,469
488.813
393.854
535,647
668,469
488,813
188.18
188.18
31.0%
2028E Old
539.018
343,202
250,516
151.63
96.16
....
45.1%
30.6%
41.9%
25.2%
44.80
19%
220,639
Earnings revisions
36.3%
45.1%
45.1%
36.4%
We revise up our 2026/27/28E EPS by 1/5/24% to factor in higher ASP per watt for its AI PSU business and higher penetration for its power rack business (we raise up revenue estimates by 2/23% for 2027/28E). For the HVDC solution, we expect demand in late 2026 with faster progress from the +-400VDC solutions, and continue to expect stronger HVDC demand in 2027E/2028E. Therefore, we revise up our 2026/27/28E GM by 0.1/0.5/0.1ppt due to the slight margin expansion driven by better scale.
Exhibit 15: Earning revision table
Source: Company data, Goldman Sachs Global Investment Research
Where are we vs. consensus?
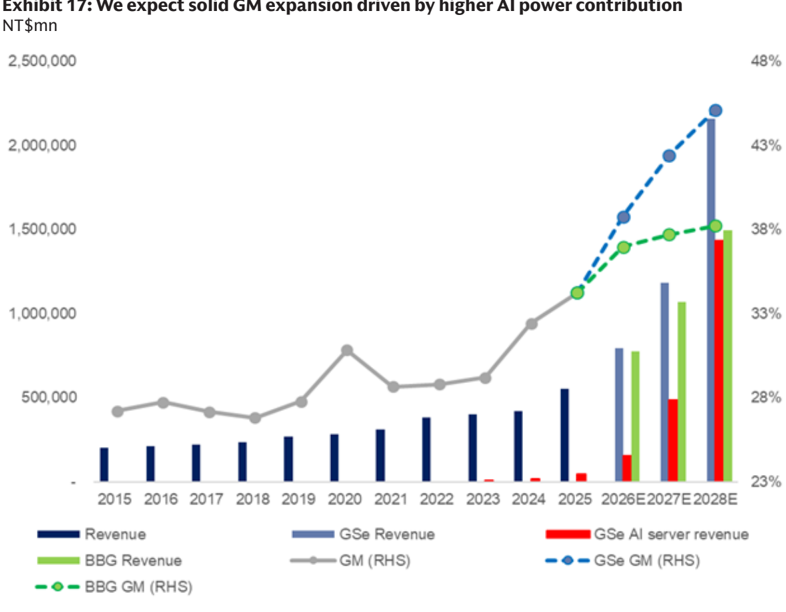
Our 2026/27/28E revenue estimates are 7/20/47% higher than Bloomberg consensus, due to our positive view on the AI power related business opportunity (we believe AI power revenue, including AC/DC, DC/DC and power rack products, will reach NT$156bn/NT$486bn/NT$1,434bn in 2026/27/28E). As such, considering our high estimate for Delta's AI power product GM at 50%, our 2026/27/28E GM estimate is 3.3/6.1/6.0ppt higher than Bloomberg consensus, as we believe the company's revenue will be mainly driven by AI power products in the coming years (20%/41%/66% revenue contribution in 2026/27/28E).
Exhibit 16: Our numbers vs. Bloomberg consensus
Source: Bloomberg, Goldman Sachs Global Investment Research
As shown in Exhibit 17, our GM estimates for Delta in 2027/28 are much higher than Bloomberg consensus, due to our more positive view on the GM expansion driven by AI server/datacenter power related products, which should continue to see increasing contribution to revenue in the coming years. We believe the market has been too conservative on estimating Delta's GM potential, given the fact that Delta has proven that its AI product revenue/GM is much higher than company average (GM improved
307,365
e92c7a75ab8b4efbba794e6b187208c8
Calvil 10. raL lavie
NTSmn
1Q25
Revenue
Gross profit
2,500,000
Operating expense
Operating income
Pretax income
Taxes expense
Net income
118.919
(23,752)
14,036
15,663
2,000,000
(3,620)
10,231
EPS, NTS
3.94
Ratio analysis and assumption
As % of sales
Gross margin
Operating expense ratio
Operating margin
1,500,000
Net margin
QoQ growth (%)
Revenue
Gross profit
Operating income
Net income
1,000,000
YoY growth (%)
Revenue
Gross profit
OPEX
Operating income
Net income
500,000
31.8%
20.0%
11.8%
8.6%
4%
8%
31%
43%
30%
40%
21%
90%
78%
2Q25
124.035
(25,380)
18,669
19,571
(4,237)
13,948
5.37
35.5%
20.5%
15.1%
11.2%
4%
17%
33%
36%
20%
25%
14%
42%
40%
3Q26E
216.549
84,059
(38,979)
45.080
45.330
4Q26E
226.524
90,781
(41,680)
49,100
49.350
48%
4Q27E
347.290
149,703
2024
421.148
136,580
(56,261)
93.442
93.442
2025
554.885
190,157
(106,224)
83,932
87.866
from 32.4% in 2024 to 34.3% in 2025), which was driven mainly by the expanding AI server power revenue. We note Bloomberg consensus only expect slow GM expansion in 2026/27/28, which we believe is too conservative, given the ongoing change in product mix leading to more high-margin AI server revenue contribution, as noted above. As a result, we expect an upward revision to consensus 2026/27 GM in the coming quarters, suggesting solid upside potential to the company's stock price. 19.2% 18.7% 18.0% 36.250 18.4% 16.0% 34.664 18.2% 15.7% 53.514 16.6% 19.1% 15.9% 67.846 16.2% 21.1% 8.4% 60.108 19.1% 117.246 18.5% 14.7% 16.6% 14.2% 22.6%
7%
59%
21%
147%
3Q25
150.318
52,416
(27,607)
24.809
26,983
(6,062)
18.606
7.16
34.9%
18.4%
16.5%
12.4%
21%
19%
33%
33%
34%
34%
21%
51%
51%
141%
11111
2015 2016 2017 2018 2019
- Revenue
• BBG Revenue
- • - BBG GM (RHS)
Exhibit 18: P&L table
Source: Company data, Goldman Sachs Global Investment Research
27%
5%
13%
8%
0%
31%
21%
4%
Source: Bloomberg, Company data, Goldman Sachs Global Investment Research
(88,928)
47,652
4Q25
161,613
55,903
(29,485)
26,418
1Q26
159.353
58,961
(30,544)
28,417
2Q26E
193.064
74,705
(36,103)
38.602
1Q27E
221.087
90,825
(40,238)
50.588
2Q27E
280.497
118,547
(46,563)
71,984
2026E
795.489
161.200
2027E
1.185.408
306,449
2028E
2,159,528
668,469
e92c7a75ab8b4efbba794e6b187208c8
Snowel
40x
35x
30x
25x
20x
15x
10x
5x
Jan-08
allu veici laustiy position
Valuation and risks - Raise TP to NT$4,500
+1 SD: 23.9x
45
40
35
30
EPS CAGR
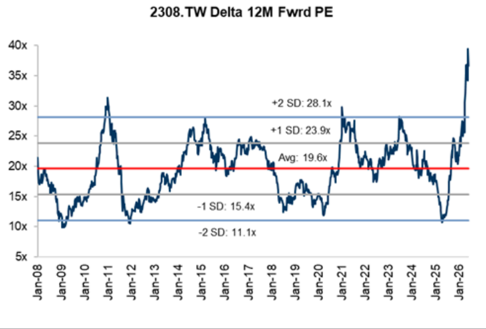
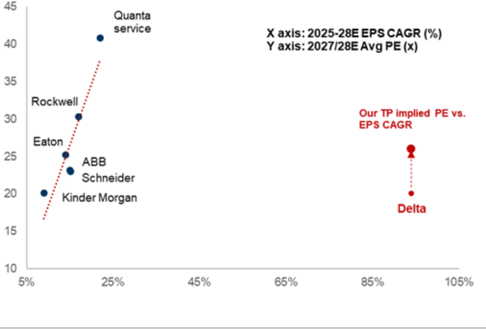
We reiterate our Buy rating on Delta with a new TP of NT$4,500 (from NT$2,420), implying 96% upside. We believe the company will continue to deliver a solid earnings growth rate (100%+ 2025-28E EPS CAGR) which is much faster than the company's historical average level (~10% CAGR in the past 20 years) and AI power industry peers (15% CAGR). 10 5% 25% 45% 65% 85% 105%
Our 12-month target price is based on an unchanged 26.5x P/E, and we roll over our valuation base from 2Q27-1Q28E to 2028E, discounted back to 2027 at a CoE of 11%, given the much improved visibility on HVDC power rack adoption timeline. The 26.5x P/E multiple is +1.6x STDC higher than Delta's past 15-year average valuation, and we believe Delta, as the key AI power product supplier with a solid market position (50%+ market share in coming years on GSe) should at least trade above historical valuation.
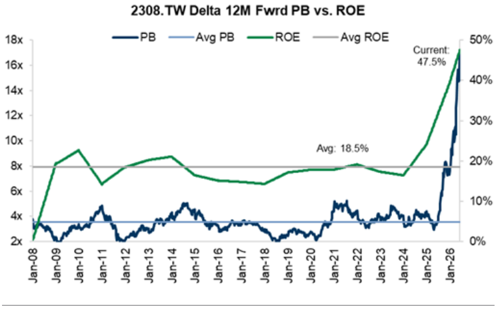
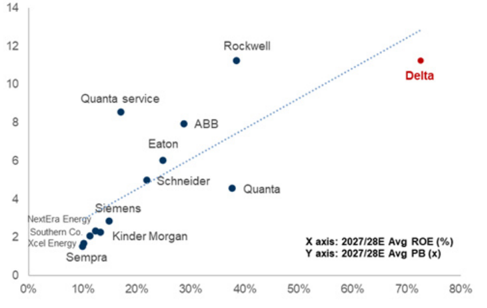
Our TP-implied 22.0x 2027-28E P/B is much higher than the company's average P/B multiple in the past (Exhibit 21); however, after considering the high ROE (increasing to 39%/58%/87% in 2026/27/28E based on GSe), we believe this higher implied multiple is justi fi ed as the company should be traded at a premium considering its accelerating expansion in ROE in coming years.
Exhibit 19: Delta continues to trade above its historical average level, which we attribute to its much faster EPS growth and better industry position
Source: Company data, Goldman Sachs Global Investment Research
Exhibit 20: We expect accelerating EPS growth for Delta in coming years
Source: Company data, Goldman Sachs Global Investment Research
3i1111
-1 SD: 15.4x
-2 SD: 11.1x
Rockwell
Quanta service
Our TP implied PE vs.
e92c7a75ab8b4efbba794e6b187208c8
18x
16x
14x
12x
10x
8x
6x
4x
2x
Jan-09
Current:
47.5%
50%
40%
Exhibit 21: Delta is trading at record high on P/B, supported by a solid ROE uptrend 30%
Avg: 18.5%
20%
wenvel a sond nor outrook l commo yeals
14
12
10
8
6
Source: Company data, Goldman Sachs Global Investment Research
Investment Thesis & PT methodology and risks
Delta Electronics is the largest vendor of power supply components globally (in terms of sales) and a key servo motor/inverter/PLC supplier in mainland China. It is also a key supplier for the EV/server power industry, holding one of the largest market shares in both markets. We are positive on Delta's long-term growth opportunity driven by multiple factors (EV/EV charger/5G infrastructure/Datacenter power/ESS etc.) in the coming years. We also expect demand for its AI server power and cooling systems to deliver solid growth given the increasing demand for high computing performance AI servers, which will require higher e ffi ciency power components and better cooling systems to improve the overall performance. Trading at a 1-year forward P/E multiple that is below our target multiple, we believe the stock is undervalued, given the company's strong revenue outlook (50%+ 2025-28E CAGR) for its growth sectors (including EV & EV charging / green capex & renewable energy / cloud computing / smart manufacturing / satellite communication & smart connectivity), and its leadership in the power component industry. We are Buy rated. Key downside risks include: (1) slower-than-expected AI server power consumption growth momentum, (2) potential market share loss risk in AI server DC-DC power system or the potential design change on AI server DC-DC system, and (3) slower than expected of future products deployment, including power rack, SST and SOFC.
Valuation methodology : We are Buy rated on Delta. Our 12m TP of NT$4,500 is based on a target P/E multiple of 26.5x (1.6x s.d. higher than Delta's past 15-year average valuation) applied to our 2028E EPS and discounted back to 2027 at a CoE of 11%.
Key downside risks: (1) slower-than-expected AI server power consumption growth momentum, (2) potential market share loss risk in AI server DC-DC power system or the potential design change on AI server DC-DC system, and (3) slower than expected of future products deployment, including power rack, SST and SOFC.
Rockwell
Delta
Exhibit 22: The high P/B is still below industry linear regression (vs. ROE), and we expect the company will deliver a solid ROE outlook in coming years
NexEra Energy Siémens
Xcel Energy ®
Southern Co. ∞ Kinder Morgan
Sempra
10%
Source: Company data, Goldman Sachs Global Investment Research e92c7a75ab8b4efbba794e6b187208c8
圖片清單(已驗證 2026-07-02)
回補驗證:僅涵蓋已被 lib 頁嵌入的圖片,非全量驗證。
| 檔名 | size | 分類 | 親眼所見內容 |
|---|---|---|---|
2606052308_台達電_gs_delta_001.png |
136KB | 真資料圖 | GS報告封面頁,左上綠色方塊「BUY」,列出分析師姓名(Chao Wang/Bruce Lu/Allen Chang)及聯絡方式,「Key Data」區塊列出市值/EV/3m ADTV等,「GS Forecast」表格列出12/25~12/28E的Revenue/EBITDA/EPS/P-E/P-B/殖利率/CROCI,下方「GS Factor Profile」橫向長條圖顯示Growth/Financial Returns/Multiple/Integrated四項百分位排名;圖中未顯示目標價數字 |
2606052308_台達電_gs_delta_003.png |
30KB | 真資料圖 | 長條圖,橫軸2023-2028E,縱軸0-100,000(US$mn),深藍柱為「Total AI server power TAM (US$mn)」,紅色箭頭標註「2025-28E CAGR: 183%」 |
2606052308_台達電_gs_delta_009.png |
136KB | 真資料圖 | 電源系統架構流程圖,左至右分區:Utility(電網10kV-33kV/Generator/Transformer)、Gray space(ATS/UPS 480V)、Power rack 800VDC(多組PSU 480V-800V AC/DC與BBU DC/DC)、White space/In server power(PSU 800V-48V DC/DC、Busbar/PDB 48V-12V、PCB),紅色箭頭連接各區塊;圖中未顯示任何美元/瓦數字 |
2606052308_台達電_gs_delta_016.png |
34KB | 真資料圖 | 散佈圖,X軸「2025-28E EPS CAGR (%)」,Y軸「2027/28E Avg PE (x)」,標示多家公司點位(Quanta service、Rockwell、Eaton、ABB、Schneider、Kinder Morgan)與紅色「Delta」點位(含「Our TP implied PE vs. EPS CAGR」標註,上下兩個紅點) |