PDF 原檔:報告_UBS_緯穎6669_20260717_original.pdf
圖片清單(已驗證 2026-07-20)
| 檔名 | size | 分類 | 親眼所見內容 |
|---|---|---|---|
260717_ubs_wiwynn_001.png |
40KB | 真資料圖 | 季度銷售額(NT$mn)依客戶別堆疊面積圖,Q118–Q126:Client A/Client B/Client C,近期 Client C 佔比明顯放大 |
260717_ubs_wiwynn_002.png |
36KB | 真資料圖 | 季度銷售額(NT$mn)依產品別堆疊面積圖,Q118–Q126:Others/GB 200/300 L11/AI server rack/General server rack,AI server rack 近期快速成長 |
260717_ubs_wiwynn_003.png |
54KB | 真資料圖 | 緯穎庫存金額(NT$mn 柱狀)與庫存天數(折線+虛線趨勢),Q217–Q126,2H25 起庫存明顯墊高(為 2H26 出貨備貨) |
260717_ubs_wiwynn_004.png |
60KB | 真資料圖 | 緯穎股價(面積圖)vs NTM P/E(折線)帶狀圖,May-19–2026,含平均 P/E 14x、+1SD 17x、-1SD 11x 參考線,目前落於區間低段 |
260717_ubs_wiwynn_005.png |
37KB | 真資料圖 | 淨現金(NT$mn 柱狀)與每股淨現金(NT$ 折線,右軸)年度圖,2014–2027E |
260717_ubs_wiwynn_006.png |
41KB | 真資料圖 | 緯穎股價(面積圖)vs FWD EPS(折線,右軸)走勢圖,May-19–2026,兩者同步快速上升 |
260717_ubs_wiwynn_007.png |
102KB | 真資料圖 | 股價 vs 目標價階梯圖(2023-04–2026-07),下方彩帶標示評等區間變化(No Rating/Neutral/Buy),目標價持續上調至圖右側高點 |
原始內容
First Read
Wiwynn
Q2 preview: Drivers approaching for another inflection
Solid execution as server demand offsets consignment transition
Wiwynn is our top ODM pick with catalysts for an inflection from ramping ASIC servers in H226E with the Trainium 3 ramp, Helios racks from late 2026E, and continued strong general server growth (60% of Q2 sales) into its top CSP accounts seeing rising agentic workloads. We also see better margin support after customers started consigning general server DRAM from April. Q2 sales were +1% QoQ, in line with UBS. Despite the transition of memory (c.30% of general server component costs) to a consignment model from April, robust general server units (>20% YoY) offset the headwind. Initial Trainium 3 shipments started initial mass production in June, while GB revenue faded out and should see limited NVIDIA orders until VR200 ramps. We model Q2 GM/OpM estimates at 8.4%/6.8%, up 80/50 bp QoQ, reflecting the positive impact from the memory consignment.
H226 revenue likely to accelerate on the ASIC ramp
We maintain our Q326 revenue growth forecast at +20% QoQ, reflecting a strong Trainium ramp and resilient general server demand that should continue through H226. We model GM/OpM at 8.6%/7.0%, as the benefit from lower memory pass-through in general servers is offset by a richer ASIC mix. We model a further 17% QoQ increase in Q426 from further ramp of Trainium servers. Full-year 2026 should grow +34% YoY, with general server shipments +30% YoY and Trainium to grow to over 50% of H226 sales.
2027 incremental sales from ASIC/GPU rack ramps
We raise our 2027 revenue growth forecast from 54% to 77% YoY, reflecting stronger AI contributions from both ASICs and GPUs. We raise AMD Helios rack shipments from 2k to 5k units, with Wiwynn expected to remain the main supplier to a leading CSP . We also raise our H226 and 2027 ASIC server forecasts following our recent Trainium shipment upgrade (link). We believe Vera Rubin should begin shipping in small volumes in Q426, with full-year shipments contributing ~2% of sales in 2027.
Raising EPS and lifting price target to NT$7,000
We reiterate our Buy rating and raise 2026/27E EPS from NT$350/NT$440 to NT$360/ NT500 reflecting faster ASIC ramp, stronger general server and GPU projects from Q4 into 2027. We raise our PT from NT$6,400 to NT$7,000 based on same 14x P/E on 2027E EPS also with 3% cash yield (NT$74 cash dividend). We maintain a positive view reflecting Wiwynn's leverage to ASIC servers, AMD racks, alongside healthy general server demand with next catalysts from AMD's Advancing AI on 22-23 July and Amazon's results due 30 July.
Equities
Taiwan
Electric Components & Equipment
| 12-month rating | Buy |
|---|---|
| 12m price target | NT$7,000.00 Prior : NT$6,400 |
| Price (17 Jul 2026) | NT$4,620 |
| RIC: 6669.TW BBG: 6669 TT |
Trading data and key metrics
| 52-wk range | NT$5,790.00-2,445.00 |
|---|---|
| Market cap. | NT$850b/US$26.3b |
| Shares o/s | 184m (ORD) |
| Free float | 43% |
| Avg. daily volume ('000) | 2,216 |
| Avg. daily value (m) | NT$11,025.9 |
| Common s/h equity (12/26E) | NT$162b |
| P/BV (12/26E) | 5.3x |
| Net debt to EBITDA (12/26E) | NM |
| EPS (UBS, | From diluted) | To (NT$) | %ch | Cons. |
|---|---|---|---|---|
| 12/26E | 350.43 | 356.74 | 2 | 345.23 |
| 12/27E | 440.16 | 500.32 | 14 | 466.1 |
| 12/28E | 503.6 | 583.09 | 16 | 555.87 |
Randy Abrams
Analyst randy.abrams@ubs.com +886-2-8722 7338
Diana Chang
Analyst diana.chang@ubs.com +886-2-8722 7335
Annie Chen
Associate Analyst annie.chen@ubs.com +886-2-8722 7281
| Highlights (NT$m) | 12/23 | 12/24 | 12/25 | 12/26E | 12/27E | 12/28E | 12/29E | 12/30E |
|---|---|---|---|---|---|---|---|---|
| Revenues | 241,901 | 360,541 | 950,663 | 1,277,671 | 2,258,697 | 2,762,162 | 3,125,398 | 3,635,348 |
| EBIT (UBS) | 15,871 | 28,099 | 63,918 | 86,891 | 122,106 | 143,142 | 160,261 | 181,589 |
| Net earnings (UBS) | 12,044 | 22,776 | 51,118 | 66,297 | 92,979 | 108,363 | 121,549 | 137,319 |
| EPS (UBS, diluted) (NT$) | 68.88 | 127.63 | 275.06 | 356.74 | 500.32 | 583.09 | 654.05 | 738.90 |
| DPS (net) (NT$) | 50.00 | 42.00 | 74.00 | 115.77 | 216.02 | 300.19 | 349.86 | 392.43 |
| Net (debt) / cash | 30,168 | 26,425 | 2,907 | 11,813 | 21,772 | 28,612 | 32,786 | 31,979 |
| Profitability/valuation | 12/23 | 12/24 | 12/25 | 12/26E | 12/27E | 12/28E | 12/29E | 12/30E |
| EBIT (UBS) margin% | 6.6 | 7.8 | 6.7 | 6.8 | 5.4 | 5.2 | 5.1 | 5.0 |
| ROIC (EBIT)% | 94.2 | 77.0 | 70.5 | 64.6 | 71.8 | 66.8 | 60.8 | 56.4 |
| EV/EBITDA (UBS core) x | 12.8 | 12.1 | 7.7 | 9.2 | 6.5 | 5.5 | 4.9 | 4.3 |
| P/E (UBS, diluted) x | 19.9 | 17.3 | 10.5 | 13.0 | 9.2 | 7.9 | 7.1 | 6.3 |
| Equity FCF (UBS) yield% | 7.6 | (6.5) | (2.7) | 4.4 | 3.7 | 7.0 | 7.9 | 8.1 |
| Dividend yield (net)% | 3.6 | 1.9 | 2.6 | 2.5 | 4.7 | 6.5 | 7.6 | 8.5 |
Source: Company accounts, LSEG Eikon, UBS estimates. Metrics marked as (UBS) have had analyst adjustments applied. Valuations: based on an average share price that year, (E): based on a share price of NT$ 4,620.00 on 17-Jul-2026
Figure 1: UBSe vs. VA Consensus Q226E and 2026-27E
| Q126 | Q226E | Q226E | Q226E | Q326E | Q326E | Q326E | 2025 | 2026E | 2026E | 2026E | 2027E | 2027E | 2027E | |
|---|---|---|---|---|---|---|---|---|---|---|---|---|---|---|
| (NT$m) | Actual | UBSe | UBSe prior | VA | UBSe | UBSe prior | VA | Actual | UBSe | UBSe prior | VA | UBSe | UBSe prior | VA |
| Revenue | 276,508 | 278,153 | 279,004 | 283,469 | 334,022 | 331,231 | 328,628 | 950,663 | 1,277,671 | 1,255,931 | 1,285,960 | 2,258,697 | 1,939,693 | 1,970,133 |
| - QoQ / YoY | -5.4% | 0.6% | 0.9% | 2.5% | 20.1% | 19.8% | 18.1% | 163.7% | 34.4% | 32.1% | 35.3% | 76.8% | 54.4% | 53.2% |
| Gross profit | 20,881 | 23,487 | 24,062 | 23,256 | 28,832 | 28,538 | 27,177 | 78,454 | 106,388 | 104,455 | 102,694 | 159,375 | 144,407 | 140,200 |
| - Gross margin | 7.6% | 8.4% | 8.6% | 8.2% | 8.6% | 8.6% | 8.3% | 8.3% | 8.3% | 8.3% | 8.0% | 7.1% | 7.4% | 7.1% |
| Operating profit | 17,458 | 18,953 | 19,040 | 19,138 | 23,320 | 22,907 | 22,554 | 63,918 | 86,891 | 84,472 | 85,003 | 122,106 | 106,680 | 113,529 |
| - OP margin | 6.3% | 6.8% | 6.8% | 6.8% | 7.0% | 6.9% | 6.9% | 6.7% | 6.8% | 6.7% | 6.6% | 5.4% | 5.5% | 5.8% |
| Non-op profit | 476 | -565 | -651 | -570 | -783 | -694 | -507 | 2,135 | -1,402 | -1,321 | -1230 | -3,231 | -2,305 | -2,073 |
| Pre-tax profit | 17,934 | 18,389 | 18,389 | 18,568 | 22,537 | 22,213 | 22,048 | 66,052 | 85,489 | 83,151 | 83,773 | 118,876 | 104,375 | 111,456 |
| Tax | -3,820 | -4,150 | -4,150 | -4,183 | -4,958 | -4,887 | -4,865 | -14,934 | -18,580 | -18,026 | -18,242 | -25,896 | -22,574 | -24,379 |
| - Tax rate | 21.3% | 22.6% | 22.6% | 22.5% | 22.0% | 22.0% | 22.1% | 22.6% | 21.7% | 21.7% | 21.8% | 21.8% | 21.6% | 21.9% |
| Net profit | 14,114 | 14,239 | 14,240 | 14,385 | 17,579 | 17,326 | 17,183 | 51,118 | 66,909 | 65,125 | 65,531 | 92,979 | 81,800 | 87,077 |
| EPS (NT$) | 75.95 | 76.62 | 76.62 | 76.84 | 94.59 | 93.23 | 92.58 | 275.06 | 360.03 | 350.43 | 352.43 | 500.32 | 440.16 | 455.82 |
Source: Company data, Visible Alpha, UBS estimates. Note: 2026E EPS shows reported number (pre-abnormal and goodwill).
Figure 2: Wiwynn revenue drivers
| Sales %by Product | Q126 | Q226E | Q326E | Q426E | Q127E | Q227E | Q327E | Q427E |
|---|---|---|---|---|---|---|---|---|
| ASIC server chips (k units) | 351.6 | 314.0 | 375.0 | 441.0 | 455.0 | 465.0 | 465.0 | 465.0 |
| ASIC server rack (k units) | 9.8 | 8.7 | 10.4 | 12.3 | 12.6 | 12.9 | 12.9 | 12.9 |
| ASIC server rack ASP (NT$k) | $12,385 | $12,747 | $15,284 | $16,512 | $16,515 | $16,516 | $16,516 | $16,681 |
| ASIC Server Revenue (NT$mn) | $120,964 | $111,179 | $159,206 | $202,272 | $208,727 | $213,338 | $213,338 | $215,459 |
| ASIC server (%) of total | 44% | 40% | 48% | 52% | 46% | 36% | 35% | 36% |
| General servers (k units) | 660.8 | 798.5 | 838.4 | 843.0 | 852.1 | 902.7 | 951.4 | 932.6 |
| General server rack (k units) | 17.4 | 21.0 | 22.1 | 22.2 | 22.4 | 23.8 | 25.0 | 24.5 |
| General server ASP (NT$k) | $8,632 | $7,768 | $7,768 | $8,007 | $8,022 | $8,013 | $8,009 | $8,008 |
| General Server Revenue (NT$mn) | $150,102 | $163,237 | $171,399 | $177,631 | $179,885 | $190,357 | $200,526 | $196,539 |
| General server (%) of total | 54% | 59% | 51% | 46% | 39% | 32% | 33% | 32% |
| NVIDIA Racks | 20.0 | 5.0 | 2.0 | 25.0 | 40.0 | 50.0 | 70.0 | 90.0 |
| AMD Racks | 10.0 | 500.0 | 1500.0 | 1500.0 | 1500.0 | |||
| GPU Racks | 20.0 | 5.0 | 2.0 | 35.0 | 540.0 | 1550.0 | 1570.0 | 1590.0 |
| Rack blended ASP (US$mn) | $4.0 | $4.0 | $4.0 | $5.4 | $4.0 | $3.9 | $3.9 | $3.9 |
| NT$/US$ | $31.6 | $31.8 | $31.8 | $31.0 | $30.6 | $30.6 | $30.6 | $30.6 |
| GPU AI server revenue (NT$mn) | $2,527 | $636 | $254 | $5,828 | $65,484 | $183,600 | $187,272 | $190,944 |
| GPU AI server (%) of total | 1% | 0% | 0% | 1% | 14% | 31% | 31% | 31% |
| Total Revenue (NT$mn) | $276,508 | $278,153 | $334,022 | $388,989 | $457,354 | $590,586 | $604,459 | $606,298 |
| AI mix (%) | 45% | 40% | 48% | 53% | 60% | 67% | 66% | 67% |
| Nvidia AI server revenue (NT$mn) | $2,527 | $636 | $254 | $4,650 | $7,344 | $9,180 | $12,852 | $16,524 |
| GPU AI server (%) of total | 1% | 0% | 0% | 1% | 2% | 2% | 2% | 3% |
| Storage and Other | $2,914 | $3,101 | $3,163 | $3,258 | $3,258 | $3,291 | $3,323 | $3,357 |
| Total Revenue (NT$mn) | $276,508 | $278,153 | $334,022 | $388,989 | $457,354 | $590,586 | $604,459 | $606,298 |
| QoQ (%) | -5% | 1% | 20% | 16% | 18% | 29% | 2% | 0% |
| YoY (%) | 62% | 26% | 25% | 33% | 65% | 112% | 81% | 56% |
| Sales %by Client | Q126 | Q226E | Q326E | Q426E | Q127E | Q227E | Q327E | Q427E |
| Revenue from Client A (B2B) | 18% | 19% | 17% | 15% | 13% | 11% | 11% | 10% |
| Revenue from Client B (Social) | 27% | 29% | 25% | 23% | 33% | 46% | 46% | 45% |
| Revenue from Client C (B2C) | 53% | 50% | 57% | 60% | 52% | 41% | 41% | 41% |
| Other Clients | 2% | 1% | 1% | 2% | 2% | 2% | 3% | 3% |
| Total Revenue (NT$mn) | 100% | 100% | 100% | 100% | 100% | 100% | 100% | 100% |
Source: Company data, UBS estimates
Figure 3: Wiwynn margin drivers
| Margin Drivers | Q126 | Q226E | Q326E | Q426E | Q127E | Q227E | Q327E | Q427E |
|---|---|---|---|---|---|---|---|---|
| General Server Revenue | $150,102 | $163,237 | $171,399 | $177,631 | $179,885 | $190,357 | $200,526 | $196,539 |
| AI Server Revenue | $120,964 | $111,179 | $159,206 | $202,272 | $208,727 | $213,338 | $213,338 | $215,459 |
| GB 200/300 NVL72 Revenue VR NVL144/576 Revenue AMD MI455/Helios Revenue | $2,527 | $636 | $254 | $4,650 $1,178 $3,258 | $7,344 $58,140 $3,258 | $9,180 $174,420 $3,291 | $12,852 $174,420 | $16,524 $174,420 |
| Storage/Other Revenue | $2,914 | $3,101 $278,153 | $3,163 $334,022 | $388,989 | $590,586 | $3,323 | $3,357 | |
| Total Revenue (NT$mn) | $276,508 | 1% | 20% | $457,354 | $604,459 | $606,298 | ||
| QoQ (%) YoY (%) | -5% 62% | 26% | 25% | 16% 33% | 18% 65% | 29% 112% | 2% 81% | 0% 56% |
| Gross Profit (NT$mn) | $20,881 | $23,487 | $28,832 | $33,189 | $35,606 | $40,610 | $41,632 | $41,526 |
| General Server RackGM% AI Server RackGM% | 7.5% 7.7% | 9.0% 7.7% | 9.4% 7.9% | 9.4% | 9.4% 7.9% | 9.4% 7.9% | 9.4% 7.9% | 9.4% 7.9% |
| GB 200/300 L11GM% | 2.8% | 2.8% | 2.8% | 8.0% | ||||
| VR NVL144/576GM% AMD MI455/HeliosGM% Storage/OtherGM% | 7.7% | 7.0% | 2.8% 3.4% 7.0% | 2.7% 3.1% | 2.7% 3.1% | 2.7% 3.1% | 2.7% 3.1% 6.5% | |
| Wiwynn BlendedGM% | 7.6% | 8.4% | 7.0% 8.6% | 8.5% | 6.5% 7.8% | 6.5% 6.9% | 6.5% 6.9% | 6.8% |
| Opex (NT$mn) | -$3,423 | -$4,534 | -$5,511 | -$6,029 | -$7,546 | -$9,745 | -$9,974 | -$10,004 |
| -1.6% | ||||||||
| Opex/Sales% | -1.2% | -1.7% | -1.6% | -1.7% | -1.7% | -1.7% | -1.7% | |
| Operating Profit (NT$mn) | $17,458 | $18,953 | $23,320 | $27,159 | $28,059 | $30,866 | $31,659 | $31,523 |
| WiwynnOpM% | 6.3% | 6.8% | 7.0% | 7.0% | 6.1% | 5.2% | 5.2% | 5.2% |
| Net Income | $14,114 | $14,239 | $17,579 | $20,977 | $21,718 | $23,554 | $23,773 | $23,935 |
| EPS (NT$) | $75.95 | $76.62 | $94.59 | $112.87 | $116.86 | $126.74 | $127.92 | $128.79 |
Source: Company data, UBS estimates. Note: 2026E EPS shows reported number (pre-abnormal and goodwill).
| 2025 | 2026E | 2027E | 2028E |
|---|---|---|---|
| 1057.6 33.1 $11,579 | 1481.6 41.2 $14,424 | 1850.0 51.4 $16,557 | 2204.5 55.1 $17,902 |
| $382,671 | $593,621 | $986,638 | |
| $850,862 | |||
| 40% | 46% | 38% | 36% |
| 2329.6 61.3 | 3140.7 82.6 $8,014 | 3638.8 95.8 | 4002.7 105.3 |
| $8,562 | 52% | $8,013 $767,307 34% | $8,133 |
| 55% | $662,368 27.0 | 250.0 | $856,698 |
| $524,898 | 31% | ||
| 355.0 | 10.0 | 700.0 5000.0 | |
| 355.0 3.3 | 37.0 8.1 | 5000.0 5250.0 3.5 | 5700.0 4.3 |
| $31.0 $32,960 | $31.0 $9,246 | $31.0 | $0.0 |
| 3% | $627,300 | $905,200 | |
| 1% | 28% | 33% | |
| $950,663 | $1,277,671 | $2,258,697 | $2,762,162 |
| 44% | 47% | 65% | 68% |
| $32,960 | $8,068 | $45,900 | $139,500 |
| 3% | 1% | 2% | 5% |
| $10,135 | $13,625 | ||
| $950,663 | $1,277,671 | $2,762,162 | |
| $12,437 | $13,229 | ||
| $2,258,697 | |||
| 164% 2025 | 34% 2026E | 77% 2027E | 22% 2028E |
| 18% | 17% | 11% | 10% |
| 29% | 26% | 43% | 44% |
| 48% | 55% | 43% | 40% |
| 2% | 3% | 6% | |
| 5% | |||
| 100% | 100% | 100% | 100% |
| 2025 | 2026E | 2027E | 2028E |
|---|---|---|---|
| $524,898 $382,671 $32,960 | $662,368 $593,621 $3,418 | $767,307 $850,862 | $856,698 $986,638 |
| $10,135 | $4,650 $1,178 $12,437 | $45,900 $581,400 $13,229 | $139,500 $765,700 $13,625 |
| $950,663 | $1,277,671 | $2,258,697 | $2,762,162 |
| 164% | 34% | 77% | 22% |
| $78,454 | $106,388 | $159,375 | $186,591 |
| 8.5% | 8.8% | 9.4% | 9.4% |
| 8.5% | 7.9% | 7.9% | 7.9% |
| 2.3% | 2.8% 2.8% 3.4% | 2.7% 3.1% | 2.6% 3.1% |
| 7.5% | 7.2% | 6.5% | 6.5% |
| 8.3% | 8.3% | 7.1% | 6.8% |
| -$14,537 | -$19,497 | -$37,269 | -$43,449 |
| -1.5% | -1.5% | -1.7% | -1.6% |
| $63,918 | $86,891 | $122,106 | $143,142 |
| 6.7% | 6.8% | 5.4% | 5.2% |
| $51,118 | $66,909 | $92,979 | $108,363 |
| $275.06 | $360.03 | $500.32 | $583.09 |
Figure 4: Wiwynn annual and quarterly P&L
| Ticker Shares outstanding (mn) | Ticker Shares outstanding (mn) | 6669.TW 186 | Current Price (NT$) Mkt cap (NT$ mn) | Current Price (NT$) Mkt cap (NT$ mn) | Current Price (NT$) Mkt cap (NT$ mn) | $4,620 $858,585 |
|---|---|---|---|---|---|---|
| Year | 2022 | 2023 | 2024 | 2025 | 2026E | 2027E |
| Revenues (NT$ mn) | $292,876 | $241,901 | $360,541 | $950,663 | $1,277,671 | $2,258,697 |
| YoY Growth (%) | -17.4% | 49.0% | 163.7% | 34.4% | 76.8% | |
| Gross profit (NT$mn) | $23,979 | $22,657 | $37,400 | $78,454 | $106,388 | $159,375 |
| GM (%) | 8.2% | 9.4% | 10.4% | 8.3% | 8.3% | 7.1% |
| Operating profit (NT$mn) | $17,834 | $15,871 | $28,099 | $63,918 | $86,891 | $122,106 |
| OPM (%) | 6.1% | 6.6% | 7.8% | 6.7% | 6.8% | 5.4% |
| Net profit (NT$ mn) | $14,175 | $12,044 | $22,776 | $51,118 | $66,909 | $92,979 |
| EPS (NT$) | $81.07 | $68.88 | $127.29 | $275.06 | $360.03 | $500.32 |
| EPS growth (%) | -15% | 85% | 116% | 31% | 39% | |
| P/E (x) | 57.0 | 67.1 | 36.3 | 16.8 | 12.8 | 9.2 |
| Dividend yield (%) | 1% | 1.1% | 0.9% | 1.6% | 3.6% | 4.7% |
| P/B (x) | 20.8 | 19.1 | 9.3 | 6.9 | 5.3 | 4.0 |
| ROE (%) | 37% | 29% | 26% | 41% | 41% | 43% |
| Quarters | Q325 | Q425 | Q126 | Q226E | Q326E | Q426E |
|---|---|---|---|---|---|---|
| Revenues (NT$ mn) | $266,824 | $292,440 | $276,508 | $278,153 | $334,022 | $388,989 |
| QoQ Growth (%) | 9.6% | -5.4% | 0.6% | 20.1% | 16.5% | |
| Gross profit (NT$mn) | $23,532 | $21,129 | $20,881 | $23,487 | $28,832 | $33,189 |
| GM (%) | 8.8% | 7.2% | 7.6% | 8.4% | 8.6% | 8.5% |
| Operating profit (NT$mn) | $19,572 | $16,466 | $17,458 | $18,953 | $23,320 | $27,159 |
| OPM (%) | 7.3% | 5.6% | 6.3% | 6.8% | 7.0% | 7.0% |
| Net profit (NT$ mn) | $15,411 | $13,792 | $14,114 | $14,239 | $17,579 | $20,977 |
| EPS (NT$) | $82.93 | $74.21 | $75.95 | $76.62 | $94.59 | $112.87 |
Source: Company data, UBS estimates. Note: 2026E EPS shows reported number (pre-abnormal and goodwill).
Figure 5: Wiwynn sales driven by its top 3 customers
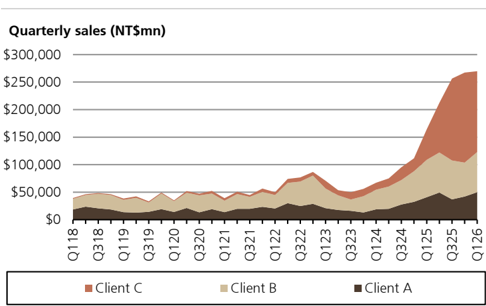
Source: Company data, UBS estimates
Figure 7: Wiwynn cash flow summary
| Annual (NT$mn) | 2021 | 2022 | 2023 | 2024 | 2025 | 2026E | 2027E | 21-25 Avg |
|---|---|---|---|---|---|---|---|---|
| Revenue | $192,626 | $292,876 | $241,901 | $360,541 | $950,663 | $1,277,671 | $2,258,697 | $407,721 |
| Capital spending | $506 | $1,466 | $4,885 | $4,887 | $13,101 | $17,608 | $31,128 | $4,969 |
| Capex/revenue (%) | 0.3% | 0.5% | 2.0% | 1.4% | 1.4% | 1.4% | 1.4% | 1.1% |
| Dep and amort | $548 | $762 | $1,002 | $2,005 | $2,690 | $4,112 | $5,089 | $1,401 |
| Depr/revenue (%) | 0.3% | 0.3% | 0.4% | 0.6% | 0.3% | 0.3% | 0.2% | 0.4% |
| Operating cash flow | -$14,212 | $30,678 | $23,060 | -$19,993 | -$624 | $55,538 | $62,830 | $3,782 |
| Free cash flow | -$14,719 | $29,212 | $18,175 | -$24,880 | -$13,726 | $37,930 | $31,702 | -$1,187 |
| FCF and Dividends | 2021 | 2022 | 2023 | 2024 | 2025 | 2026E | 2027E | 21-25 Avg |
| FCF / share (NT$) | -$84 | $167 | $104 | -$139 | -$74 | $204 | $171 | -$5 |
| FCF / EV Yield (%) | -1.7% | 3.3% | 2.1% | -2.8% | -1.6% | 4.3% | 3.6% | -0.1% |
| FCF Yield (%) | -1.8% | 3.6% | 2.3% | -3.0% | -1.6% | 4.4% | 3.7% | -0.1% |
| Dividend/share (NT$) | $32.00 | $25.00 | $50.00 | $41.15 | $74.00 | $165.04 | $216.02 | $44.43 |
| Payout rate (%) | 65% | 51% | 62% | 60% | 58% | 60% | 60% | 59% |
| Dividend amount (NT$) | $5,595 | $4,371 | $8,742 | $7,343 | $13,752 | $30,671 | $40,145 | $7,961 |
| Pre-Dividend close (NT$) | $773 | $1,045 | $730 | $1,945 | $2,440 | $4,620 | $4,620 | |
| Dividend Yield (%) | 4.1% | 2.4% | 6.8% | 2.1% | 3.0% | 3.6% | 4.7% | 3.7% |
Source: Company data, UBS estimates
Figure 6: ASIC server has been an additional growth driver beyond general server since H224
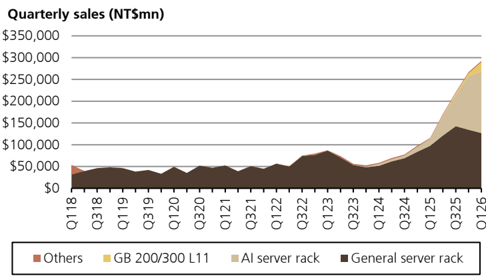
Source: Company data, UBS estimates
Figure 8: Wiwynn inventory building ahead of 2H26 ramps
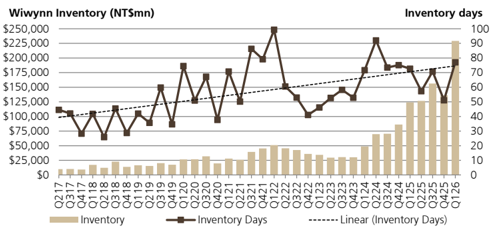
Source: Company data, UBS estimates
Figure 10: Wiwynn at the lower-end of its long-term P/E range
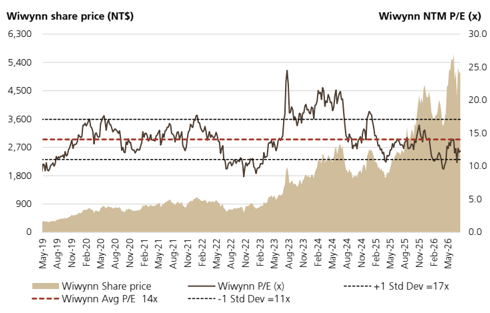
Source: Company data, UBS estimates
Figure 12: UBS upside / downside / base case scenario
| New UBS | New UBS | Prior UBS | Prior UBS | Upside Case | Upside Case | Downside Case | Downside Case | ||
|---|---|---|---|---|---|---|---|---|---|
| 2025 | 2026 | 2027 | 2026 | 2027 | 2026 | 2027 | 2026 | 2027 | |
| Sales YoY Growth Gross Profit | $950,663 163.7% 78,454 | $1,277,671 34.4% 106,388 | $2,258,697 76.8% 159,375 | $1,255,931 32.1% 104,455 | $1,939,693 54.4% 144,407 | $1,367,108 43.8% 114,792 | $2,397,381 75.4% 170,632 | $1,149,904 21.0% 94,600 | $1,581,088 37.5% 100,676 |
| GM% | 8.3% | 8.3% | 7.1% | 8.3% | 7.4% | 8.4% | 7.1% | 8.2% | 6.4% |
| Opex | 14,537 | 19,497 | 37,269 | 19,983 | 37,727 | 20,726 | 39,328 | 18,717 | 32,796 |
| OpM% | 6.7% | 6.8% | 5.4% | 6.7% | 5.5% | 6.9% | 5.5% | 6.6% | 4.3% |
| Non-Op Pretax | $2,135 66,052 | -$3,231 | -$2,305 104,375 | 92,665 | 64,650 | ||||
| Tax Rate Tax Net income EPS Shares EPS vs. base case | -23% ($14,934) 51,118 $275.06 | -$1,402 85,489 -23% ($19,329) 66,909 $360.03 | 118,876 -23% ($26,877) 92,979 $500.32 | -$1,321 83,151 -23% ($18,800) 65,125 $350.43 186 | -23% ($23,599) 81,800 $440.16 186 15 | -$1,402 -23% ($20,951) 71,714 $385.89 186 7.2% | -$3,231 128,074 -23% ($28,957) 99,117 $533.34 186 6.6% | -$1,402 74,480 -23% ($16,840) 57,640 $310.16 186 -13.9% | -$3,231 -23% ($14,617) 50,033 $269.22 186 -46.2% |
| 186 | 186 | 186 | |||||||
| Current Price | $4,620 | $4,880 | |||||||
| P/E | 14.0 | 15 | 13 | ||||||
| Implied Share Price Upside/Downside | $7,000 52% | $6,400 15% | $8,000 73% | $3,500 -24% |
Source: Company data, UBS estimates.Note: 2026E EPS shows reported number (pre-abnormal and goodwill).
Figure 9: Wiwynn still generating positive net cash
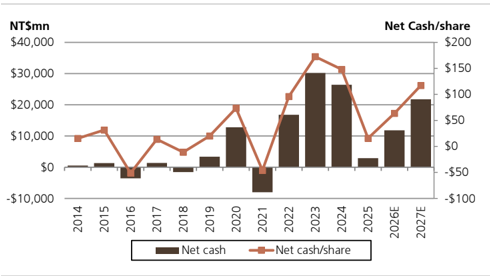
Source: Company data, UBS estimates
Figure 11: Wiwynn FWD EPS moving up faster than the share price
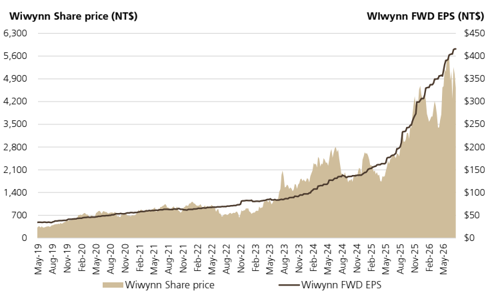
Source: Company data, UBS estimates
Forecast returns
| Forecast price appreciation | 51.5% |
|---|---|
| Forecast dividend yield | 2.5% |
| Forecast stock return | 54.0% |
| Market return assumption | 6.3% |
| Forecast excess return | 47.7% |
Company Description
Spun off from Wistron in March 2012, Wiwynn designs and manufactures cloud infrastructure equipment for hyperscaler data centres. Prior to 2015, Wiwynn provided storage servers and traditional servers. In 2015, Wiwynn began to shift its focus to manufacturing full rack server for hyperscale data centre clients. Its key clients include US Facebook (50-60% of total revenue), Microsoft (40-50%) and Amazon. Wiwynn is the second-largest white-box server manufacturer in terms of shipments. It has production sites in Mexico, the Czech Republic and China.
UBS EPS and Consensus EPS
The UBS EPS is an adjusted diluted EPS metric. It is calculated using the UBS analyst's interpretation of earnings suitable for valuation purposes divided by the diluted number of shares. This may differ to the way the consensus EPS metric has been calculated.
Valuation Method and Risk Statement
Our price target is based on PE multiple methodology.
Key downside risks for Wiwynn include: 1) a slowdown in the US CSP capex cycle; 2) margin compression due to intense competition; and 3) unfavourable FX movement.
Quantitative Research Review
UBS Global Research publishes a quantitative assessment of its analysts' responses to certain questions about the likelihood of an occurrence of a number of short term factors in a product known as the 'Quantitative Research Review'. The views for this month can be found below. Views contained in this assessment on a particular stock reflect only the views on those short term factors which are a different timeframe to the 12-month timeframe reflected in any equity rating set out in this note. For previous responses please make reference to (i) previous UBS Global Research reports; and (ii) where no applicable research report was published that month, the Quantitative Research Review which can be found at https://neo.ubs.com/quantitative, or contact your UBS sales representative for access to the report or the Quantitative Research Team on ubs-quant-answers@ubs.com. A consolidated report which contains all responses is also available and again you should contact your UBS sales representative for details and pricing or the Quantitative Research Team on the email above.
Wiwynn
| Question | Response |
|---|---|
| 1. Is the industry structure facing the firm likely to improve or deteriorate over the next six months? Rate on a scale of 1-5 (1 = getting worse, 3 = no change, 5 = getting better, N/A = no view) | 4 |
| 2. Is the regulatory/government environment facing the firm likely to improve or deteriorate over the next six months? Rate on a scale of 1-5 (1 = getting tougher 3 = no change, 5 = getting better, N/A = no view) | 3 |
| 3. Over the last 3-6 months in broad terms have things been improving/no change/getting worse for this stock? Rate on a scale of 1-5 (1 = getting a lot worse, 3 = not much change, 5 = getting a lot better, N/A = no view) | 5 |
| 4. Relative to the current CONSENSUS EPS forecast, is the next company EPS update likely to lead to: (1 = negative surprise vs consensus, 3 = in-line with consensus, 5 = positive surprise vs consensus expectations, N/A = no view) | 5 |
| 5. What's driving the difference? | |
| 6. Relative to YOUR current earnings forecast, is there relatively greater risk at the next earnings result of:(1 = downside skew risk to earnings, 3 = equal upside or downside risk to earnings, 5 = upside skew risk to earnings, N/A = no view) | 5 |
| 7. What's driving the difference? | |
| 8. Is there an upcoming catalyst for the company over the next three months? | Positive Catalyst |
| 9. Is there an actual or approximate date for the catalyst? | |
| 10. Is the catalyst date an actual or approximate date? | |
| 11. What is the catalyst? |
Required Disclosures
This document has been prepared by UBS Securities Pte. Ltd., Taipei Branch, an affiliate of UBS AG. UBS AG, its subsidiaries, branches and affiliates, including former Credit Suisse AG and its subsidiaries, branches and affiliates are referred to herein as "UBS".
For information on the ways in which UBS manages conflicts and maintains independence of its UBS Global Research product; historical performance information; certain additional disclosures concerning UBS Global Research recommendations; and terms and conditions for certain third party data used in research report, please visit https://www.ubs.com/disclosures. Unless otherwise indicated, information and data in this report are based on company disclosures including but not limited to annual, interim, quarterly reports and other company announcements. The figures contained in performance charts refer to the past; past performance is not a reliable indicator of future results. Additional information will be made available upon request. UBS Securities Co. Limited is licensed to conduct securities investment consultancy businesses by the China Securities Regulatory Commission. UBS acts or may act as principal in the debt securities (or in related derivatives) that may be the subject of this report. This recommendation was finalized on: 17 July 2026 12:15 PM GMT. UBS has designated certain UBS Global Research department members as Derivatives Research Analysts where those department members publish research principally on the analysis of the price or market for a derivative, and provide information reasonably sufficient upon which to base a decision to enter into a derivatives transaction. Where Derivatives Research Analysts coauthor research reports with Equity Research Analysts or Economists, the Derivatives Research Analyst is responsible for the derivatives investment views, forecasts, and/or recommendations. Quantitative Research Review: UBS Global Research publishes a quantitative assessment of its analysts' responses to certain questions about the likelihood of an occurrence of a number of short term factors in a product known as the 'Quantitative Research Review'. Views contained in this assessment on a particular stock reflect only the views on those short term factors which are a different timeframe to the 12-month timeframe reflected in any equity rating set out in this note. For the latest responses, please see the Quantitative Research Review Addendum at the back of this report, where applicable. For previous responses please make reference to (i) previous UBS Global Research reports; and (ii) where no applicable research report was published that month, the Quantitative Research Review which can be found at https://neo.ubs.com/ quantitative, or contact your UBS sales representative for access to the report or the Quantitative Research Team on ubs-quantanswers@ubs.com. A consolidated report which contains all responses is also available and again you should contact your UBS sales representative for details and pricing or the Quantitative Research team on the email above.