PDF 原檔:報告_Nomura_中砂1560_20260714_original.pdf
圖片清單(已驗證 2026-07-15)
| 檔名 | size | 分類 | 親眼所見內容 |
|---|---|---|---|
報告_Nomura_中砂1560_20260714_001.png |
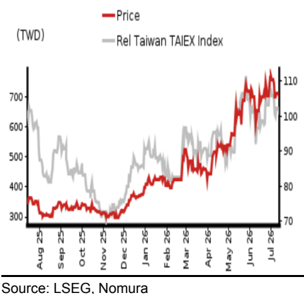
39KB(近門檻,仍逐張 Read) | 真資料圖 | 中砂股價相對表現圖:股價(TWD,紅線)vs 相對台灣 TAIEX 指數(灰線),2025/08–2026/07 |
報告_Nomura_中砂1560_20260714_002.png |
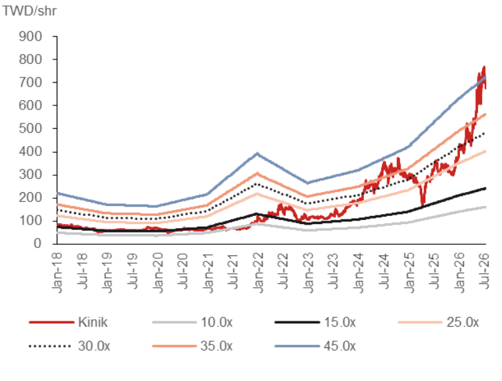
65KB | 真資料圖 | Fig. 3:中砂股價歷史走勢圖疊加 10x–45x 本益比等值線帶(2018/01–2026/07) |
報告_Nomura_中砂1560_20260714_003.png |
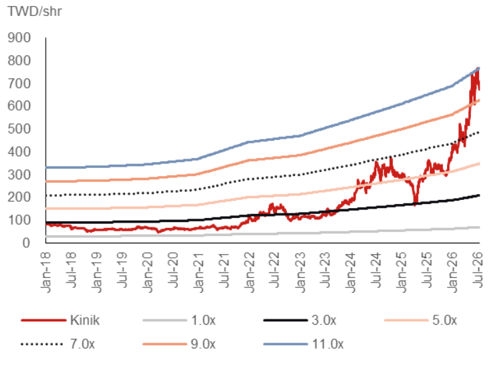
56KB | 真資料圖 | Fig. 4:中砂股價歷史走勢圖疊加 1x–11x 股價淨值比等值線帶(2018/01–2026/07) |
報告_Nomura_中砂1560_20260714_004.png |
102KB | 真資料圖 | 三年期評等與目標價歷史圖:2026-05-21 Buy 評等、目標價 TWD840、收盤價 TWD669 標記點;股價自 2024 年初約 TWD150 上升至 2026/07 約 TWD800 |
分類只有三類:
真資料圖/裝飾·logo·banner/文字卡。<40KB 未 Read 者免列(預設 logo);本份 001 雖低於 40KB 門檻但因位於「Relative performance chart」段落標題下,仍逐張 Read 確認。
原始內容
Relative performance chart
EQUITY: TECHNOLOGY
Price
(TWD)
700-
6001
500-
4001
300-
-100
-90
480
Kinik Company
1560.TW 1560 TT
EQUITY: TECHNOLOGY
Churra. I CEC Namura
SBU is catching up to the rising trend of DBU
Kinik's reclaim/test wafer business likely benefiting from rising customer demand alongside the semi wafer industry
Maintain Buy and raise TP to TWD900, implying 33% upside
In our initiation report of May 2026, we highlighted two secular growth drivers for Kinik its chemical mechanical polishing (CMP) pad conditioner (DBU) business, and the reclaim/test/carrier wafer business (SBU). We believe the market recognizes that Kinik is a major CMP pad conditioner supplier to a leading foundry company, but it is not yet fully aware of the potential upside driven by SBU. On the back of our positive outlook for a semi wafer industry recovery since May (report 1 , report 2 , report 3 ), we expect the reclaim/test/carrier wafer industry to also benefit from customer demand growth. We maintain our Buy rating and raise 2026-28F earnings forecasts by 5-11%, with a higher TP of TWD900 (vs TWD840 previously), based on 40x 2028F EPS of TWD22.5 (vs 40x 2028F EPS of TWD21 previously). The stock is trading at 30x 2028F EPS.
SBU: benefiting from rising demand from customers, including Micron
Our estimates build in further improvement in Kinik's SBU product mix for 2Q26F, mainly because Kinik supplies carrier wafers for Micron's HBM, which has recorded persistent increase in volumes. Given better specs, we estimate that Kinik's SBU GPM could rise meaningfully sequentially from 30% levels in 1Q26. Recently, Micron (MU US, Not rated) and GlobalWafers (GWC; 6488 TT, Buy) announced a 10-year semi wafer supply agreement (LTA), which we estimate will result in meaningful semi wafer price hikes ( report ) as memory companies have ample cash to secure upstream supply early to meet customer demand and to secure future capacity expansion. As a result, we see the possibility of an upward revision in Kinik's carrier wafer prices in the coming quarters.
DBU: benefiting from foundry's utilization rate improvement
Kinik's DBU is likely benefiting from increased shipments to its leading foundry customer for the N2 node, where demand is poised to see continued expansion. Once the leading foundry customer's A16 node capacity starts to grow further from mid-2027F onwards, we believe there will be more content growth for Kinik's CMP pad conditioners. Beyond the strong momentum from the leading foundry customer, overall foundry industry utilization rates have been improving in recent months; thus, we expect Kinik's other foundry/IDM customers to increase orders for CMP pad conditioners in the near future.
| Year-end 31 Dec | FY25 | FY26F | FY27F | FY28F | |||
|---|---|---|---|---|---|---|---|
| Currency (TWD) | Actual | Old | New | Old | New | Old | New |
| Revenue (mn) | 8,149 | 9,702 | 10,039 | 11,353 | 11,735 | 14,200 | 14,718 |
| Reported net profit (mn) | 1,360 | 1,982 | 2,075 | 2,439 | 2,653 | 3,020 | 3,350 |
| Normalised net profit (mn) | 1,360 | 1,982 | 2,075 | 2,439 | 2,653 | 3,020 | 3,350 |
| FD normalised EPS | 9.26 | 13.60 | 13.93 | 16.73 | 17.81 | 20.72 | 22.50 |
| FD norm. EPS growth (%) | 30.4 | 45.7 | 50.5 | 23.1 | 27.9 | 23.8 | 26.3 |
| FD normalised P/E (x) | 72.9 | - | 48.4 | - | 37.9 | - | 30.0 |
| EV/EBITDA (x) | 50.9 | - | 33.4 | - | 26.0 | - | 20.1 |
| Price/book (x) | 12.1 | - | 10.6 | - | 8.8 | - | 7.1 |
| Dividend yield (%) | 0.6 | - | 0.8 | - | 0.8 | - | 0.8 |
| ROE (%) | 17.8 | 22.8 | 23.8 | 24.2 | 25.8 | 25.0 | 26.7 |
| Net debt/equity (%) | net cash | net cash | net cash | net cash | net cash | net cash | net cash |
Source: Company data, Nomura estimates
Global Markets Research 14 July 2026
| Rating Remains | Buy |
|---|---|
| Target price Increased from TWD 840.00 | TWD 900.00 |
| Closing price 14 July 2026 | TWD 675.00 |
| Implied upside | +33.3% |
| Market Cap (USD mn) | 3,123.9 |
| ADT (USD mn) | 43.7 |
Relative performance chart
Research Analysts
Semiconductor
Donnie Teng - NIHK donnie.teng@nomura.com +852 2252 1439
Aaron Jeng, CFA - NITB
aaron.jeng@nomura.com +886(2) 21769962
Eric Chen, CFA - NITB
eric.chen@nomura.com +886(2) 21769965
Vivian Yang - NITB
vivian.yang@nomura.com +886(2) 21769970
Production Complete: 2026-07-14 13:52 UTC
Key data on Kinik Company
Performance
| (%) | 1M | 3M | 12M | ||
|---|---|---|---|---|---|
| Absolute (TWD) | 3.5 | 34.2 | 95.1 | M cap (USDmn) | 3,123.9 |
| Absolute (USD) | 1.7 | 31.9 | 77.5 | Free float (%) | 74.7 |
| Rel to Taiwan TAIEX Index | 0.8 | 9.2 | -5.6 | 3-mth ADT (USDmn) | 43.7 |
Income statement (TWDmn)
| Year-end 31 Dec | FY24 | FY25 | FY26F | FY27F | FY28F |
|---|---|---|---|---|---|
| Revenue | 7,019 | 8,149 | 10,039 | 11,735 | 14,718 |
| Cost of goods sold | -4,831 | -5,502 | -6,122 | -6,942 | -8,797 |
| Gross profit | 2,188 | 2,647 | 3,917 | 4,793 | 5,921 |
| SG&A | -1,033 | -1,344 | -1,705 | -1,873 | -2,128 |
| Employee share expense | |||||
| Operating profit | 1,155 | 1,303 | 2,213 | 2,920 | 3,793 |
| EBITDA | 1,164 | 1,955 | 2,939 | 3,707 | 4,679 |
| Depreciation | -9 | -642 | -716 | -777 | -875 |
| Amortisation | 0 | -10 | -10 | -10 | -10 |
| EBIT | 1,155 | 1,303 | 2,213 | 2,920 | 3,793 |
| Net interest expense | 18 | 1 | -1 | -1 | -1 |
| Associates & JCEs | |||||
| Other income | 115 | 354 | 378 | 400 | 400 |
| Earnings before tax | 1,289 | 1,658 | 2,590 | 3,320 | 4,192 |
| Income tax | -227 | -263 | -461 | -598 | -755 |
| Net profit after tax | 1,062 | 1,395 | 2,129 | 2,722 | 3,438 |
| Minority interests | -27 | -35 | -54 | -69 | -87 |
| Other items | |||||
| Preferred dividends | |||||
| Normalised NPAT | 1,035 | 1,360 | 2,075 | 2,653 | 3,350 |
| Extraordinary items | |||||
| Reported NPAT | 1,035 | 1,360 | 2,075 | 2,653 | 3,350 |
| Dividends | -640 | -584 | -745 | -745 | -745 |
| Transfer to reserves | 395 | 776 | 1,330 | 1,908 | 2,606 |
| Valuations and ratios | |||||
| Reported P/E (x) | 95.1 | 72.9 | 48.4 | 37.9 | 30.0 |
| Normalised P/E (x) | 95.1 | 72.9 | 48.4 | 37.9 | 30.0 |
| FD normalised P/E (x) | 95.1 | 72.9 | 48.4 | 37.9 | 30.0 |
| Dividend yield (%) | 0.7 | 0.6 | 0.8 | 0.8 | 0.8 |
| Price/cashflow (x) | 60.8 | 51.8 | 30.0 | 25.5 | 22.6 |
| Price/book (x) | 13.8 | 12.1 | 10.6 | 8.8 | 7.1 |
| EV/EBITDA (x) | 84.9 | 50.9 | 33.4 | 26.0 | 20.1 |
| EV/EBIT (x) | 85.6 | 76.4 | 44.3 | 33.0 | 24.8 |
| Gross margin (%) | 31.2 | 32.5 | 39.0 | 40.8 | 40.2 |
| EBITDA margin (%) | 16.6 | 24.0 | 29.3 | 31.6 | 31.8 |
| EBIT margin (%) | 16.5 | 16.0 | 22.0 | 24.9 | 25.8 |
| Net margin (%) | 14.7 | 16.7 | 20.7 | 22.6 | 22.8 |
| Effective tax rate (%) | 17.6 | 15.9 | 17.8 | 18.0 | 18.0 |
| Dividend payout (%) | 61.8 | 42.9 | 35.9 | 28.1 | 22.2 |
| ROE (%) | 713.6 | 17.8 | 23.8 | 25.8 | 26.7 |
| ROA (pretax %) | 12.9 | 12.6 | 19.9 | 27.4 | 34.1 |
| Growth (%) | |||||
| Revenue | 10.0 | 16.1 | 23.2 | 16.9 | 25.4 |
| EBITDA | 16.5 | 68.0 | 50.3 | 26.1 | 26.2 |
| Normalised EPS | 20.2 | 30.4 | 50.5 | 27.9 | 26.3 |
| Normalised FDEPS | 20.2 | 30.4 | 50.5 | 27.9 | 26.3 |
Source: Company data, Nomura estimates
Cashflow statement (TWDmn)
| Year-end 31 Dec | FY24 | FY25 | FY26F | FY27F | FY28F |
|---|---|---|---|---|---|
| EBITDA Change in | 1,164 | 1,955 -244 | 2,939 -686 | 3,707 -555 | 4,679 -1,115 |
| working capital Other operating cashflow | -45 498 | 202 | 1,098 | 790 | 885 |
| Cashflow from operations | 1,617 | 1,914 | 3,351 | 3,943 | 4,448 |
| expenditure | -349 | -583 | -731 | ||
| Capital | -1,060 | -498 | 3,717 | ||
| Free cashflow | 1,269 | 855 | 2,853 | 3,360 | |
| Reduction in investments | -114 | -853 | -3 | -3 | -3 |
| Net acquisitions | 0 | 0 | 0 | 0 | 0 |
| Dec in other LT assets | 0 | 0 | 0 | 0 | 0 |
| Inc in other LT liabilities | 0 | 0 | 0 | 0 | 0 |
| Adjustments | 0 | 0 | 0 | 0 | 0 |
| CF after investing acts | 1,155 | 1 | 2,850 | 3,358 | 3,715 |
| Cash dividends | -640 | -584 | -745 | -745 | -745 |
| Equity issue | 0 | 0 | 0 | 0 | 0 |
| Debt issue | 0 | 0 | 0 | 0 | 0 |
| Convertible debt | 0 | 0 | |||
| issue | 0 | 0 | 0 | -870 | |
| Others acts | 467 | 155 | -870 | -870 | -1,615 |
| CF from financial | -173 | -429 | -1,615 | -1,615 | |
| Net cashflow | 982 | -427 | 1,236 | 1,743 | 2,100 |
| Beginning cash | 1,018 | 2,001 | 1,573 | 2,809 | 4,552 |
| Ending cash | 2,001 | 1,573 | 2,809 | 4,552 | 6,652 |
| Ending net debt | -848 | -220 | -1,670 | -3,414 | -5,514 |
| Balance sheet (TWDmn) | |||||
| As at 31 Dec | FY24 | FY25 | FY26F | FY27F | FY28F |
| Cash & equivalents | 2,001 | 1,573 | 2,809 | 4,552 | 6,652 |
| Marketable securities | 0 | 5 | 0 | 0 | 0 |
| Accounts receivable | 1,149 | 1,420 | 1,643 | 1,921 | 2,409 |
| Inventories | 2,049 | 2,431 | 2,596 | 2,944 | 3,730 |
| Other current assets | 38 | 52 | 38 | 38 | 38 |
| Total current assets | 5,237 | 5,482 | 7,086 | 9,455 | 12,830 |
| LT investments | 1,125 | 1,071 | 1,125 | 1,125 | 1,125 |
| Fixed assets | 4,249 | 5,417 | 5,199 | 5,005 | 4,860 |
| Goodwill | 0 | 0 | 0 | 0 | 0 |
| Other intangible assets | 0 | 0 | 0 | 0 | 0 |
| Other LT assets | 440 | 1,289 | -63 | -259 | -724 |
| Total assets | 11,051 | 13,258 | 13,347 | 15,326 | 18,092 |
| Short-term debt | 61 | 344 | 61 | 61 | 61 |
| Accounts payable | 417 | 490 | 528 | 599 | 759 |
| Other current liabilities | 998 | 1,348 | 998 | 998 | 998 |
| Total current liabilities | 1,475 | 2,182 | 1,586 | 1,657 | 1,817 |
| Long-term debt | 1,078 | 1,010 | 1,078 | 1,078 | 1,078 |
| Convertible debt | 0 | 0 | 0 | 0 | 0 |
| Other LT liabilities | 1,071 | 1,578 | 1,071 | 1,071 | 1,071 3,967 |
| Total liabilities | 3,625 | 4,769 | 3,736 | 3,807 | |
| Minority interest | 292 | 344 | 292 | 292 | 292 |
| Preferred stock Common stock | 4,263 | 4,437 | 4,263 | 4,263 | |
| Retained earnings | 2,886 | 3,741 | 5,071 | 6,980 | 4,263 9,585 |
| Proposed dividends | -16 | -33 | -16 | -16 | -16 |
| Other equity and reserves Total shareholders' equity | 7,134 | 8,145 | 9,319 | 11,227 | 13,833 |
| Total equity & liabilities | 15,326 | 18,092 | |||
| Liquidity (x) | 11,051 | 13,258 | 13,347 | ||
| 3.55 - | - | 2,760.6 | 3,643.5 | ||
| net cash | |||||
| Current ratio | 2.51 | 4.47 | 5.71 | 7.06 | |
| Interest cover Leverage | 4,732.0 | ||||
| Net debt/EBITDA (x) | net cash | net cash net | net cash net | net | net cash |
| Net debt/equity (%) | net cash | cash | cash | cash | net cash |
| Per share Reported EPS (TWD) Norm EPS (TWD) | 7.10 7.10 | 9.26 9.26 | 13.93 13.93 | 17.81 17.81 | 22.50 22.50 22.50 |
| FD norm EPS (TWD) | 7.10 48.94 | 9.26 55.87 | 13.93 63.92 | 17.81 77.01 | |
| BVPS (TWD) | 94.89 | ||||
| DPS (TWD) | 4.39 | 4.01 | 5.11 | 5.11 | 5.11 |
| Activity (days) | 55.7 | 55.4 | 53.8 | ||
| Days receivable | 59.7 | 57.5 148.6 | 149.9 | 145.6 | 138.8 |
| Days inventory Days payable | 154.8 31.5 | 30.1 | 30.4 | 29.6 | 28.2 |
| Cash cycle | 183.0 | 176.0 | 175.2 | 171.4 | 164.4 |
Source: Company data, Nomura estimates
Company profile
Founded in 1953, Kinik is Taiwan's first grinding wheel manufacturer dedicated to grinding technology. Since 2000, Kinik has extended its grinding wheel expertise into the semiconductor industry. Kinik now supplies grinding wheels, diamond disks, and reclaimed wafers to the leading semiconductor customers in the worldwide.
Valuation Methodology
Our TP of TWD900 is based on 40x 2028E EPS TWD22.5, in the upper half of its historical P/E of 10-45x, to address the stably growing business with the leading foundry customer as well as the rising total addressable market (TAM) across its different business units. The bench mark index is TAIEX.
Risks that may impede the achievement of the target price
Downside risks are: 1) the products are disqualified by the leading foundry customer; 2) losing market share to competitors; 3) fail to broaden the product portfolio; 4) the weakening Semi market demand.
ESG
For the purpose of promoting sustainable transformation and strengthening corporate governance performance, Kinik's Board of Directors approved the establishment of the Sustainable Development Committee in December 2021, as the core organization to promote sustainable development. Kinik publishes annual sustainable report every year since 2022.
(TWD mn)
Net Sales
COGS
Gross profit
SG&A
1,491
Previous
9,702
803
2Q26F
2,493
4026F|
3Q26F
2026F
1Q27F
2,694
1,593
Revised Change (%; pp) Previous
2,579
1,498
1,542
995
10,039
2,674 1
3.5
11,353
Earnings estimate revisions
EPS
Op margin
PBT margin
Net margin
QoQ (%)
Sales
Op income
Gross profit
Net income
YoY (%)
Sales
Op profit
Gross profit
Net profit
2Q27F
2,927
3Q27F
4027F)
FY25
2027F
Revised Change (%; pp) Previous
11,735
8,149
3,006
1,735
1,192
1,275 1
3.4
410
59
1,225
62|
423 !
11.5
10.1
2,647
14,200
5,502
1,157
187
5,294
1,303
3,380
355
9.3
37.3
1,781
415
60
2,920
4,793
We raise our 2026F-28F earnings by 5-11% on the back of our expectation for strongerthan-expected top-line growth and potential GPM expansion driven by both the DBU and SBU businesses. The GPM upside should be primarily driven by SBU due to an improved product mix and potentially a more favorable pricing environment. 3.0 4.56 4.78 |
Fig. 1: Kinik: earnings estimate revisions
17.9
21.7
4Q27F!
41.0;
1.5
25.41
1.1
28.6'
21.3
FY25
23.8
32.5
16.0
20.3
FY26F
FY27F
2028F
Revised Change (%; pp)
10,039
11,735
14,718
6,122
6,942
8,797
3,917
3.6
1,482
4,793
5,921
222
5,921
3,793
4,192
2,213
377
2,590
3,350
2,080
461
22.5
14.0
40.2
FY26F
22.8
25.8
39.0
22.0
25.8
22.6
25.0
23.2
40.5-
0.5
24.0!
0.2
28.4
1Q27F
23.4
40.9
21.5
24.4
28.1
24.9
2Q27F
40.7
24.7
3Q27F
40.7
24.9
28.3
240
1,632
2,920
399
3,320
2,653
598
17.8
FY27F
40.8
24.9
28.3
22.6
11.9
1,860
12.2
268
3,793
399
10.9
10.9
755
4,192
3,350
10.9
22.5
FY28F
40.2
25.8
| 17.8 | 21.9 22.71 22.4 | 21.9 22.71 22.4 | 21.9 22.71 22.4 | 22.6 22.91 16.7 | 22.6 22.91 16.7 | 22.6 22.91 16.7 | 22.6 22.8 | 22.6 22.8 | 22.6 22.8 |
|---|---|---|---|---|---|---|---|---|---|
| 20.0 | 4026F| | 28.1 22.5 | 4027Fl | 20.7 | |||||
| 1Q26 6 | 2Q26F | 3Q26F 3 | 4! 1Q27F | 2Q27F | 3Q27F | 3! FY25 | FY26F | FY27F | FY28F |
| 8 | 9 24 | 4 | 1 2 | 9 | 3 3 | ||||
| ---- 22 | 37 | 6 | 2 | 10 | 4 | 5 i | |||
| (15) | 22 | 14 | (1) | 3 | |||||
| 1Q26 | 2Q26F | 3Q26F 4Q26F! | 1 1Q27F | 2Q27F | 3Q27F | 4027F| FY25 | FY26F | FY27F | FY28F |
| 29 47 | 18 46 | 23 53 | 17 37 | 17 20 | 17 18 | 16 21 | 23 48 | 17 22 | 25 24 |
| 46 | 60 87 | 79 | 60 | 28 32 | 25 | 13 31 | 70 | 32 | 30 26 |
| 43 | 72 | 48 | 20 | 53 | 28 |
Source: Nomura estimates
Fig. 2: Kinik: P&L
Source: Company data, Nomura estimates
Valuation and risks
Our new TP of TWD900 is based on 40x 2028E EPS TWD22.5, in the upper half of its historical P/E of 10-45x, reflecting the steady business growth with the leading foundry customer as well as an expanding total addressable market (TAM) across its different business units.
Downside risks are: 1) the products are disqualified by the leading foundry customer; 2) losing market share to competitors; 3) failure to broaden the product portfolio; 4) weakening semi market demand.
28.5
1,592 |
27.4
900
800
700
600
500
400
300
200
100
0
Jan-18
Fig. 3: Kinik: P/E
TWD/shr
900
800
700
600
Source: Bloomberg Finance L.P., Nomura estimates
Fig. 4: Kinik: P/B
Jul-18
• 7.0x
Source: Bloomberg Finance L.P., Nomura estimates
Jan-18
Rating and target price chart (three year history)
Kinik Company
Appendix A-1
This report has been produced by Nomura International (Hong Kong) Ltd. (NIHK), Hong Kong.
See Disclaimers for Nomura Group entity details.