PDF 原檔:報告_Macquarie_台積電2330_20260716_original.pdf
圖片清單(已驗證 2026-07-17)
| 檔名 | size | 分類 | 親眼所見內容 |
|---|---|---|---|
報告_Macquarie_台積電2330_20260716_005.png |
44KB | 真資料圖 | Figure 8:TSMC Revenue(NT$bn 柱狀)+GM/OPM(%折線),2018-2028E |
報告_Macquarie_台積電2330_20260716_006.png |
47KB | 真資料圖 | 12-month forward PEx band 圖:11x(-2SD)-19.4x(2SD) 本益比帶+股價走勢,2021-2026 |
報告_Macquarie_台積電2330_20260716_008.png |
40KB | 真資料圖 | Figure 9:TSMC Wafer shipment(12" 等值晶圓,千片/年,柱狀)+ASP(US$,折線),2008-2028E |
報告_Macquarie_台積電2330_20260716_013.png |
80KB | 真資料圖 | Macquarie Quant Alpha Model:Monthly Factor Long-Short Returns 因子報酬表,2025-06 至 2026-06 逐月+5年/10年年化 |
報告_Macquarie_台積電2330_20260716_014.png |
41KB | 真資料圖 | 2330 TT rel TAIEX performance & rec history:股價/TAIEX 走勢+歷次目標價點位標註,2024-02 至 2026-07 |
_001.png(32KB)、_002.png(31KB)、_003.png(28KB)、_004.png(23KB)、_007.png(29KB)、_009.png(36KB)、_010.png(19KB)、_011.png(16KB)、_012.png(21KB)均未達 40KB 門檻,預設 logo/裝飾未逐張 Read。
原始內容
rec history
5000
Outperform
— 2330 [LHS]
4000
3000
2000
1000
Marqueeldeas
180
100
80
Feb-24 Sep-24 May-25 Dec-25
Feb-24
Jul-26
Source: FactSet. Macauarie Research. Jul 2026 lall fiaures in
TSMC
Beat and raise; capex up a positive signal
Key Points
- TSMC reconfirmed AI demand is strong and getting stronger, with agentic AI adding a new CPu demand leg on top of accelerators.
- Margins up again on 3/5nm-led mix and HPC strength. Dilution from N2 ramp and overseas fabs looks manageable.
- Mgt welcomes EMIB-T to release the advanced packaging bottleneck as front-end wafer business stays with TSMC either way.
- Beat and raise. 2Q26 rev of NT$1.27trn grew 12% QoQ, in line with MQe/FCSTe/guidance. GPM increased by 148bps QoQ to 67.7%, slightly beating MQe/FCSTe/guidance by 43bps/41bps/123bps. EPS grew 23% QoQ to NT$27.3, beating MQe/FCSTe by 11%/13%. Mgt raised 2026E rev guidance to >40% YoY (prior >30%) and raised capex guidance to US $60-64bn (prior US$56bn), plus a new US$100bn Arizona investment.
- A14 on track with growing family. Pilot production of A14 comes in 2027 and mass production in 2028, with high yields already in the early stage and customer engagement ahead of schedule. New A13 (optical shrink, IP-compatible) and A12 (adds Super Power Rail) follow in 2029. Mgt sees A14 family becoming bigger and longer-lived than N2.
- Strong AI demand, getting stronger. CSP signals remain very strong. Mgt reiterated that demand is stronger than prior targets. Agentic AI is reviving CPU demand, and TSMC checks data-centre build outs to support its capacity expansion plan.
- Margin resilience intact. 2Q26 GPM rose on 3/5nm-led mix (HPC now 66% of rev) and utilisation. Mgt mentions that N2 ramp dilutes 2H26 GPM by 3-4ppts and overseas fabs 2-3ppts, offset by productivity, crossnode optimisation, and disciplined pricing.
- EMIB-T competition is welcomed. Mgt explains that current packaging capacity is tight which caps customer's growth. Hence, mgt welcomes EMIB-T sharing the load. Front-end and back-end are different businesses and the front-end wafer business is still made at TSMC.
Earnings changes: We raise 2026E/27E/28E net profit by 12%/23%/24% to reflect better-than-expected shipment and ASP upside driven by stronger AI demand.
Valuation: We lift our TP 24% to NT$4,200, from NT$3,380 based on an unchanged 21x 2028E PE; we project a 45% EPS CAGR over 2025-28E.
Catalysts: New capacity increases for N2/A16/A14; smart device replacement demand; new AI product launches
Investment Thesis and Recommendation
Our three-year outlook remains very positive, underpinned by strong HPC/on-device AI demand growth, pricing power for future products, and continued market share gains. More TSMC research here.
- Rel TAlEX [RHS) • Price Target
Semicons & Semicon Equip
Taiwan
Arthur Lai
Katherine Cheng
| 2330 TT | Outperform |
|---|---|
| Price (at 16 Jul 2026) | TWD2,440 |
| 12-month target | TWD4,200.00 |
| 12-month TSR (%) | 73.2 |
| Volatility Index | Medium |
| Market Cap (Local) (m) | 63,274,981 |
| Market Cap (USD) (m) | 1,965,825 |
| Free Float (%) | 93 |
| 30-day avg turnover (USD) (m) | 2,467.0 |
Investment Fundamentals
| Year end 31 Dec Revenue (bn) | 2025A 3,809 | 2026E 5,498 | 2027E 8,212 | 2028E 11,076 |
|---|---|---|---|---|
| Revenue growth (%) | 31.6 | 44.3 | 49.3 | 34.9 |
| EBIT (bn) | 1,936 | 3,263 | 4,849 | 6,086 |
| EBIT growth (%) | 46.4 | 68.6 | 48.6 | 25.5 |
| 4,141 | ||||
| Reported profit (bn) | 1,718 | 2,868 | 5,185 | |
| Adjusted profit (bn) | 1,718 | 2,868 | 4,141 | 5,185 |
| EPS rep [TWD] | 66.2 | 110.6 | 159.7 | 200.0 |
| EPS rep growth (%) | 46.4 (31.8) | 67.0 (39.3) | 44.3 (48.4) | 25.2 (56.8) |
| Net debt/equity (%) | 31.9 | |||
| ROA (%) | 26.5 | 33.6 | 35.2 | |
| ROE (%) | 35.4 | 43.7 | 43.9 | 38.8 |
| PER rep (x) | 36.8 | 22.1 | 15.3 | 12.2 7.8 |
| EV/EBITDA (x) | 23.2 | 15.1 | 10.2 | |
| P/BV (x) Total div yield (%) | 11.7 0.7 | 8.2 0.9 | 5.7 1.1 | 4.1 1.2 |
| Quant (rank vs. global | 1 / 668 |
2330 TT rel TAIEX performance, & rec history
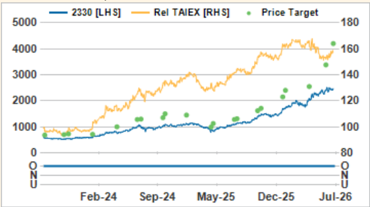
Source: FactSet, Macquarie Research, Jul 2026 (all figures in TWD unless noted, TP in TWD)
20%
15%
10%
5%
0%
-5%
-10%
-15%
-20%
Key Risks to Investment Thesis
- A larger/longer inventory correction.
- End-demand weakening more than we expect.
- Higher-than-expected material costs/inflation.
- Unfavourable FX movements.
Figure 1 - TSMC revenue QoQ guidance vs actual
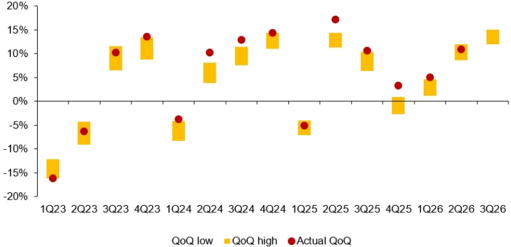
Source: TSMC, Macquarie research, Jul 2026
TSMC (2330 TT) TWD/(bn) unless otherwise noted
70.0%
65.0%
60.0% -
Company Description
TSMC is the world's largest semiconductor foundry with over 50% market share. It has a diversified exposure to Mobile processors (Apple, Mediatek, Qualcomm), High Performance Computing (AMD, AWS, Broadcom, Intel, Nvidia), Automotives (MobilEye, STMicro, Tesla) and Industrial and Consumer electronics. TSMC has over 90% market share in leading-edge EUV nodes. The majority of its capacity is located in Taiwan, but some is also in China, Japan and the USA.
Figure 2 - TSMC GPM guidance vs actual
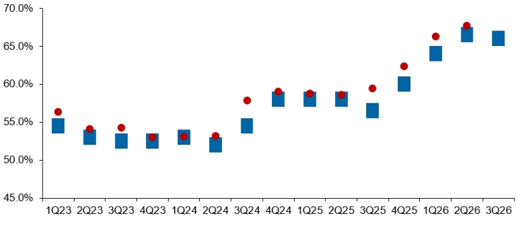
Source: TSMC, Macquarie research, Jul 2026
| Income Statement Dec FY | 2025A | 2026E | 2027E | 2028E | Q2/26A | Q3/26E | Balance Sheet | 2025A | 2026E | 2027E | 2028E |
|---|---|---|---|---|---|---|---|---|---|---|---|
| Revenue | 3,809 | 5,498 | 8,212 | 11,076 | 1,270 | 1,451 | Cash | 2,768 | 4,315 | 6,995 | 10,726 |
| Cost of Goods Sold | 1,528 | 1,811 | 2,728 | 4,124 | 410.1 | 474.8 | Receivables | 282.1 | 864.3 | 1,188 | 1,632 |
| Gross Profit | 2,281 | 3,688 | 5,484 | 6,952 | 860.3 | 975.9 | Inventories | 288.1 | 450.2 | 618.5 | 849.8 |
| EBITDA | 2,624 | 4,038 | 5,987 | 7,853 | 967.5 | 1,055 | Investments | 473.1 | 514.5 | 514.5 | 514.5 |
| Depreciation | 679.7 | 765.0 | 1,129 | 1,756 | 198.5 | 188.1 | Fixed Assets | 3,692 | 4,973 | 6,395 | 7,828 |
| Amortisation | 8.4 | 9.2 | 9.4 | 10.2 | 2.4 | 2.4 | Intangibles | 49.9 | 49.5 | 49.5 | 49.5 |
| EBIT | 1,936 | 3,263 | 4,849 | 6,086 | 766.6 | 864.2 | Other Assets | 380.1 | 314.8 | 348.4 | 394.7 |
| Net Interest Income | 93.4 | 103.6 | 101.2 | 159.3 | 27.0 | 23.8 | Total Assets | 7,933 | 11,481 | 16,108 | 21,994 |
| Associates | 5.5 | 5.7 | 5.2 | 4.0 | 1.4 | 1.3 | Payables | 767.6 | 1,711 | 2,350 | 3,229 |
| Exceptionals | 0.0 | 0.0 | 0.0 | 0.0 | 0.0 | 0.0 | Short Term Debt | 136.9 | 174.6 | 217.4 | 255.5 |
| Forex Gains / Losses | 13.8 | 6.2 | 0.0 | 0.0 | 0.0 | 0.0 | Long Term Debt | 896.1 | 1,091 | 1,359 | 1,597 |
| Other Pre-Tax Income | (7.1) | 62.3 | 0.0 | 0.0 | 67.4 | 0.0 | Other Liabilities | 671.7 | 743.5 | 979.3 | 1,303 |
| Pre-Tax Profit | 2,042 | 3,441 | 4,956 | 6,250 | 862.4 | 889.3 | Total Liabilities | 2,472 | 3,720 | 4,906 | 6,385 |
| Tax Expense | (326.3) | (573.2) | (817.7) | (1,062) | (155.6) | (142.3) | Shareholders' Funds | 5,363 | 7,609 | 11,049 | 15,457 |
| Net Profit | 1,715 | 2,868 | 4,138 | 5,187 | 706.8 | 747.0 | Minority Interests | 41.2 | 41.4 | 41.4 | 41.4 |
| Minority Interests | 2.5 | 0.4 | 2.5 | (1.9) | (0.2) | 0.4 | Other | 56.8 | 111.1 | 111.1 | 111.1 |
| Reported Earnings | 1,718 | 2,868 | 4,141 | 5,185 | 706.6 | 747.5 | Total S/H Equity | 5,461 | 7,762 | 11,202 | 15,609 |
| Adjusted Earnings | 1,718 | 2,868 | 4,141 | 5,185 | 706.6 | 747.5 | Total Liab & S/H Funds | 7,933 | 11,481 | 16,108 | 21,994 |
| Basic Shares Outstanding | 25.9 | 25.9 | 25.9 | 25.9 | 25.9 | 25.9 | Net Debt / Equity (%) | (31.8) | (39.3) | (48.4) | (56.8) |
| Diluted Shares Outstanding | 25.9 | 25.9 | 25.9 | 25.9 | 25.9 | 25.9 | ROE (%) | 35.4 | 43.7 | 43.9 | 38.8 |
| EPS (rep) [TWD] | 66.2 | 110.6 | 159.7 | 200.0 | 27.2 | 28.8 | ROA (%) | 26.5 | 33.6 | 35.2 | 31.9 |
| Total DPS [TWD] | 18.0 | 23.0 | 27.0 | 30.0 | 6.0 | 6.0 | ROIC (%) | 50.6 | 73.0 | 85.9 | 87.3 |
| Ratio | 2025A | 2026E | 2027E | 2028E | Cash Flow Analysis | 2025A | 2026E | 2027E | 2028E | ||
| Revenue Growth (%) | 31.6 | 44.3 | 49.3 | 34.9 | - | - | EBITDA | 2,624 | 4,038 | 5,987 | 7,853 |
| EBITDA Growth (%) | 32.2 | 53.9 | 48.3 | 31.2 | - | - | Tax Paid | (326.3) | (573.2) | (817.7) | (1,062) |
| EBIT Growth (%) | 46.4 | 68.6 | 48.6 | 25.5 | - | - | Chgs in Working Cap | 34.2 | 363.8 | 350.3 | 481.0 |
| EPS Growth (adj) (%) | 46.4 | 67.0 | 44.3 | 25.2 | - | - | Net Interest Paid | 93.4 | 103.6 | 101.2 | 159.3 |
| Gross Profit Margin (%) | 59.9 | 67.1 | 66.8 | 62.8 | - | - | Other | (150.5) | (67.9) | 7.7 | 2.1 |
| EBITDA Margin (%) | 68.9 | 73.4 | 72.9 | 70.9 | - | - | Operating Cashflow | 2,275 | 3,864 | 5,629 | 7,433 |
| EBIT Margin (%) | 50.8 | 59.4 | 59.1 | 54.9 | - | - | Acquisitions | (29.7) | (41.4) | 0.0 | 0.0 |
| Net Profit Margin (%) | 45.1 | 52.2 | 50.4 | 46.8 | - | - | Capex | (1,272) | (1,978) | (2,560) | (3,200) |
| Payout Ratio (%) | 27.2 | 20.8 | 16.9 | 15.0 | - | - | Other | 157.7 | 35.3 | 0.0 | 0.0 |
| PE (rep) (x) | 36.8 | 22.1 | 15.3 | 12.2 | - | - | Investing Cashflow | (1,144) | (1,984) | (2,560) | (3,200) |
| EV/EBITDA (x) | 23.2 | 15.1 | 10.2 | 7.8 | - | - | Dividend (Ordinary) | (466.8) | (596.4) | (700.2) | (778.0) |
| EV/EBIT (x) | 31.4 | 18.7 | 12.6 | 10.0 | - | - | Equity Raised | 0.0 | 0.0 | 0.0 | 0.0 |
| Price/Book (x) | 11.7 | 8.2 | 5.7 | 4.1 | - | - | Debt Movements | 14.7 | 232.5 | 310.8 | 276.2 |
| Total Div Yield (%) | 0.7 | 0.9 | 1.1 | 1.2 | - | - | Other | 11.7 | (14.5) | 0.0 | 0.0 |
| Financing Cashflow | (440.3) | (378.4) | (389.4) | (501.8) | |||||||
| Net Chg in Cash/Debt | 640.2 | 1,547 | 2,679 | 3,731 | |||||||
| Free Cashflow | 1,003 | 1,886 | 3,069 | 4,233 |
Source: Company data, Macquarie Research Jul 2026
Figure 3 - TSMC 2Q26 result snapshot
| NT$m | 2Q26 | 1Q26 | 2Q25 | QoQ | YoY | MQ est | vs MQ | FCST cons | vs FCST | Guidance | vs Guidance |
|---|---|---|---|---|---|---|---|---|---|---|---|
| Revenue | 1,270,381 | 1,134,103 | 933,792 | 12% | 36% | 1,267,724 | 0% | 1,265,882 | 0% | 1,274,340 | 0% |
| Gross profit | 860,311 | 751,295 | 547,369 | 15% | 57% | 853,142 | 1% | 852,162 | 1% | 847,436 | 2% |
| Op profit | 766,603 | 658,966 | 463,424 | 16% | 65% | 736,338 | 4% | 743,745 | 3% | 732,746 | 5% |
| Pretax profit | 862,430 | 687,800 | 493,035 | 25% | 75% | 759,209 | 14% | 769,553 | 12% | ||
| Net profit | 706,562 | 572,480 | 398,273 | 23% | 77% | 637,735 | 11% | 626,821 | 13% | ||
| EPS (NT$) | 27.25 | 22.08 | 15.36 | 23% | 77% | 24.61 | 11% | 24.20 | 13% | ||
| Margin | |||||||||||
| Gross margin | 67.7% | 66.2% | 58.6% | 148 bps | 911 bps | 67.3% | 43 bps | 67.3% | 41 bps | 66.5% | 123 bps |
| OP margin | 60.3% | 58.1% | 49.6% | 224 bps | 1072 bps | 58.1% | 227 bps | 58.8% | 160 bps | 57.5% | 285 bps |
| Pretax margin | 67.9% | 60.6% | 52.8% | 725 bps | 1509 bps | 59.9% | 800 bps | 60.8% | 710 bps | ||
| Net margin | 55.6% | 50.5% | 42.7% | 514 bps | 1297 bps | 50.3% | 532 bps | 49.5% | 611 bps |
Source: TSMC, Macquarie research, Jul 2026
Figure 4 - TSMC revision snapshot
| (NT$m) | FY26 | FY26 | FY26 | FY27 | FY27 | FY27 | FY28 | FY28 | FY28 |
|---|---|---|---|---|---|---|---|---|---|
| New | old | change | New | old | change | New | old | change | |
| Revenue | 5,498,290 | 5,169,823 | 6% | 8,211,676 | 7,022,868 | 17% | 11,076,210 | 9,169,399 | 21% |
| Gross profit | 3,687,754 | 3,424,108 | 8% | 5,483,645 | 4,606,613 | 19% | 6,952,394 | 5,801,251 | 20% |
| Op profit | 3,263,494 | 2,958,291 | 10% | 4,849,395 | 3,933,686 | 23% | 6,086,238 | 4,892,183 | 24% |
| Pretax profit | 3,441,259 | 3,061,753 | 12% | 4,955,783 | 4,031,181 | 23% | 6,249,566 | 5,031,657 | 24% |
| Net profit | 2,868,452 | 2,566,922 | 12% | 4,140,556 | 3,366,036 | 23% | 5,185,265 | 4,176,275 | 24% |
| Margins | |||||||||
| Gross margin | 67.1% | 66.2% | 84 bps | 66.8% | 65.6% | 119 bps | 62.8% | 63.3% | -50 bps |
| Op margin | 59.4% | 57.2% | 214 bps | 59.1% | 56.0% | 305 bps | 54.9% | 53.4% | 160 bps |
| Net margin | 52.2% | 49.7% | 252 bps | 50.4% | 47.9% | 250 bps | 46.8% | 45.5% | 127 bps |
Source: TSMC, Macquarie research, Jul 2026
Figure 5 - TSMC: Quarterly income statement
| NT$ bn | 1Q26 | 2Q26E | 3Q26E | 4Q26E | 1Q27E | 2Q27E | 3Q27E | 4Q27E | 1Q28E | 2Q28E | 3Q28E | 4Q28E |
|---|---|---|---|---|---|---|---|---|---|---|---|---|
| Revenue | 1,134.1 | 1,270.4 | 1,450.7 | 1,643.1 | 1,842.4 | 1,990.7 | 2,120.8 | 2,257.7 | 2,465.3 | 2,666.4 | 2,842.7 | 3,101.8 |
| Gross profit | 751.3 | 860.3 | 975.9 | 1,100.2 | 1,244.8 | 1,338.3 | 1,411.5 | 1,489.0 | 1,565.1 | 1,672.4 | 1,770.0 | 1,945.0 |
| Operating profit | 659.0 | 766.6 | 864.2 | 973.7 | 1,103.0 | 1,184.8 | 1,247.5 | 1,314.1 | 1,372.0 | 1,463.9 | 1,547.6 | 1,702.8 |
| Pretax income | 687.8 | 862.4 | 889.3 | 1,001.7 | 1,125.0 | 1,209.7 | 1,275.6 | 1,345.4 | 1,406.6 | 1,502.6 | 1,590.4 | 1,750.1 |
| Net income | 572.5 | 706.6 | 747.5 | 841.9 | 940.0 | 1,010.7 | 1,065.8 | 1,124.1 | 1,167.0 | 1,246.7 | 1,319.6 | 1,452.0 |
| EPS (NT$) | 22.08 | 27.25 | 28.82 | 32.47 | 36.25 | 38.98 | 41.10 | 43.35 | 45.00 | 48.07 | 50.88 | 55.99 |
| DPS (NT$) | 5.00 | 6.00 | 6.00 | 6.00 | 6.50 | 6.50 | 7.00 | 7.00 | 7.50 | 7.50 | 7.50 | 7.50 |
| Margins | ||||||||||||
| Gross Margin | 66.2% | 67.7% | 67.3% | 67.0% | 67.6% | 67.2% | 66.6% | 66.0% | 63.5% | 62.7% | 62.3% | 62.7% |
| Opex ratio | -8.1% | -7.4% | -7.7% | -7.7% | -7.7% | -7.7% | -7.7% | -7.7% | -7.8% | -7.8% | -7.8% | -7.8% |
| EBIT | 58.1% | 60.3% | 59.6% | 59.3% | 59.9% | 59.5% | 58.8% | 58.2% | 55.7% | 54.9% | 54.4% | 54.9% |
| EBITDA | 72.7% | 76.2% | 72.7% | 72.5% | 73.1% | 73.1% | 72.9% | 72.6% | 71.8% | 70.8% | 70.5% | 70.7% |
| Net Margin | 50.5% | 55.6% | 51.5% | 51.2% | 51.0% | 50.8% | 50.3% | 49.8% | 47.3% | 46.8% | 46.4% | 46.8% |
| YoY | ||||||||||||
| Revenue | 35% | 36% | 47% | 57% | 62% | 57% | 46% | 37% | 34% | 34% | 34% | 37% |
| Gross profit | 52% | 57% | 66% | 69% | 66% | 56% | 45% | 35% | 26% | 25% | 25% | 31% |
| Operating profit | 62% | 65% | 73% | 72% | 67% | 55% | 44% | 35% | 24% | 24% | 24% | 30% |
| Net income | 58% | 77% | 65% | 66% | 64% | 43% | 43% | 34% | 24% | 23% | 24% | 29% |
| EPS (NT$) | 58% | 77% | 65% | 66% | 64% | 43% | 43% | 34% | 24% | 23% | 24% | 29% |
| QoQ | ||||||||||||
| Revenue | 8% | 12% | 14% | 13% | 12% | 8% | 7% | 6% | 9% | 8% | 7% | 9% |
| Gross profit | 15% | 15% | 13% | 13% | 13% | 8% | 5% | 5% | 5% | 7% | 6% | 10% |
| Operating profit | 17% | 16% | 13% | 13% | 13% | 7% | 5% | 5% | 4% | 7% | 6% | 10% |
| Net income | 13% | 23% | 6% | 13% | 12% | 8% | 5% | 5% | 4% | 7% | 6% | 10% |
| EPS (NT$) | 13% | 23% | 6% | 13% | 12% | 8% | 5% | 5% | 4% | 7% | 6% | 10% |
Source: TSMC, Macquarie research, Jul 2026
30
3000
27
24
2500
21
18
1500 -
15
12
9
1000
6
500
3
0
Jan-21
Figure 6 - TSMC: Capex to revenue ratio
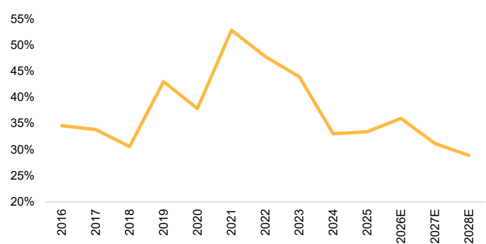
Source: TSMC, Macquarie research, Jul 2026
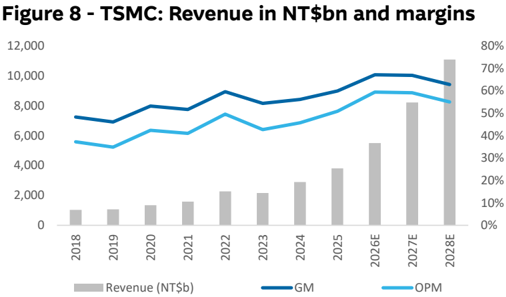
Source: TSMC, Macquarie research, Jul 2026
Figure 10 - TSMC: 12-month forward PEx
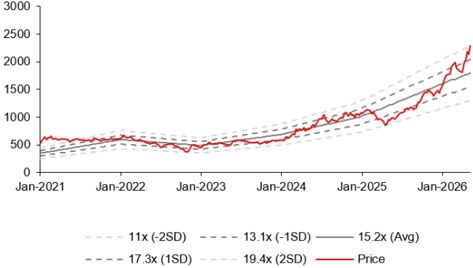
Source: Factset, Macquarie research, Jul 2026
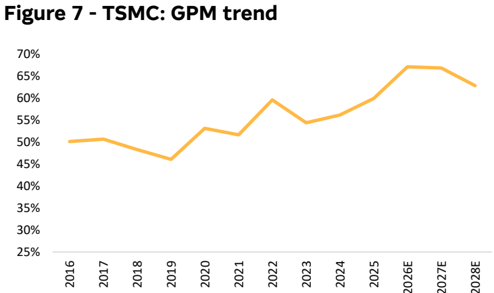
Source: TSMC, Macquarie research, Jul 2026
Figure 9 - TSMC: Wafer shipment, ASP
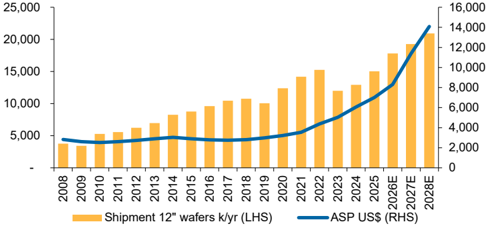
Source: TSMC, Macquarie research, Jul 2026
Figure 11 - TSMC: 12-month Forward PE band
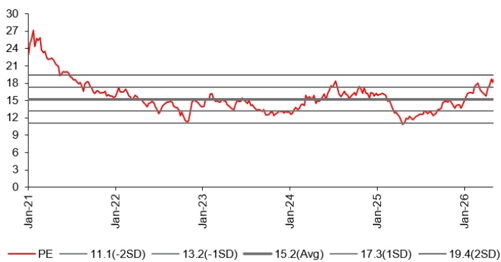
Source: Factset, Macquarie research, Jul 2026
Key Quant Findings (top 5% of the Macquarie Quant Alpha model)
The quant model currently holds a strong positive view on TSMC. The strongest style exposure is Profitability, indicating this stock is efficiently converting investments to earnings; proxied by ratios like ROE or ROA. The weakest style exposure is Valuations, indicating this stock is over-priced in the market relative to its peers.
Macquarie Alpha Model: Key rankings
The Macquarie Quant's flagship Alpha model is a dynamic multi-factor model based on a staple of quant factors such as value, momentum, revisions, quality, and risk.
| Global | Market (Country) | Sector | |
|---|---|---|---|
| Whole Universe | Taiwan | Semiconductors & Semiconductor Equip. | |
| Macquarie Alpha Model | 1/18000 | 1/978 | 1/668 |
| Fundamental (Consensus) * | 2533/18000 | 59/978 | 110/668 |
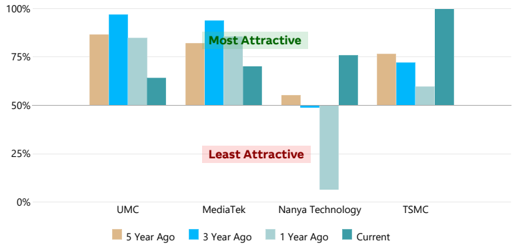
Current and Historical Alpha Model Rank
The chart shows the Macquarie Alpha model market ranking against the company's peers and over recent history.
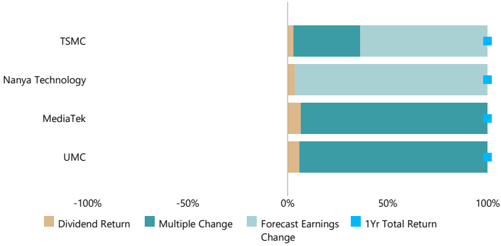
Drivers of Stock Return
Breakdown of 1-year total return (local currency) into returns from dividends, changes in forward earnings estimates and the resulting change in earnings multiple.
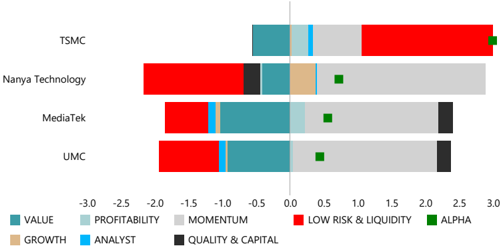
Alpha Model Decomposition
The Macquarie Alpha is decomposed into its sector and market relative factor & styles exposures (a higher/better percentile is coded in green, whilst lower in red).
| Percentile relative to | Percentile relative to | ||
|---|---|---|---|
| Factors / Styles | sectors (/668) | market (/978) | Core factors in definition |
| ALPHA | 100% | 100% | Built from the styles below |
| VALUE | 66% | 16% | Book, CF, Yield, Earnings Multiples |
| ANALYST | 83% | 95% | Revisions (Earnings, Recommendations) |
| MOMENTUM | 39% | 86% | Price Momentum |
| GROWTH | 63% | 82% | EPS, Sales (Forecast, Historic) |
| PROFITABILITY | 96% | 98% | ROE, Margin, Asset Turnover |
| QUALITY | 81% | 90% | Accruals, Earn Stability, Cash Conversion |
| CAPITAL | 60% | 22% | Investment/Capex, Net share issuance |
| LIQUIDITY | 100% | 100% | Size, Turnover, Analyst Coverage |
| LOW RISK | 83% | 73% | Beta, Volatility, Earn.Cert, Leverage |
| TECHNICAL | 35% | 46% | MACD, RSI, Bollinger, Williams R, etc |
Factors driving the Alpha Model vs peers
For the comparable firms this chart shows the key underlying styles and their contribution to the current overall raw Alpha score.
Macquarie Style Returns over last year
Recent performance to Macquarie style factors
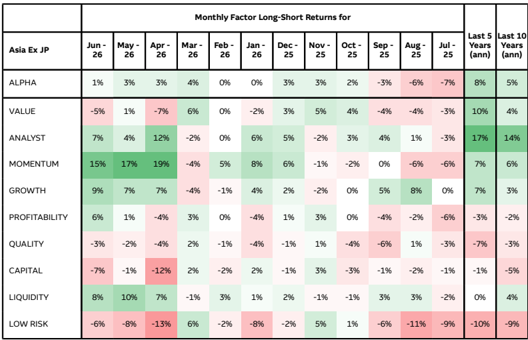
| Monthly Factor Long-Short Returns for | Monthly Factor Long-Short Returns for | Monthly Factor Long-Short Returns for | Monthly Factor Long-Short Returns for | Monthly Factor Long-Short Returns for | Monthly Factor Long-Short Returns for | Monthly Factor Long-Short Returns for | Monthly Factor Long-Short Returns for | Monthly Factor Long-Short Returns for | Monthly Factor Long-Short Returns for | Monthly Factor Long-Short Returns for | Monthly Factor Long-Short Returns for | |||
|---|---|---|---|---|---|---|---|---|---|---|---|---|---|---|
| Asia Ex JP | Jun - 26 | May - 26 | Apr - 26 | Mar - 26 | Feb - 26 | Jan - 26 | Dec - 25 | Nov - 25 | Oct - 25 | Sep - 25 | Aug - 25 | Jul - 25 | Last 5 Years (ann) | Last 10 Years (ann) |
| ALPHA | 1% | 3% | 3% | 4% | 0% | 0% | 3% | 3% | 2% | -3% | -6% | -7% | 8% | 5% |
| VALUE | -5% | 1% | -7% | 6% | 0% | -2% | 3% | 5% | 4% | -4% | -4% | -3% | 10% | 4% |
| ANALYST | 7% | 4% | 12% | -2% | 0% | 6% | 5% | -2% | 3% | 4% | 1% | -3% | 17% | 14% |
| MOMENTUM | 15% | 17% | 19% | -4% | 5% | 8% | 6% | -1% | -2% | 0% | -6% | -6% | 7% | 6% |
| GROWTH | 9% | 7% | 7% | -4% | -1% | 4% | 2% | -2% | 0% | 5% | 8% | 0% | 7% | 3% |
| PROFITABILITY | 6% | 1% | -4% | 3% | 0% | -4% | 1% | 3% | 0% | -4% | -2% | -6% | -3% | -2% |
| QUALITY | -3% | -2% | -4% | 2% | -1% | -4% | -1% | 1% | -4% | -6% | 1% | -3% | -7% | -3% |
| CAPITAL | -7% | -1% | -12% | 2% | -2% | 2% | -1% | 3% | -3% | -1% | -2% | -1% | -1% | -5% |
| LIQUIDITY | 8% | 10% | 7% | -1% | 3% | 1% | 2% | -1% | -1% | 3% | 3% | -2% | 0% | 4% |
| LOW RISK | -6% | -8% | -13% | 6% | -2% | -8% | -2% | 5% | 1% | -6% | -11% | -9% | -10% | -9% |
Source (all charts): FactSet, Refinitiv, and Macquarie Quant. For more details on the Macquarie Alpha model or for more customised analysis and screens, please contact the Macquarie Global Quantitative Team: maccapequitiesresearchquantglobal@macquarie.com. Explanation for items on this page can be found at https://www.macquarieinsights.com/rp/d/r/p/OTUyMzg1
Analysts
Arthur Lai
852 3922 4216
art.lai@macquarie.com
Macquarie Capital Limited