PDF 原檔:報告_Macquarie_中砂1560_20260811_original.pdf
圖片清單(已驗證 2026-08-13)
| 檔名 | size | 分類 | 親眼所見內容 |
|---|---|---|---|
260811_mq_kinik_001.png |
42KB | 真資料圖 | 中砂股價(藍線,左軸)vs TAIEX 相對表現(橘線,右軸)+ 目標價調升點(綠點),2024-03 至 2026-08,下方評等區間橫條 |
260811_mq_kinik_003.png |
48KB | 真資料圖 | 營收結構堆疊柱狀圖(2019-2028E):ABU/DBU/SBU/Others 各占比逐年變化,DBU 占比自 2019 年 27% 升至 2028E 47% |
260811_mq_kinik_004.png |
101KB | 真資料圖 | 一年期遠期 PE 估值帶圖(2010-01 至 2026-07):股價(紅線)疊加 10x/15x/20x/25x/30x 倍數帶,2025-26 股價突破上緣 |
260811_mq_kinik_008.png |
81KB | 真資料圖 | Macquarie Quant 月度因子多空報酬表(Asia Ex JP,2025-08 至 2026-07 逐月 + 5年/10年年化):ALPHA/VALUE/ANALYST/MOMENTUM 等 10 項因子報酬率色階表 |
260811_mq_kinik_009.png |
56KB | 真資料圖 | 與 001 相同股價 vs TAIEX 走勢圖之局部重複輸出,右側評等歷史表僅存一列「2024-11-13 Outperform TWD420.00」(PDF 版面切割導致表格截斷) |
分類只有三類:
真資料圖/裝飾·logo·banner/文字卡。<40KB 未 Read 者免列(預設 logo,含260811_mq_kinik_002.png39KB、260811_mq_kinik_005.png24KB、260811_mq_kinik_006.png21KB、260811_mq_kinik_007.png25KB)。
原始內容
rec history
— 1560 [LH S] —
Outperform
1000.00
- Rel TAIEX [RHS) • Price Target
200.00
0.00
-240.00
220.00
120.00
100.00
80.00
Mar-24 Oct-24 Jun-25 Jan-26 Aug-26
Source: FactSet. Macauarie Research. Aua 2026 lalli fiaures in
Kinik
2Q26 record GPM; capacity target raised
Key Points
- GPM reached its highest level since 2022, driving an EPS beat despite slightly softer revenue.
- Diamond disk (DBU) demand is compounding on rising 2/1.4nm adoption. Management has raised the year-end capacity target to 70k+ (from 60k).
- Reclaimed wafer (SBU) is fully loaded with mix shifting to high-grade wafers. Multi-year advanced-node story is intact. Reiterate OP. TP to NT $946.
- 2Q26 beat with record GPM. 2Q26 rev increased +8.7% QoQ/+17.9% YoY to NT$2.49bn, 4.5% below MQe but largely in line with BBGe. GPM rose to 40.1%, the highest since 2022 and 360bps/270bps above MQe/ BBGe. EPS of NT$3.49 (+19% QoQ/+92% YoY) beat MQe/BBGe by 5%/8%. Mgt indicated that July rev and GPM tracked above 2Q26 level, suggesting high GPM for 2026E.
- DBU compounding in node migration. DBU grew 9.1% QoQ/26.1% YoY (31% of rev). At its largest customer, advanced products (5nm and below + advanced packaging) reached 61.2% of DBU rev. 2/1.6nm rev rose 84% QoQ and 1.4nm disks began shipping. Mgt raised year-end target to 70k+ (from 60k), with its largest customer asking for 200k/mth capacity planning in 2034. US IDM's disk demand continues to rise as more qualifications are approved.
- SBU full at 400kwpm, with special wafers ramping. SBU rose 4.4% QoQ (43% of rev). 12'' capacity rose to a fully-loaded 400kwpm from end-June (additions for high-grade wafers). Expansion to 430kwpm is planned for 2027. Special wafer shipments jumped from <10k to >50kwpm, and mgt targets ~50% share at a US memory customer (from 20-30%).
- ABU rebound and backside power delivery (BPD) adds content. ABU grew 16.3% QoQ on machine-tool recovery with selective price hikes. Mgt noted BPD lifts CMP steps and adds silicon-thinning wheel demand, benefiting DBU and ABU.
Earnings changes: We raise 2026/27/28E net profit 12%/14%/11%, reflecting better customer demand and faster capacity expansion.
Valuation: We raise our TP 11% to NT$946 (from NT$855) on an unchanged 35x 2028E PER (1SD above the post-2022 avg).
Catalysts: Next-generation node ramps at key customers; a stronger semiconductor demand outlook; new DBU client wins.
Investment Thesis and Recommendation
In our view, Kinik should benefit from the transition in transistor structure, particularly in advanced nodes where it holds a higher market share. We also expect incremental testing wafer demand from the commissioning of TSMC's new fabs to support Kinik's growth. Prior Kinik research.
Capital Goods
Taiwan
Arthur Lai
Katherine Zheng
| 1560 TT | Outperform |
|---|---|
| Price (at 11 Aug 2026) | TWD687.00 |
| 12-month target | TWD946.00 |
| 12-month TSR (%) | 38.9 |
| Volatility Index | High |
| Market Cap (Local) (m) | 102,312 |
| Market Cap (USD) (m) | 3,177 |
| Free Float (%) | 77 |
| 30-day avg turnover (USD) (m) | 32.0 |
Investment Fundamentals
| Year end 31 Dec | 2025A | 2026E | 2027E | 2028E |
|---|---|---|---|---|
| Revenue (m) | 8,149 | 10,594 | 13,478 | 15,602 |
| Revenue growth (%) | 16.1 | 30.0 | 27.2 | 15.8 |
| EBIT (m) | 1,303 | 2,564 | 3,777 | 4,700 |
| EBIT growth (%) | 12.8 | 96.8 | 47.3 | 24.4 |
| Reported profit (m) | 1,360 | 2,294 | 3,287 | 4,053 |
| Adjusted profit (m) | 1,360 | 2,294 | 3,287 | 4,053 |
| EPS rep [TWD] | 9.3 | 15.3 | 21.9 | 27.0 |
| EPS rep growth (%) | 30.5 | 65.2 | 42.8 | 23.3 |
| EPS adj [TWD] | 9.3 | 15.3 | 21.9 | 27.0 |
| EPS adj growth (%) | 30.4 | 65.1 | 42.9 | 23.3 |
| Net debt/equity (%) | (2.6) | 0.4 | (10.7) | (31.0) |
| ROA (%) | 10.7 | 18.0 | 23.0 | 23.9 |
| ROE (%) | 17.8 | 26.2 | 31.4 | 29.7 |
| PER rep (x) | 74.0 | 44.8 | 31.3 | 25.4 |
| PER adj (x) | 74.0 | 44.8 | 31.3 | 25.4 |
| P/BV (x) | 12.4 | 11.0 | 8.9 | 6.6 |
| Total div yield (%) | 0.7 | 1.0 | 1.3 | 0.0 |
Quant (rank vs. global sector)
1,608 / 2,744
1560 TT rel TAIEX performance, & rec history
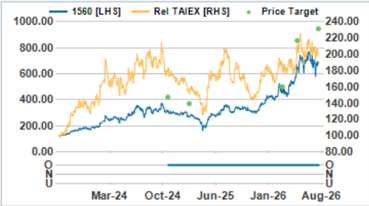
Source: FactSet, Macquarie Research, Aug 2026 (all figures in TWD unless noted, TP in TWD)
Key Risks to Investment Thesis
- Slower-than-expected ramp-up of TSMC's 2nm nodes.
- Lower-than-expected customer adoption of 2nm nodes at TSMC.
- Delays in the construction or commissioning of TSMC's new fabs.
- Loss of market share or weaker revenue and margins due to competition.
Figure 1 - Kinik: Revenue and margins
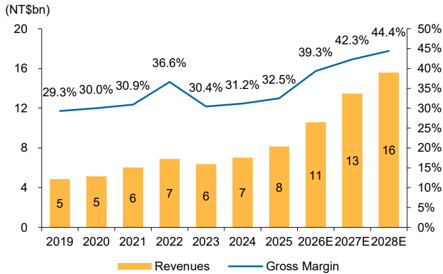
Source: Company data, Macquarie Research, August 2026
Kinik (1560 TT) TWD/(m) unless otherwise noted
| Income Statement Dec FY | 2025A | 2026E | 2027E | 2028E | Q2/26A | Q3/26E | Balance Sheet | 2025A | 2026E | 2027E | 2028E |
|---|---|---|---|---|---|---|---|---|---|---|---|
| Revenue | 8,149 | 10,594 | 13,478 | 15,602 | 2,493 | 2,838 | Cash | 1,573 | 1,539 | 2,858 | 6,546 |
| Cost of Goods Sold | 5,502 | 6,427 | 7,773 | 8,672 | 1,494 | 1,690 | Receivables | 1,433 | 1,961 | 2,380 | 2,651 |
| Gross Profit | 2,647 | 4,168 | 5,704 | 6,931 | 998.2 | 1,148 | Inventories | 2,431 | 2,979 | 3,494 | 3,779 |
| EBITDA | 1,955 | 3,320 | 4,611 | 5,585 | 789.4 | 919.2 | Investments | 366.2 | 414.0 | 414.0 | 414.0 |
| Depreciation | 641.8 | 743.9 | 823.0 | 873.5 | 182.9 | 188.6 | Fixed Assets | 5,417 | 6,058 | 6,210 | 6,137 |
| Amortisation | 10.3 | 11.7 | 11.7 | 11.7 | 2.9 | 2.9 | Intangibles | 0.0 | 0.0 | 0.0 | 0.0 |
| EBIT | 1,303 | 2,564 | 3,777 | 4,700 | 603.7 | 727.6 | Other Assets | 2,037 | 2,319 | 2,258 | 2,196 |
| Net Interest Income | 3.5 | (12.3) | (12.3) | (12.3) | (3.1) | (3.1) | Total Assets | 13,258 | 15,270 | 17,613 | 21,723 |
| Associates | (4.1) | 0.2 | 0.0 | 0.0 | 0.0 | 0.0 | Payables | 490.4 | 600.9 | 704.8 | 762.2 |
| Exceptionals | 0.0 | 0.0 | 0.0 | 0.0 | 0.0 | 0.0 | Short Term Debt | 343.7 | 642.3 | 642.3 | 642.3 |
| Forex Gains / Losses | (20.2) | 31.6 | 0.0 | 0.0 | 0.0 | 0.0 | Long Term Debt | 1,010 | 940.4 | 940.4 | 940.4 |
| Other Pre-Tax Income | 376.3 | 250.2 | 255.2 | 255.2 | 63.8 | 63.8 | Other Liabilities | 2,926 | 3,383 | 3,383 | 3,383 |
| Pre-Tax Profit | 1,659 | 2,834 | 4,020 | 4,942 | 664.4 | 788.3 | Total Liabilities | 4,769 | 5,566 | 5,670 | 5,728 |
| Tax Expense | (262.1) | (496.8) | (683.3) | (840.2) | (128.6) | (134.0) | Shareholders' Funds | 8,178 | 9,426 | 11,666 | 15,719 |
| Net Profit | 1,397 | 2,337 | 3,336 | 4,102 | 535.8 | 654.3 | Minority Interests | 344.0 | 341.6 | 341.6 | 341.6 |
| Minority Interests | (36.6) | (42.9) | (49.5) | (49.5) | (12.4) | (12.4) | Other | (33.2) | (64.2) | (64.2) | (64.2) |
| Reported Earnings | 1,360 | 2,294 | 3,287 | 4,053 | 523.4 | 641.9 | Total S/H Equity | 8,489 | 9,704 | 11,943 | 15,996 |
| Adjusted Earnings | 1,360 | 2,294 | 3,287 | 4,053 | 523.4 | 641.9 | Total Liab & S/H Funds | 13,258 | 15,270 | 17,613 | 21,723 |
| Basic Shares Outstanding | 146.6 | 150.0 | 150.0 | 150.0 | 150.0 | 150.0 | Net Debt / Equity (%) | (2.6) | 0.4 | (10.7) | (31.0) |
| Diluted Shares Outstanding | 146.4 | 149.5 | 150.0 | 150.0 | 150.0 | 150.0 | Interest Cover (x) | NM | 207.7 | 305.9 | 380.6 |
| EPS (rep) [TWD] | 9.3 | 15.3 | 21.9 | 27.0 | 3.5 | 4.3 | ROE (%) | 17.8 | 26.2 | 31.4 | 29.7 |
| EPS (adj) [TWD] | 9.3 | 15.3 | 21.9 | 27.0 | 3.5 | 4.3 | ROA (%) | 10.7 | 18.0 | 23.0 | 23.9 |
| Total DPS [TWD] | 5.0 | 7.0 | 9.0 | 0.0 | 0.0 | 7.0 | ROIC (%) | 16.7 | 25.6 | 32.2 | 36.6 |
| Ratio | 2025A | 2026E | 2027E | 2028E | Cash Flow Analysis | 2025A | 2026E | 2027E | 2028E | ||
| Revenue Growth (%) | 16.1 | 30.0 | 27.2 | 15.8 | - | - | EBITDA | 1,955 | 3,320 | 4,611 | 5,585 |
| EBITDA Growth (%) | 12.8 | 69.8 | 38.9 | 21.1 | - | - | Tax Paid | (262.1) | (496.8) | (683.3) | (840.2) |
| EBIT Growth (%) | 12.8 | 96.8 | 47.3 | 24.4 | - | - | Chgs in Working Cap | (580.1) | (966.2) | (830.5) | (498.8) |
| EPS Growth (adj) (%) | 30.4 | 65.1 | 42.9 | 23.3 | - | - | Net Interest Paid | 3.5 | (12.3) | (12.3) | (12.3) |
| Gross Profit Margin (%) | 32.5 | 39.3 | 42.3 | 44.4 | - | - | Other | 797.3 | 247.2 | 255.2 | 255.2 |
| EBITDA Margin (%) | 24.0 | 31.3 | 34.2 | 35.8 | - | - | Operating Cashflow | 1,914 | 2,092 | 3,341 | 4,489 |
| EBIT Margin (%) | 16.0 | 24.2 | 28.0 | 30.1 | - | - | Acquisitions | (124.2) | 0.0 | 0.0 | 0.0 |
| Net Profit Margin (%) | 16.7 | 21.7 | 24.4 | 26.0 | - | - | Capex | (1,050) | (1,707) | (975.0) | (800.0) |
| Payout Ratio (%) | 53.8 | 45.7 | 41.1 | 0.0 | - | - | Other | (738.5) | (0.4) | 0.0 | 0.0 |
| PE (rep) (x) | 74.0 | 44.8 | 31.3 | 25.4 | - | - | Investing Cashflow | (1,913) | (1,707) | (975.0) | (800.0) |
| PE (adj) (x) | 74.0 | 44.8 | 31.3 | 25.4 | - | - | Dividend (Ordinary) | (584.2) | (732.4) | (1,047) | 0.0 |
| EV/EBITDA (x) | 51.5 | 31.0 | 22.3 | 18.4 | - | - | Equity Raised | 0.0 | 0.0 | 0.0 | 0.0 |
| EV/EBIT (x) | 77.3 | 40.1 | 27.2 | 21.9 | - | - | Debt Movements | (8.7) | 298.5 | 0.0 | 0.0 |
| Price/Book (x) | 12.4 | 11.0 | 8.9 | 6.6 | - | - | Other | 130.5 | 20.4 | 0.0 | 0.0 |
| Total Div Yield (%) | 0.7 | 1.0 | 1.3 | 0.0 | - | - | Financing Cashflow | (462.4) | (413.5) | (1,047) | 0.0 |
| Net Chg in Cash/Debt | (427.5) | (33.9) | 1,318 | 3,689 | |||||||
| Free Cashflow | 864.0 | 384.8 | 2,366 | 3,689 |
Source: Company data, Macquarie Research Aug 2026
Company Description
Kinik is a key supplier to TSMC regarding the CMP (chemical mechanical polish) process, holding a dominant share in the advanced nodes. Its products include grinding wheel, diamond disc, and reclaimed wafer. In 2000, Kinik entered TSMC supply chain with its diamond disc product, which is a key consumable to achieving higher yield in CMP process. Kinik gradually obtained more market share as TSMC migrated to more advanced nodes.
Figure 2 - Kinik: Revenue breakdown (NT$ m)
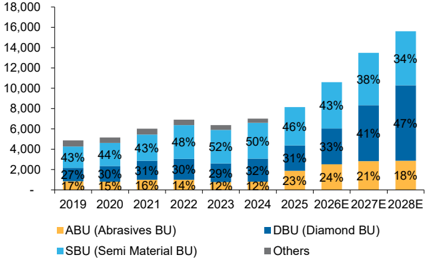
Source: Company data, Macquarie Research, August 2026
Figure 3 - 2Q26 earnings summary
| NT$m | 2Q26 | 1Q26 | 2Q25 | QoQ% | YoY% | MACQ | Diff% | BBG | Diff% |
|---|---|---|---|---|---|---|---|---|---|
| Revenue | 2,493 | 2,293 | 2,115 | 8.7% | 17.9% | 2,609 | -4.5% | 2,500 | -0.3% |
| Gross profit | 998 | 803 | 680 | 24.4% | 46.9% | 949 | 5.2% | 932 | 7.0% |
| GM% | 40.0% | 35.0% | 32.1% | 36.4% | 37.3% | ||||
| Operating profit | 604 | 444 | 352 | 35.8% | 71.4% | 550 | 9.8% | 544 | 11.1% |
| OPM% | 24.2% | 19.4% | 16.7% | 21.1% | 21.7% | ||||
| Pretax income | 664 | 532 | 336 | 24.9% | 97.6% | 602 | 10.3% | 580 | 14.5% |
| Net income | 523 | 436 | 266 | 19.9% | 96.5% | 494 | 5.9% | 483 | 8.3% |
| Net margin | 21.0% | 19.0% | 12.6% | 18.9% | 19.3% | ||||
| EPS (NT$) | 3.49 | 2.94 | 1.82 | 18.7% | 91.8% | 3.33 | 4.8% | 3.23 | 8.1% |
Source: Company data, Bloomberg, Macquarie Research, August 2026
Figure 4 - Kinik: revisions to estimates
| NT$m | FY26 | FY26 | FY26 | FY27E | FY27E | FY27E | FY28E | FY28E | FY28E |
|---|---|---|---|---|---|---|---|---|---|
| New | Old | Change | New | Old | Change | New | Old | Change | |
| Revenue | 10,594 | 10,591 | 0% | 13,478 | 13,127 | 3% | 15,602 | 15,192 | 3% |
| Gross profit | 4,168 | 3,828 | 9% | 5,704 | 5,140 | 11% | 6,931 | 6,359 | 9% |
| Opex | -1,603 | -1,591 | 1% | -1,927 | -1,877 | 3% | -2,231 | -2,172 | 3% |
| Op profit | 2,564 | 2,238 | 15% | 3,777 | 3,263 | 16% | 4,700 | 4,187 | 12% |
| Non-op | -270 | -244 | 10% | -243 | -209 | 16% | -243 | -209 | 16% |
| Pretax profit | 2,834 | 2,482 | 14% | 4,020 | 3,472 | 16% | 4,942 | 4,396 | 12% |
| Net profit | 2,294 | 2,061 | 11% | 3,287 | 2,882 | 14% | 4,053 | 3,649 | 11% |
| EPS | 15.33 | 13.73 | 12% | 21.92 | 19.26 | 14% | 27.02 | 24.43 | 11% |
| Margins | |||||||||
| Gross profit | 39.3% | 36.1% | 320 bps | 42.3% | 39.2% | 317 bps | 44.4% | 41.9% | 257 bps |
| Op margin | 24.2% | 21.1% | 308 bps | 28.0% | 24.9% | 317 bps | 30.1% | 27.6% | 257 bps |
| Net margin | 21.7% | 19.5% | 220 bps | 24.4% | 22.0% | 244 bps | 26.0% | 24.0% | 196 bps |
Source: Macquarie Research, August 2026
Figure 5 - Kinik:12-month forward PE band (avg since 2022)
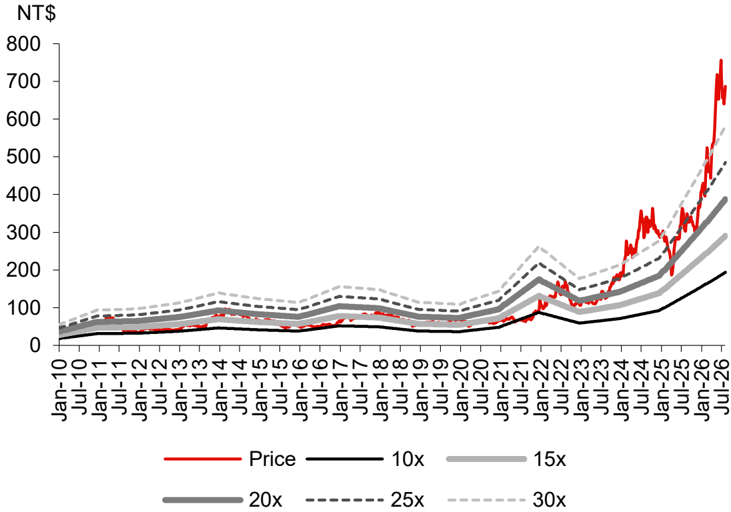
Source: Bloomberg, Macquarie Research, August 2026
Key Quant Findings
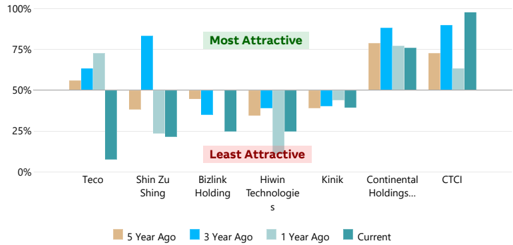
The quant model currently holds a neutral view on Kinik. The strongest style exposure is Price Momentum, indicating this stock has had strong medium to long term returns which often persist into the future. The weakest style exposure is Profitability, indicating this stock is not efficiently converting investments to earnings; proxied by ratios like ROE or ROA.
Macquarie Alpha Model: Key rankings
The Macquarie Quant's flagship Alpha model is a dynamic multi-factor model based on a staple of quant factors such as value, momentum, revisions, quality, and risk.
| Global Whole Universe | Market (Country) Taiwan | Sector Capital Goods | |
|---|---|---|---|
| Macquarie Alpha Model | 10980/17978 | 594/978 | 1608/2744 |
| Fundamental (Consensus) * | 3297/17978 | 92/978 | 498/2744 |
Current and Historical Alpha Model Rank
The chart shows the Macquarie Alpha model market ranking against the company's peers and over recent history.
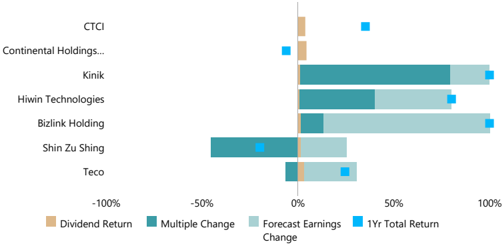
Drivers of Stock Return
Breakdown of 1-year total return (local currency) into returns from dividends, changes in forward earnings estimates and the resulting change in earnings multiple.
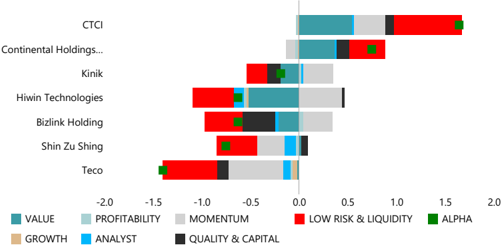
Alpha Model Decomposition
The Macquarie Alpha is decomposed into its sector and market relative factor & styles exposures (a higher/better percentile is coded in green, whilst lower in red).
| Percentile relative to | Percentile relative to | ||
|---|---|---|---|
| Factors / Styles | sectors (/2744) | market (/978) | Core factors in definition |
| ALPHA | 41% | 39% | Built from the styles below |
| VALUE | 44% | 12% | Book, CF, Yield, Earnings Multiples |
| ANALYST | 81% | 95% | Revisions (Earnings, Recommendations) |
| MOMENTUM | 82% | 91% | Price Momentum |
| GROWTH | 44% | 65% | EPS, Sales (Forecast, Historic) |
| PROFITABILITY | 42% | 81% | ROE, Margin, Asset Turnover |
| QUALITY | 28% | 42% | Accruals, Earn Stability, Cash Conversion |
| CAPITAL | 20% | 10% | Investment/Capex, Net share issuance |
| LIQUIDITY | 30% | 22% | Size, Turnover, Analyst Coverage |
| LOW RISK | 21% | 24% | Beta, Volatility, Earn.Cert, Leverage |
| TECHNICAL | 81% | 73% | MACD, RSI, Bollinger, Williams R, etc |
Factors driving the Alpha Model vs peers
For the comparable firms this chart shows the key underlying styles and their contribution to the current overall raw Alpha score.
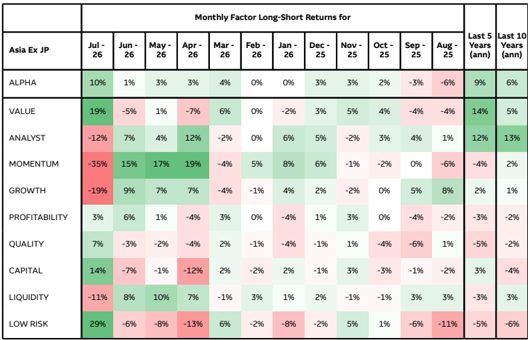
Macquarie Style Returns over last year
Recent performance to Macquarie style factors
| Monthly Factor Long-Short Returns for | Monthly Factor Long-Short Returns for | Monthly Factor Long-Short Returns for | Monthly Factor Long-Short Returns for | Monthly Factor Long-Short Returns for | Monthly Factor Long-Short Returns for | Monthly Factor Long-Short Returns for | Monthly Factor Long-Short Returns for | Monthly Factor Long-Short Returns for | Monthly Factor Long-Short Returns for | Monthly Factor Long-Short Returns for | Monthly Factor Long-Short Returns for | |||
|---|---|---|---|---|---|---|---|---|---|---|---|---|---|---|
| Asia Ex JP | Jul - 26 | Jun - 26 | May - 26 | Apr - 26 | Mar - 26 | Feb - 26 | Jan - 26 | Dec - 25 | Nov - 25 | Oct - 25 | Sep - 25 | Aug - 25 | Last 5 Years (ann) | Last 10 Years (ann) |
| ALPHA | 10% | 1% | 3% | 3% | 4% | 0% | 0% | 3% | 3% | 2% | -3% | -6% | 9% | 6% |
| VALUE | 19% | -5% | 1% | -7% | 6% | 0% | -2% | 3% | 5% | 4% | -4% | -4% | 14% | 5% |
| ANALYST | -12% | 7% | 4% | 12% | -2% | 0% | 6% | 5% | -2% | 3% | 4% | 1% | 12% | 13% |
| MOMENTUM | -35% | 15% | 17% | 19% | -4% | 5% | 8% | 6% | -1% | -2% | 0% | -6% | -4% | 2% |
| GROWTH | -19% | 9% | 7% | 7% | -4% | -1% | 4% | 2% | -2% | 0% | 5% | 8% | 2% | 1% |
| PROFITABILITY | 3% | 6% | 1% | -4% | 3% | 0% | -4% | 1% | 3% | 0% | -4% | -2% | -3% | -2% |
| QUALITY | 7% | -3% | -2% | -4% | 2% | -1% | -4% | -1% | 1% | -4% | -6% | 1% | -5% | -2% |
| CAPITAL | 14% | -7% | -1% | -12% | 2% | -2% | 2% | -1% | 3% | -3% | -1% | -2% | 3% | -4% |
| LIQUIDITY | -11% | 8% | 10% | 7% | -1% | 3% | 1% | 2% | -1% | -1% | 3% | 3% | -3% | 3% |
| LOW RISK | 29% | -6% | -8% | -13% | 6% | -2% | -8% | -2% | 5% | 1% | -6% | -11% | -5% | -6% |
Source (all charts): FactSet, Refinitiv, and Macquarie Quant. For more details on the Macquarie Alpha model or for more customised analysis and screens, please contact the Macquarie Global Quantitative Team: maccapequitiesresearchquantglobal@macquarie.com. Explanation for items on this page can be found at https://www.macquarieinsights.com/rp/d/r/p/OTUyMzg1
Analysts
Arthur Lai
852 3922 4216 art.lai@macquarie.com Macquarie Capital Limited
Leo Tsai
+8862 2734 7559
leo.tsai@macquarie.com
Macquarie Capital Limited, Taiwan Securities Branch