PDF 原檔:報告_MS_CPO供應鏈_20260705_original.pdf
原始內容
M July 5, 2026 07:18 PM GMT
Greater China Semiconductors | Asia Pacific
CPO Supply Chain Updates; More on GlassBridge
GlassBridge appears to be a strong solution, but remains far from mass production. We see TSMC scaling PIC capacity to 25kwpm in 2028, with Ins2 test efficiency improving. We remain OW on CPO enablers as investor expectations are already low.
Further thoughts on GlassBridge impact on FAU: We do not rule out GlassBridge hampering Fiber Array Units' (FAU) TAM in the long run (link), but we have yet see any projects in TSMC's COUPE platform adopt this technology. On the other hand, GlassBridge mainly serves edge coupling and can currently support only one -dimension fiber layouts. However, TSMC's mainstream COUPE platform and key customer (NVIDIA, AMD, Ayar Labs) solutions for the next few years should still stick to grating coupling, as it is easier to achieve mass production, which we expect to see soon in 2H26. In addition, CPO requires integrated design and discussion across the entire ecosystem-including foundry (OE), chip designer, FAU, laser, and even system integrator-so it is difficult to change a design overnight.
Latest developments on PIC capacity: Although several difficulties remain (link), we continue to see green shoots. TSMC plans to ramp PIC capacity from 10kwpm in 2Q26 to 15kwpm in 4Q26, and to at least 25kwpm in 2028. Reflecting limited resources, we believe key COUPE MP customers in 2026-27 could be NVIDIA, Broadcom, and AMD. With more capacity seen for 2028, other customers such as MediaTek, Marvell, and Ayar Labs could mass produce their CPO projects at TSMC.
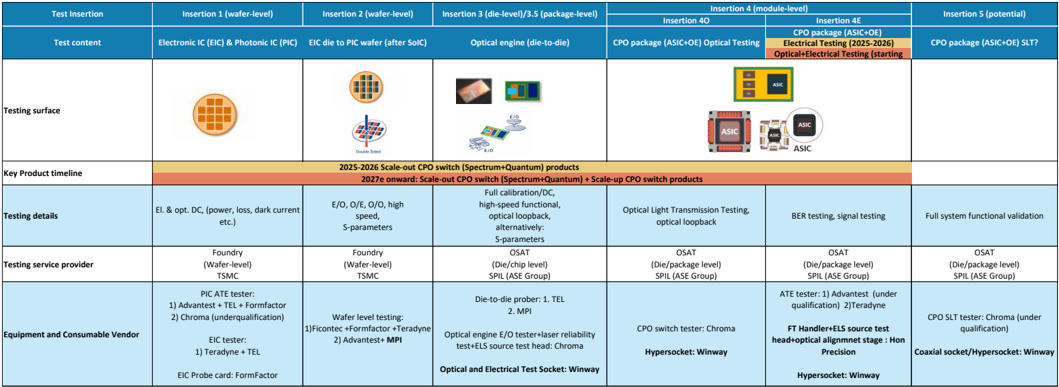
What about the progress in CPO insertion tests? CPO insertion tests are one of the key bottlenecks to mass production. However, Insertion 2 EPIC wafer test time has improved from a wafer a day in 2H25 to a wafer in six hours now, making the 34 hour target in the next 6-12 months no longer a distant dream. Many investors ask whether Insertion 2 could be a skipped process, but we regard this as less likely as it is the first stop/time to conduct simultaneous optical -electrical signal testing.
FOCI - CPO mass production to start in 3Q: We expect CPO MP revenue to begin in July and continue scaling to 2027, mainly for the Spectrum CPO switch. Besides NVIDIA, we expect its FAU shipments to AMD's MI500 series to start from 2H27, along with more MP customers in 2028.
Stock implications: We remain optimistic about CPO development in the long run, and think investor expectations are very low for CPO stocks. We are OW on Asia CPO enablers such as TSMC, ASE , FOCI, AllRing, MPI, Winway, and Hon Precision. We think TFC has a competitive edge in high-end FAU, and is less likely to face disruption from GlassBridge as it is more likely to replace low-end FAU at the initial stage. We believe Largan could face more competition if V-Groove is the major product, but if it is making the entire FAU, it needs to show competitiveness vs. existing players. In this report, we revise estimates for FOCI and AllRing.
Idea
| Morgan Stanley Taiwan Limited+ Tiffany Yeh Equity Analyst Tiffany.Yeh@morganstanley.com | +886 2 7712-3032 |
|---|---|
| Charlie Chan Equity Analyst Charlie.Chan@morganstanley.com Morgan Stanley Asia Limited+ | +886 2 2730-1725 |
| Andy Meng, CFA Equity Analyst Andy.Meng@morganstanley.com | +852 2239-7689 |
| Meta A Marshall Equity Analyst Meta.Marshall@morganstanley.com Morgan Stanley Taiwan Limited+ | +1 212 761-0430 |
| Daniel Yen, CFA Equity Analyst Daniel.Yen@morganstanley.com | +886 2 2730-2863 |

Greater China Technology Semiconductors
Asia Pacific
Industry View
Attractive
Morgan Stanley does and seeks to do business with companies covered in Morgan Stanley Research. As a result, investors should be aware that the firm may have a conflict of interest that could affect the objectivity of Morgan Stanley Research. Investors should consider Morgan Stanley Research as only a single factor in making their investment decision.
For analyst certification and other important disclosures, refer to the Disclosure Section, located at the end of this report.
+= Analysts employed by non-U.S. affiliates are not registered with FINRA, may not be associated persons of the member and may not be subject to FINRA restrictions on communications with a subject company, public appearances and trading securities held by a research analyst account.
CAInvlL 1.
uullmlyo Thururu uetmunlotaulurl
Fiber Array Units
M
CXIbll c. TAu uemunlotaulull dl vultiputex lul Ayal Laus scale-up solution
wiwynni
What Is GlassBridge, and How Does It Differ from Traditional V-Groove FAU? alchip FlexConnecat A7K#А AAU 10 minHMTo o 0)
80ch FAU
40ch FAU (Beam Expanded)
SENKO
64ch FAU
12ch FAU
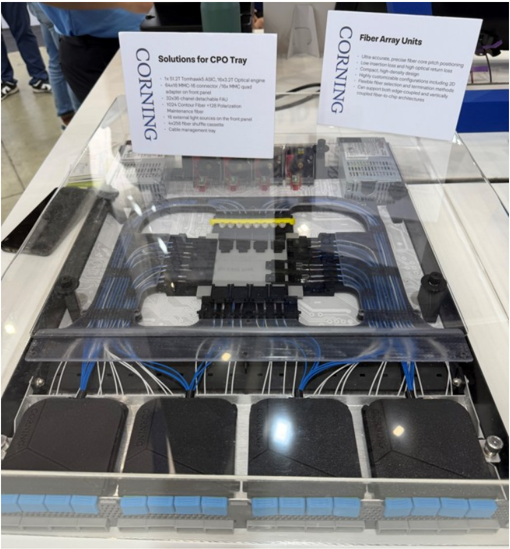
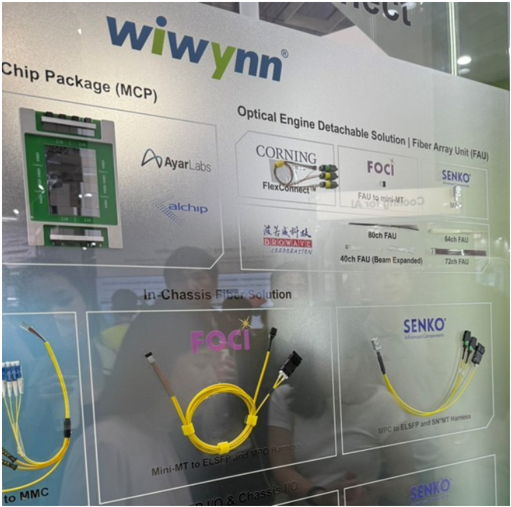
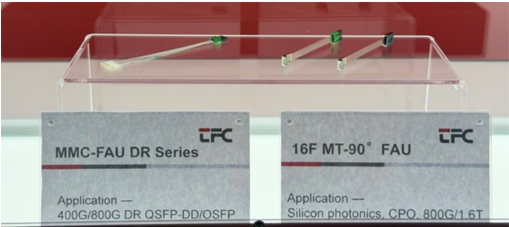
Traditional FAU is a mature, high-precision fiber-array assembly: fibers are placed into Vgrooves on a glass/silicon/quartz substrate, fixed with a cover and adhesive, polished, and then aligned to a PIC or optical engine. It is proven, customizable, and very low-loss, but assembly becomes more difficult as channel count and density rise. Key FAU suppliers for CPO include vendors such as TFC Communication, FOCI, Senko, Browave and Sumitomo Electric. Corning has also said it is keen to develop several FAU solutions for CPO and NPO. id MPO Hame
Exhibit 1: Corning's FAU/CPO demonstration
Source: Corning, Morgan Stanley Research
to MMC
BROWAME
Mini-MT to ELS
Exhibit 2: FAU demonstration at Computex for Ayar Labs scale-up solution
Source: Wiwynn
Source: TFC
ITUS ThU
Classollege toellute
CORNING
manufacturing, customizable pitches, detachable solutions and passive alignments as the key advantages of GlassBridge
M
MMC-FAU DR Series
Exhibit 3: TFC's FAU
Source: Corning
Source: TFC
Supporting Future-Ready NPO and CPO Architectures
Flexible PIC-level integration enables
GlassBridge" solutions to scale with evolving customer channel-density requirements.
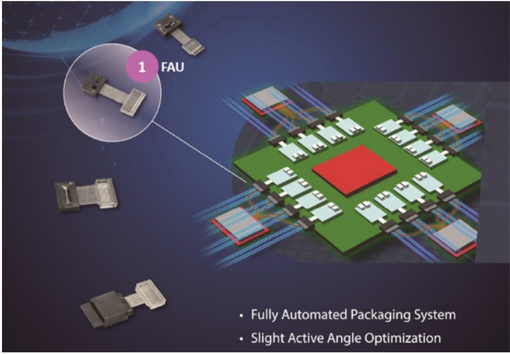
Exhibit 4: FOCI's FAU solution for CPO
Supports customized system architectures and the integration of multiple GlassBridge
elements on a single PIC.
Couran. Morninal
Source: FOCI
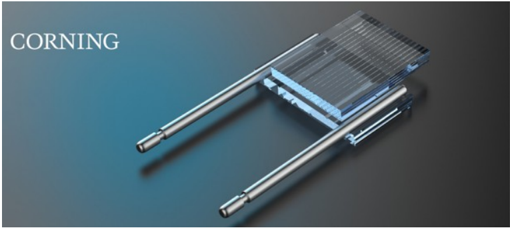
Corning GlassBridge is a newer wafer-based glass interposer / connector approach. Instead of directly presenting a fiber array to the PIC edge, it uses glass ion-exchange waveguides and a detachable, passively aligned connector interface to bridge fiber to PIC. Corning positions it for NPO, CPO, and high-density photonic modules where manufacturability, reworkability, and density become major constraints.
Exhibit 5: GlassBridge Fiber-to-PIC Connector
Source: Corning
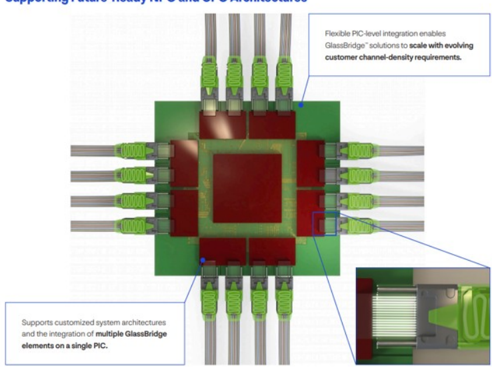
Exhibit 6: Corning cites wafer-based high-volume manufacturing, customizable pitches, detachable solutions and passive alignments as the key advantages of GlassBridge
Source: Corning
The main difference is not simply 'new FAU vs old FAU.' It is connectorized glass waveguide bridge vs. direct fiber-array attach.
A traditional FAU tries to solve the alignment problem by making the fiber array itself extremely accurate. The fibers are held in V-grooves, polished, and aligned to the optical chip. This is a direct and proven method. FOCI describes the fiber array as a carrier using V-grooves to fix multi-core fiber, with optical-path positioning determined by the precision
FAU
vulmleulul
M
V-groove and packaging/polishing process.
GlassBridge inserts a glass waveguide connector layer between the fiber side and the PIC side. That gives Corning more design freedom for pitch conversion, compact connector geometry, passive alignment, and detachability. Corning describes GlassBridge as using wafer-based glass ion-exchange waveguides for passive fiber-to-PIC coupling, and as an alternative that improves scalability and system integration at high fiber counts.
GlassBridge may not automatically be 'lower loss' than a conventional FAU. Corning's brochure cites 1.5 dB O-band fiber-to-PIC coupling for GlassBridge, while traditional FAU component insertion loss can be far lower, although the final fiber-to-PIC coupling loss depends on the full assembly.
For today's conventional transceivers, PLC/PIC coupling, coherent optics, and many datacenter modules, traditional FAU from suppliers such as TFC, FOCI, Senko and others remains the mainstream solution. For next-generation CPO/NPO optical engines, where hundreds of optical lanes, tight PIC shoreline density, reflow-compatible assembly, testability, and field/service rework become critical, GlassBridge is a more system-level, connectorized architecture rather than just another FAU. It seems better viewed as a way to reduce the scaling pain of FAU-style direct attach, not as a universal replacement for every FAU use case.
Exhibit 7: Side-by-side comparison: Corning GlassBridge vs. Traditional FAU
| Dimension | Corning GlassBridge | Traditional FAU (TFC / FOCI style) | Implication |
|---|---|---|---|
| Basic concept | Wafer-based glass connector/interposer using glass waveguides between fiber interface and PIC. | Direct fiber array: fibers fixed into precision V-grooves, bonded with cover/adhesive, and polished. | GlassBridge is more of a connectorized optical bridge; FAU is direct physical fiber positioning. |
| Coupling model | Fiber-to-PIC coupling through glass waveguides and passive alignment features. | Fiber cores are positioned mechanically by V-groove geometry and then aligned to chip/waveguide facets. | GlassBridge shifts some coupling complexity into a designed glass-waveguide interface. |
| Support | Edge Coupling | Could support both Grating and Edge Coupling | Traditional FAU could support both solution, which Grating coupling is the mainstream solution that TSMC's COUPE is adopting. |
| Manufacturing approach | Wafer-based glass processing with ion-exchange waveguides and scalable connector fabrication. | Precision dicing/cutting of substrate, fiber placement, adhesive bonding, cover attachment, polishing, and inspection. | GlassBridge is designed for scalable module assembly; FAU is mature but labor/process intensive at high counts, but now also migrating to automation. |
| Pitch flexibility | Supports pitch conversion between fiber pitch and fine PIC waveguide pitch, e.g., 40/80/127/165 µm classes. | Highly customizable pitches such as 127/250 µm or reduced- clad options, but physical fiber pitch limits remain important. | GlassBridge can act like an optical redistribution layer between fiber and PIC. |
| Optical loss | Published positioning emphasizes system-level fiber-to-PIC coupling; cited example around 1.5 dB O-band fiber-to-PIC coupling. | FAU component insertion loss can be very low; final fiber-to- PIC loss depends heavily on PIC facet, mode converter, gap, angle, and alignment. | Traditional FAU may win on component-level loss, while GlassBridge targets integration yield and density. |
| Thermal / assembly compatibility | Marketed as compatible with advanced module assembly including solder-reflow-compatible workflows. | Reliability depends on substrate, adhesive, fiber, and package process; many FAUs are qualified for telecom/datacom environments. | GlassBridge is attractive when optical attach must fit electronics-like assembly flows. |
| Customization | Likely more standardized around connector/PIC interface architectures and Corning's glass process platform. | Very customizable: fiber type, pitch, channel count, polishing angle, PMfiber, substrate material, termination, and packaging. | FAU remains strong for custom optical modules and specialized fiber-array needs. |
| Supply-chain maturity | Newer architecture; adoption tied to next-generation PIC/CPO ecosystems. | Long-established supplier base and manufacturing know- how across telecom/datacom/CPO. | FAU is lower adoption risk today; GlassBridge may offer more future scalability. |
| Best application fit | CPO/NPO optical engines, dense PIC shoreline coupling, testable/reworkable modules, and pitch-conversion-heavy designs. | Transceivers, coherent modules, PLC/AWG/WSS/ROADM, silicon photonics attach, and permanent fiber coupling. | Choose based on whether the priority is integration scalability or mature direct attach. |
Source: Company data, Morgan Stanley Research
M
Key Charts for CPO Development
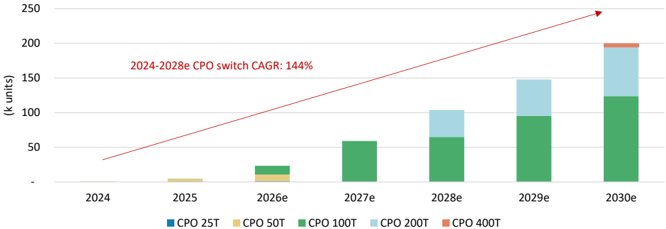
For 2026, we expect total CPO switch shipments to be 23k units, mostly 100T switches, with NVIDIA's Spectrum switch taking the lion's share.
Looking to 2027, we expect total CPO switch shipments to reach 59k units, growing further to 200k units in total in 2030; this implies a 144% CAGR over 2024-30.
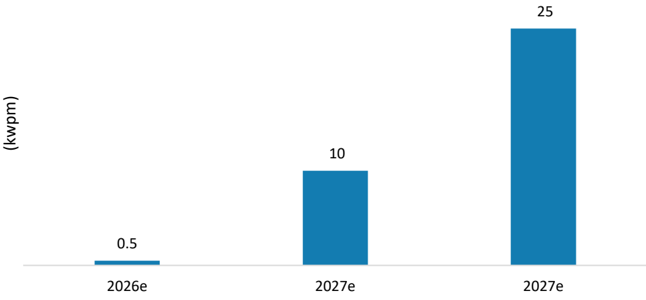
Our supply chain checks suggest that TSMC currently has ~500 wafers per month of PIC capacity. TSMC plans to ramp PIC capacity from 10kwpm in 2Q26 to 15kwpm in 4Q26 and to at least 25kwpm in 2028. Reflecting limited resources, we believe key COUPE MP customers in 2026-27 could be NVIDIA, Broadcom, and AMD. With more capacity in 2028, other customers such as MediaTek, Marvell, and Ayar Labs should also be able to massproduce their CPO projects at TSMC.
Exhibit 8: TSMC's PIC capacity: likely to reach 25 kwpm in 2027
TSMC PIC Capacity Planning
Source: Company data, Morgan Stanley Research (e) estimates
Exhibit 9: Annual optical engine output from PIC capacity planning; we think this is likely to increase over time as yield rate ramps
| 2026e | 2027e | 2027e | |
|---|---|---|---|
| TSMC PIC capacity (kwpm) | 0.5 | 10 | 25 |
| Die per wafer | 648 | 648 | 648 |
| Annual PIC production (mn) | 4 | 78 | 194 |
| SoIC yield rate | 50% | 50% | 50% |
| Optical engine production (mn) | 2 | 39 | 97 |
| Downstream assembly yield rate | 20% | 20% | 50% |
| Actual Optical engine shipment (mn) | 0.39 | 7.78 | 48.60 |
Source: Company data, Morgan Stanley Research (e) estimates
crectrical resting
Optical+Electrical T
Conventional Module Design
ASIC
Modules with Silicon Photonics
SiPh Chiplets In Module
M
manufacturing limits to scale to improved scale
Exhibit 10: CPO Insertion Test Flow
| Test Insertion | Insertion 1 (wafer-level) | Insertion 2 (wafer-level) | Insertion 3 (die-level)/3.5 (package-level) | Insertion 4 (module-level) | Insertion 4 (module-level) | Insertion 5 (potential) |
|---|---|---|---|---|---|---|
| Insertion 4O | Insertion 4E | |||||
| Test content | Electronic IC (EIC) & Photonic IC (PIC) EIC die to PIC wafer (after SoIC) | Electronic IC (EIC) & Photonic IC (PIC) EIC die to PIC wafer (after SoIC) | Optical engine (die-to-die) | CPO package (ASIC+OE) Optical Testing | CPO package (ASIC+OE) Electrical Testing (2025-2026) Optical+Electrical Testing (starting | CPO package (ASIC+OE) SLT? |
| Testing surface | ||||||
| Key Product timeline | 2025-2026 Scale-out CPO switch (Spectrum+Quantum) products 2027e onward: Scale-out CPO switch (Spectrum+Quantum) + Scale-up CPO switch products | 2025-2026 Scale-out CPO switch (Spectrum+Quantum) products 2027e onward: Scale-out CPO switch (Spectrum+Quantum) + Scale-up CPO switch products | 2025-2026 Scale-out CPO switch (Spectrum+Quantum) products 2027e onward: Scale-out CPO switch (Spectrum+Quantum) + Scale-up CPO switch products | 2025-2026 Scale-out CPO switch (Spectrum+Quantum) products 2027e onward: Scale-out CPO switch (Spectrum+Quantum) + Scale-up CPO switch products | 2025-2026 Scale-out CPO switch (Spectrum+Quantum) products 2027e onward: Scale-out CPO switch (Spectrum+Quantum) + Scale-up CPO switch products | |
| Testing details | El. & opt. DC, (power, loss, dark current etc.) | E/O, O/E, O/O, high speed, S-parameters | Full calibration/DC, high-speed functional, optical loopback, alternatively: S-parameters | Optical Light Transmission Testing, optical loopback | BER testing, signal testing | Full system functional validation |
| Testing service provider | Foundry (Wafer-level) TSMC | Foundry (Wafer-level) TSMC | OSAT (Die/chip level) SPIL (ASE Group) | OSAT (Die/package level) SPIL (ASE Group) | OSAT (Die/package level) SPIL (ASE Group) | OSAT (Die/package level) SPIL (ASE Group) |
| Equipment and Consumable Vendor | PIC ATE tester: 1) Advantest + TEL + Formfactor 2) Chroma (underqualification) EIC tester: 1) Teradyne + TEL EIC Probe card: FormFactor | Wafer level testing: 1)Ficontec +Formfactor +Teradyne 2) Advantest+ MPI | Die-to-die prober: 1. TEL 2. MPI Optical engine E/O tester+laser reliability test+ELS source test head: Chroma Optical and Electrical Test Socket: Winway | CPO switch tester: Chroma Hypersocket: Winway | ATE tester: 1) Advantest (under qualification) 2)Teradyne FT Handler+ELS source test head+optical alignmnet stage : Hon Precision Hypersocket: Winway | CPO SLT tester: Chroma (under qualification) Coaxial socket/Hypersocket: Winway |
Source: Company data, Morgan Stanley Research (e) estimates
Attached to Switch ASIC
CPO for Scale-Out Networking
CPO for Scale-Up Compute
Greater than 6.4Tbps of Optics
Attached to GPU
Exhibit 11: We expect scale-out CPO switch to grow rapidly, from 5k units in 2025 to 200k units in 2030, implying a 144% CAGR over 2023-30
Source: Yole, Morgan Stanley Research (e) estimates
Exhibit 12: CPO helps to reach scale-out networking and scale-up computing goal for AI/HPC applications
Source: Broadcom
=xmul 1o. lomiuo uuurt leumluluyy. Nuluoo oirm pluyyavieo lu vulu
Gen 1 CPO
Gen 2 CPO
3D Optical Engine (OE) for Next-Gen Communication maea око
Built for Reliability and Link Performance
M
Mature Partner Ecosystem
Pluggable (OSFP**)
1.6Tbps OE on Substrate in 2025
Multi-Generational
FAU
Gen 3 CPO: TH6-Davisson
EIC
SiPh
EIC
Substrate
1X
Power:
Latency:
1X
• COUPE: Compact Universal Photonic Engine
- OSFP: Octal Small Form Factor Pluggable
2024 TSMC, Ltd
TH5-Bailly
Gen 4 CPO
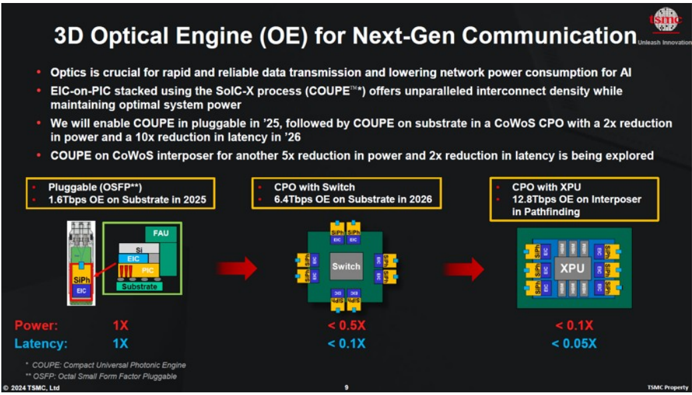
Exhibit 13: TSMC's COUPE technology: Across SiPh pluggables to 3DIC
CPO with Switch
6.4Tbps OE on Substrate in 2026
Thn tin
DC EKC
Switch
< 0.5X
< 0.1X
Source: TSMC
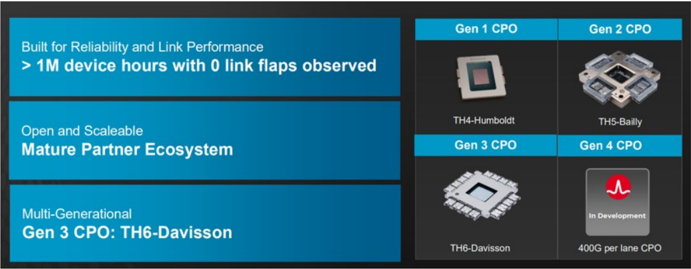
Exhibit 14: Broadcom's CPO platform
Source: Broadcom
M
FOCI business - Bottom-up analysis and capacity plan
FOCI's revenue bottom-up plan
For 2026, we expect Spectrum-X to be the mainstream scale-out CPO switch product, with the optical engine production number being 600k-1mn units, and total switch shipments being ~20k units given production lead time. We expect TFC, FOCI and Senko to be the major FAU suppliers, with FOCI taking around 40% of total market share. Thus, we expect NVIDIA's contribution to FOCI's total revenue to be around 18% in 2026.
Looking to 2027, our industry checks suggest that NVIDIA could introduce a CPO version of the Kyber alternative rack, leveraging two NVL72 architecture, with the launch time likely in 2H27. As a result, we assume 5k and 28k units of CPO Rubin Ultra rack shipments in 2027 and 2028, respectively, with FOCI having around 40% market share. Thus, we expect NVIDIA's total revenue to contribute around 42% and 80% of FOCI's total revenue in 2027 and 2028, respectively.
However, there are more than 10 customers that are doing prototypes and could recognize NRE revenue in 2026, with mass production starting in 2027 and 2028, according to our supply chain checks. We have not fully baked this into our model, and view it as only a bull case scenario as we await additional product launch and shipment signs in the supply chain.
Exhibit 15: Upcoming key CPO projects FAU vendors
| CPO project | FAU Vendor | Introduced Timeline |
|---|---|---|
| NVIDIA Scale-out (Spectrum/Quantum) | TFC, FOCI, Senko? | 2H26 |
| NVIDIA Scale-up (OIO) | FOCI, Senko | 2029 (Feynman Ultra) |
| Broadcom scale-out (Tomahawk) | Twinstar, Senko | 2H24 |
| AMD scale-up (MI series) | FOCI, Senko, Teramount? | 2H27-2028 (MI500 small scale; MI600 mainstream) |
| Ayar Labs | FOCI, Senko | 2H27-2028 (standard solution); AWS Trainium 5 (2H28-2029) |
| Marvell (COUPE version) | FOCI, Senko | 2028 |
| MediaTek | 2028? |
Source: Company data, Morgan Stanley Research estimates
Eambn lo. bullurtrur allalyolo. Ivlulho levellue cummeutlumtot vulmicucu coe
2026e
2027e
5
Rubin Ultra rack unit (k units)
M
Other scale-out switch optical engine consumption
Spectrum-X (k units)
Quantum-X (k units)
Market Share Assumptions
VIUWAN *OoaroO
FOCI
Others (TFC, Senko)
FAU ASP Assumptions
FAU ASP (6.4T; US$)
FAU ASP (3.2T; US$)
FAU ASP (1.6T; US$)
FOCI Revenue contribution from NVIDIA
Revenue contribution (US$mn)
Revenue contribution (NT$mn)
FOCI CY Revenue (NT$mn)
% of total revenue
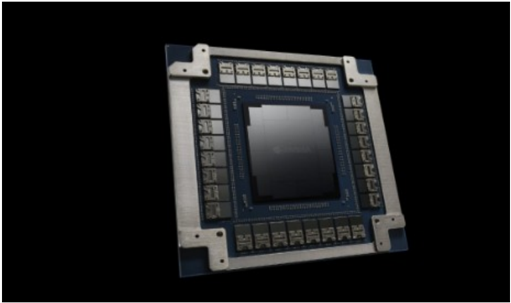
Exhibit 17: Spectrum-X CPO Switch
Source: NVIDIA
800
35%
65%
180
90
45
19
567
1,985
29%
2028e
20
792
648
144
Exhibit 16: Bottom-up analysis: NVIDIA's revenue contribution to FOCI in 2026-28e
| 1,000 2,112 | |||
|---|---|---|---|
| 1,000 1,408 | |||
| 35% 35% VIGIAN :aoInoS | |||
| 180 180 | |||
| 90 45 90 45 | 90 45 90 45 | 90 45 90 45 | 90 45 90 45 |
| 219 6,577 721 21,622 | 219 6,577 721 21,622 | 219 6,577 721 21,622 | 219 6,577 721 21,622 |
| 8,694 23,559 | |||
| 76% 92% |
Source: Company data, Morgan Stanley Research (e) estimates
Exhibit 18: Quantum-X CPO Switch
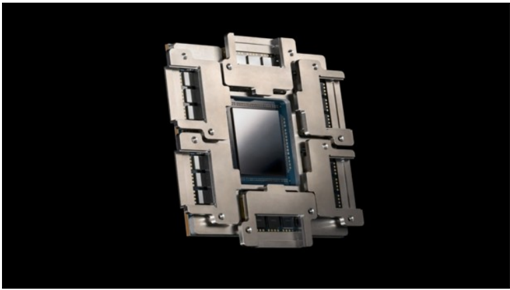
Source: NVIDIA
For Optical I/O or optical engine on interposer adoption plans, we see NVIDIA exploring multiple solutions for the next generation Feyman and Feyman Ultra's platform, but whether there would be introduction or not still takes time. For other solutions, we see AMD targeting a scale-up CPO version for its MI550 or MI650 rack system in 2027/2028, based on its development progress. We also see ASIC vendors exploring CPO on GPU.
Our supply chain checks suggest that FOCI could see over 10 customers contributing to its Silicon Photonic/CPO revenue in 2026, besides some mass production revenue starting
SiPh Roadmap
Challenges
• High-bandwidth requirements for high-density fiber
FOCI Advanced Technologies
• Completed 20, 40, and 80 channels FAU
M
•.
from 1Q26.
co-Packaging Optics
What are FOCI's current plans for capacity?
In its recent public offering disclosure for the SEO, FOCI disclosed its projected revenue and profitability for the NT$1.538bn capex spent ( Exhibit 19 ). The company completed its SEO plan in early February, with total acquired capital of NT$3.1bn. It also announced a new private equity plan on Feb 26, with maximum new share issuance of 10mn units. We expect it to utilize all of the capital for R&D purposes (12.8T research) and further building and expanding its FAU capacity.
Exhibit 19: FOCI's projected revenue and profitability from NT$1.538bn capex spent
| Year (NT$mn) | 2026 | 2027 | 2028 |
|---|---|---|---|
| Sales Revenue | 518 | 2,398 | 3,980 |
| Gross Profit | 198 | 906 | 1,598 |
| Gross margin | 38.2% | 37.8% | 40.1% |
| Operating Profit | 38 | 483 | 1,012 |
| Operating margin | 7.3% | 20.1% | 25.4% |
Source: Company data, Morgan Stanley Research
Exhibit 20: FOCI's SiPh Roadmap
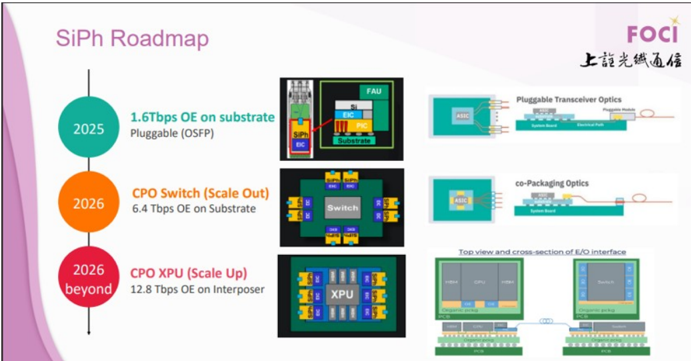
Source: FOCI
Exhibit 21: FOCI's solutions for CPO
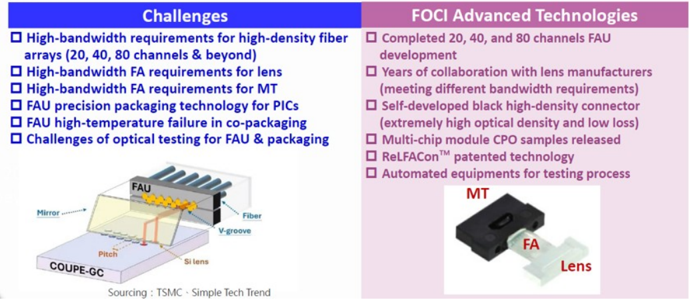
Source: FOCI
2026
Mirror ..
2026
beyond
CPO Switch (Scale Out)
FAU
6.4 Tbps OE on Substrate
→ Fiber
V-groove
Si lens
CPO XPU (Scale Up)
12.8 Tbps OE on Interposer
Sourcing : TSMC • Simple Tech Trend
COUPE-GC
Switch
XPU
FOCI
M
Exhibit 22: ReLFACon enables direct transmission of external photonic signals with MCM modules to achieve reliable signal transmission
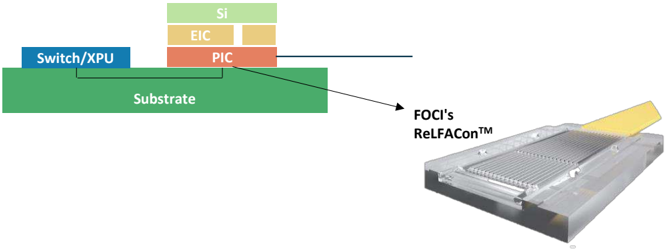
Source: FOCI
M
AllRing Business - Bottom-up Analysis
We expect CoWoS-related revenue to account for 79% of AllRing's total revenue in 2026, with AllRing focusing on oS equipment supply to TSMC and ASE/SPIL. On the other hand, our checks indicate that TSMC's CoWoS capacity is likely to extend to 130kwpm in 2026 year end, with a view to meet strong customer demand. However, we see more non-TSMC 2.5 packaging solution vendors qualifying more Taiwanese CoWoS equipment vendors, creating a new TAM for AllRing, including FoPLP and Intel's EMIB. We expect AllRing's 2027 CoWoS revenue to rise 53% Y/Y (TSMC's CoWoS seen at 200kwpm for 2027), and see it beginning to prepare equipment for CoPoS (if the trial round goes smoothly in 2026) and its AP fab in Arizona (MP likely starting in 2028).
For CPO, AllRing has penetrated the CPO supply chain of NVIDIA for FAU-optical engine coupling and FAU AOI equipment. Our latest supply chain checks suggest that AllRing may have also won the dispensing step after insertion 3, where the optical engine will be mounted onto the CPO package substrate. We expect more clarity from the company on CPO-related revenue in 2H26, and expect it to account for 11%, 19%, and 26% of AllRing's total revenue in 2026, 2027, and 2028, respectively.
For SoIC, we expect 2026 SoIC capacity to reach 14kwpm. TSMC further expanding its CoWoS capacity in AP7 could cause slightly delays in equipment pull-in. Our latest supply chain checks suggest that TSMC has revised 2027e capacity to 40kwpm (from 45kwpm) and 2028e to 70kwpm (from 75kwpm). AllRing is the sole WoW dispenser supplier for SoIC; we expect the delay in SoIC to be more than offset by the strong build in CoWoS. In the long run, we still expect it to be the key growth driver for AllRing. SoIC is one of the key advanced packaging nodes for TSMC in the coming years, as we see more and more customers adopting this technology to realize chiplet design, including AMD, NVIDIA, Apple, and Broadcom.
Exhibit 23: Bottom-up analysis for AllRing's revenue
| (NT$mn) | 2024 | 2025 | 2026e | 2027e | 2028e | 2025 Y/Y | 2026 Y/Y | 2027 Y/Y | 2028 Y/Y |
|---|---|---|---|---|---|---|---|---|---|
| CoWoS | 3,530 | 4,771 | 7,405 | 11,305 | 11,305 | 35% | 55% | 53% | 0% |
| CPO | 0 | 150 | 1,050 | 3,000 | 4,500 | NA | 600% | 186% | 50% |
| Flip Chip | 200 | 0 | 700 | 200 | 0 | -100% | NA | -71% | -100% |
| SoIC | 120 | 150 | 600 | 700 | 25% | 300% | 17% | ||
| Others | 1,804 | 325 | 100 | 500 | 800 | -82% | -69% | 400% | 60% |
| Total Revenue | 5,535 | 5,366 | 9,405 | 15,605 | 17,305 | -3% | 75% | 66% | 11% |
| Revenue mix | 2024 | 2025e | 2026e | 2027e | 2028e | ||||
| CoWoS | 64% | 89% | 79% | 72% | 65% | ||||
| CPO | 0% | 3% | 11% | 19% | 26% | ||||
| Flip Chip | 4% | 0% | 7% | 1% | 0% | ||||
| SoIC | 0% | 2% | 2% | 4% | 4% | ||||
| Others | 33% | 6% | 1% | 3% | 5% | ||||
| Total Revenue | 100% | 100% | 100% | 100% | 100% |
Source: Company data, Morgan Stanley Research (e) estimates
M
Exhibit 24: CoWoS supply capacity breakdown (average)
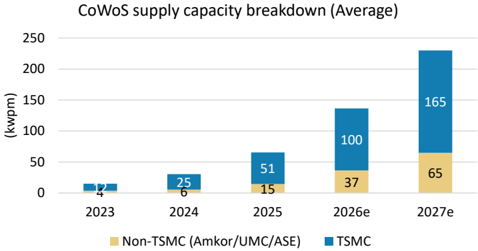
Source: Company data, Morgan Stanley Research (e) estimates. Note: estimates are compiled using our supply chain checks.
Exhibit 26: Detailed CoWoS capacity expansion by year end and
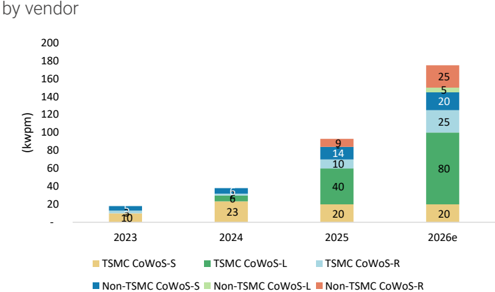
Source: Company data, Morgan Stanley Research (e) estimates. Note: estimates are compiled using our supply chain checks.
Exhibit 28:
TSMC's advanced packaging fab planning
| Advanced Packaging Plant | Location | Focused Technology |
|---|---|---|
| AP1 | Hsinchu | R&D |
| AP2 | Tainan | Bumping |
| AP3 | Taoyuan | InFOandWMCM |
| AP5 | Taichung | CoWoS |
| AP6 | Miaoli | SoIC |
| AP7 | Chiayi | WMCM, CoWoS, SoIC, CoPoS |
| AP8 | Tainan | CoWoS |
| AP9 and AP10 | Arizona | SoIC/CoWoS/CoPoS/WMCM/R&D |
Source: Company data, Morgan Stanley Research
Exhibit 25: CoWoS supply capacity breakdown (by year-end)
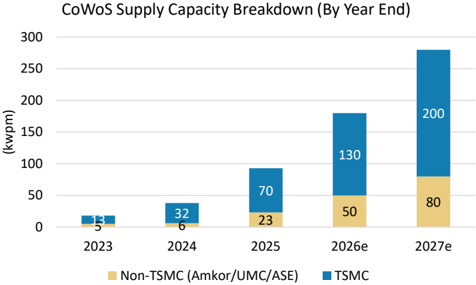
Source: Company data, Morgan Stanley Research (e) estimates. Note: estimates are compiled using our supply chain checks.
Exhibit 27: CoWoS demand breakdown by customer
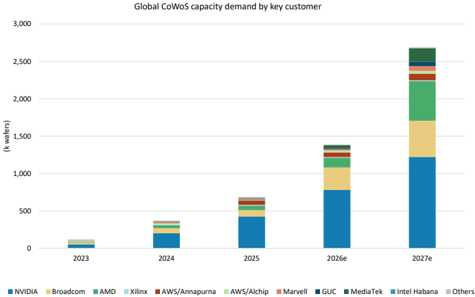
Source: Company data, Morgan Stanley Research (e) estimates. Note: estimates are compiled using our supply chain checks.
M
AllRing: Estimate Revisions
We lift our EPS estimates by 15% for 2026 and 2% for 2027, and fine-tune 2028
forecasts: We lift our 2026 and 2027 revenue estimates to reflect ongoing advanced packaging capacity opportunities, including CoPoS and CoWoS, and also CPO, with CoWoS capacity continue to see upside. We expect AllRing to win more advanced packaging opportunities from the non-TSMC camp. Gross margin is likely to be better than many fear, driven by a better product mix, as CPO equipment's GM is margin accretive at the 5560% level.
Exhibit 29: AllRing: Estimate revisions
| NTD mn | New '2026 | Old '2026E | Diff. | New '2027e | Old '2027E | Diff. | New '2028e | Old '2028E | Diff. |
|---|---|---|---|---|---|---|---|---|---|
| Net sales | 9,405 | 8,350 | 13% | 14,955 | 14,410 | 4% | 16,655 | 16,110 | 3% |
| Gross profit | 4,877 | 4,329 | 13% | 7,766 | 7,626 | 2% | 8,749 | 8,686 | 1% |
| Operating profit | 2,739 | 2,347 | 17% | 4,385 | 4,310 | 2% | 4,944 | 4,952 | 0% |
| Pretax Income | 2,930 | 2,539 | 15% | 4,561 | 4,486 | 2% | 5,145 | 5,154 | 0% |
| Net income | 2,454 | 2,125 | 15% | 3,831 | 3,768 | 2% | 4,322 | 4,329 | 0% |
| EPS for consensus | 25.48 | 22.07 | 15% | 39.79 | 39.13 | 2% | 44.89 | 44.96 | 0% |
| Margins | |||||||||
| Gross margin | 51.9% | 51.8% | 51.9% | 52.9% | 52.5% | 53.9% | |||
| Operating margin | 29.1% | 28.1% | 29.3% | 29.9% | 29.7% | 30.7% | |||
| Pretax margin | 31.2% | 30.4% | 30.5% | 31.1% | 30.9% | 32.0% | |||
| Net margin | 26.1% | 25.5% | 25.6% | 26.1% | 25.9% | 26.9% | |||
| Opex% | 22.7% | 23.7% | 22.6% | 23.0% | 22.8% | 23.2% |
Source: Morgan Stanley Research (e) estimates
Exhibit 30: AllRing: Quarterly financials
| (NT$ mn) | 1Q26 | 2Q26E | 3Q26E | 4Q26E | 1Q27E | 2Q27E | 3Q27E | 4Q27E | 2024 | 2025E | 2026E | 2027E | 2028E |
|---|---|---|---|---|---|---|---|---|---|---|---|---|---|
| Total revenues | 1,411 | 2,241 | 2,996 | 2,757 | 2,719 | 3,394 | 4,112 | 4,730 | 5,535 | 5,366 | 9,405 | 14,955 | 16,655 |
| Q/Q Change | 59% | 59% | 34% | -8% | -1% | 25% | 21% | 15% | 359% | -3% | 75% | 59% | 11% |
| Y/Y Change | 13% | 47% | 75% | 211% | 93% | 51% | 37% | 72% | 359% | -3% | 75% | 59% | 11% |
| Cost of Sales | 681 | 1,079 | 1,441 | 1,327 | 1,307 | 1,632 | 1,976 | 2,273 | 2,818 | 2,453 | 4,528 | 7,188 | 7,906 |
| Percent of Revenues | 48% | 48% | 48% | 48% | 48% | 48% | 48% | 48% | 51% | 46% | 48% | 48% | 47% |
| Gross Profit | 731 | 1,162 | 1,554 | 1,430 | 1,411 | 1,762 | 2,136 | 2,457 | 2,717 | 2,913 | 4,877 | 7,766 | 8,749 |
| Gross Margin | 52% | 52% | 52% | 52% | 52% | 52% | 52% | 52% | 49% | 54% | 52% | 52% | 53% |
| Total Opex | 403 | 513 | 628 | 595 | 835 | 773 | 852 | 920 | 1,284 | 1,304 | 2,139 | 3,381 | 3,805 |
| Percent of Revenues | 29% | 23% | 21% | 22% | 31% | 23% | 21% | 19% | 23% | 24% | 23% | 23% | 23% |
| R&D | 192 | 200 | 210 | 210 | 400 | 400 | 400 | 400 | 775 | 767 | 812 | 1,600 | 1,640 |
| Percent of Revenues | 14% | 9% | 7% | 8% | 15% | 12% | 10% | 8% | 14% | 14% | 9% | 11% | 10% |
| General & Adm Exp. | 112 | 178 | 238 | 219 | 218 | 204 | 247 | 284 | 276 | 275 | 748 | 952 | 1,166 |
| Percent of Revenues | 8% | 8% | 8% | 8% | 8% | 6% | 6% | 6% | 5% | 5% | 8% | 6% | 7% |
| Selling Expenses | 99 | 134 | 180 | 165 | 218 | 170 | 206 | 236 | 233 | 262 | 579 | 829 | 999 |
| Percent of Revenues | 7% | 6% | 6% | 6% | 8% | 5% | 5% | 5% | 4% | 5% | 6% | 6% | 6% |
| Operating Income | 327 | 649 | 926 | 835 | 576 | 989 | 1,283 | 1,536 | 1,433 | 1,610 | 2,739 | 4,385 | 4,944 |
| Operating Margin | 23% | 29% | 31% | 30% | 21% | 29% | 31% | 32% | 26% | 30% | 29% | 29% | 30% |
| Total Non-operating Income | -60 | -44 | -44 | -44 | -44 | -44 | -44 | -44 | -133 | -12 | -14 | -14 | 0 |
| Profit Before Taxes | 387 | 693 | 970 | 879 | 620 | 1,033 | 1,327 | 1,580 | 1,566 | 1,813 | 2,930 | 4,561 | 5,145 |
| Percent of Revenues | 27% | 31% | 32% | 32% | 23% | 30% | 32% | 33% | 28% | 34% | 31% | 30% | 31% |
| Taxes | 67 | 118 | 155 | 141 | 99 | 165 | 212 | 253 | 255 | 316 | 481 | 730 | 823 |
| Tax Rate | 17% | 17% | 16% | 16% | 16% | 16% | 16% | 16% | 16% | 17% | 16% | 16% | 16% |
| Total Net Income to Parent | 325 | 575 | 815 | 739 | 521 | 868 | 1,115 | 1,327 | 1,311 | 1,485 | 2,454 | 3,831 | 4,322 |
| Percent of Revenues | 23% | 26% | 27% | 27% | 19% | 26% | 27% | 28% | 24% | 28% | 26% | 26% | 26% |
| EPS (NT$) | 3.37 | 5.98 | 8.46 | 7.67 | 5.41 | 9.01 | 11.58 | 13.79 | 15.25 | 15.46 | 25.48 | 39.79 | 44.89 |
| Change vs Year Ago | -6% | 44% | 94% | 128% | 61% | 51% | 37% | 80% | 794% | 1% | 65% | 56% | 13% |
| EPS for consensus (NT$) | 3.37 | 5.98 | 8.46 | 7.67 | 5.41 | 9.01 | 11.58 | 13.79 | 15.25 | 15.46 | 25.48 | 39.79 | 44.89 |
| Change vs Year Ago | -6% | 44% | 94% | 128% | 61% | 51% | 37% | 80% | 794% | 1% | 65% | 56% | 13% |
Source: Company data, Morgan Stanley Research (E) estimates
NTS million
Total Equity
Net Profit
ROAE
Spread
M
22.6%
30.9%
26.9%
26.7%
2027E
11,160
2028E 2029E 2030E
13,584
15,323
17,341
5,816
4,230
27.6%
AllRing: Valuation Methodology
PV of Continuing Value
Equity Value
No. of Shares
Price Target
Exhibit 31: AllRing: RI model
Source: Company data, Morgan Stanley Research (E) estimates
108,054
152,089
96
1,580
2026E
8,539
2031E
19,682
6,746
4,932
28.4%
2032E
22,398
7,825
5,746
29.2%
2033E 2034E
25,548
29,202
9,078
6,689
29.9%
10,530
7,783
30.5%
2035E
33,440
12,215
9,052
31.0%
2037E
44,060
16,436
12,230
31.9%
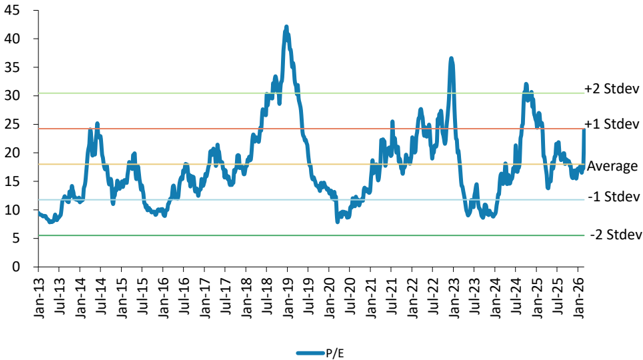
We keep our RI-based price target (base case scenario value) at NT$1,580, reflecting our minor estimate changes for 2027 and 2028. Our other key assumptions are unchanged, including a cost of equity (CoE) at 8%, derived from a risk-free rate of 2.0%, beta of 1.0 and market risk premium of 6%, intermediate growth rate of 16% and terminal growth rate of 4.5%.
Exhibit 32: AllRing: NTM P/E
Source: Company data, FactSet, Morgan Stanley Research estimates
2036E
38,357
14,169
10,524
31.5%
M
Risk Reward - AllRing Tech Co. (6187.TWO) Risk Reward - AllRing Tech Co. (6187.TWO)
CPO, SoIC, and CoPoS Help to Extend Revenue Momentum; OW
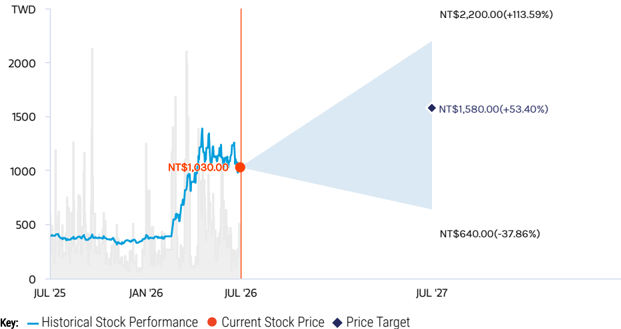
NT$1,580.00 PRICE TARGET
Base case, residual income model. Our key assumptions are:
- Cost of equity (CoE) of 8%, derived from a risk-free rate of 2.0%, beta of 1.0, and a market risk premium of 6.0%.
- Intermediate growth rate of 16%.
- Cash dividend payout of 65%
- Terminal growth rate of 4.5%.
RISK REWARD CHART
Source: Refinitiv, Morgan Stanley Research
BULL CASE
55x 2027e EPS
We assume: 1) 60% revenue CAGR over 2025-28, thanks to stronger-than-expected capacity expansion plans for TSMC's CoWoS, CPO and SoIC; 2) gross margin expands to more than 55% in 2025-28, due to strongerthan-expected operating leverage resulting from the equipment production outsourcing strategy; 3) new product launches exceed expectations and AllRing increases its market share in other processes such as "CoW."
NT$2,200.00
OVERWEIGHT THESIS
- NVIDIA's next-generation GPU Rubin will stick with graphene for heat sink attachment, reducing concerns about competition for Allring.
- We expect AllRing to be a key beneficiary of the multi-year advanced packaging trend, including CoPoS and SoIC, but large-scale revenue contributions will likely take time.
- It is the sole WoW (Wafer-on-Wafer) dispenser supplier for SoIC, which we expect to be the next growth driver, contributing at least 2% of total revenue in 2026 and 4% in 2027.
- Our implied 2027e target P/E is 40x, similar to its SoIC peer and lower than CPO peers. We expect new advanced packaging opportunities including CPO, CoWoP, and CoPoS to benefit the company in the long run.
Consensus Rating Distribution
Source: Refinitiv, Morgan Stanley Research
Risk Reward Themes
Secular Growth:
Positive
Technology Diffusion:
Positive
View descriptions of Risk Rewards Themes here
BEAR CASE
16x 2027e EPS
We assume: 1) -30% revenue CAGR in 202428 due to slower-than-expected CoWoS capacity expansion plans by TSMC; 2) gross margin falls below 40% owing to the high bargaining power of its customers; 3) market share loss in "WoS" process amid rising peer competition.
NT$640.00
BASE CASE
40x 2027e EPS
We expect: 1) 46% revenue CAGR in 202528e after strong CoWoS capacity expansion for TSMC in 2024-25; 2) gross margin to be maintained at 48-53% from 2024-28 thanks to high operating leverage resulting from the equipment production outsourcing strategy; and 3) with new equipment launches, we expect AllRing to expand its market share in other processes. CPO, SoIC and other applications continue to bear fruit.
NT$1,580.00
M
Risk Reward - AllRing Tech Co. (6187.TWO)
KEY EARNINGS INPUTS
| Drivers | Dec 2025 | Dec 2026e | Dec 2027e | Dec 2028e |
|---|---|---|---|---|
| Semi revenue (NT$, mn) | 5,215 | 9,294 | 14,871 | 16,563 |
| Passive revenue (NT$, mn) | 52 | 56 | 43 | 47 |
INVESTMENT DRIVERS
- CoWoS capacity expansion from TSMC
- New technology migration such as SoIC and silicon photonics
- Strong operating leverage, given equipment production outsourcing strategy
GLOBAL REVENUE EXPOSURE
Source: Morgan Stanley Research Estimate View explanation of regional hierarchies here
MS ALPHA MODELS
3/5 MOST
3 Month
Horizon
Source: Refinitiv, FactSet, Morgan Stanley Research; 1 is the highest favored Quintile and 5 is the least favored Quintile
RISKS TO PT/RATING
RISKS TO UPSIDE
- Stronger-than-expected CoWoS capacity expansion
- Faster-than-expected adoption of silicon photonics
- Market share gains from peers, led by continuous R&D and China's localization trend
RISKS TO DOWNSIDE
- Slowdown in CoWoS capacity expansion
- Allring's "WoS" market share declining
- Slowdown in technology migration such as SoIC and silicon photonics adoption
OWNERSHIP POSITIONING
Inst. Owners, % Active
76.4%
Source: Refinitiv, Morgan Stanley Research
MS ESTIMATES VS. CONSENSUS
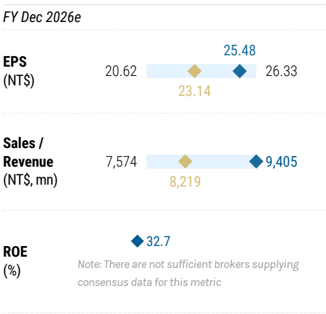
Mean
Morgan Stanley Estimates
Source: Refinitiv, Morgan Stanley Research
Income Statement
NTSmn (Years End Dec)
Net sales
COGS
Gross profit
2028E
16,655
2025
5,366
2027E
14,955
M
Non-operating income
Income tax
(176)
(202)
(203)
(191)
(133)
AllRing: Financial Summary
Reported net Income
Adj.wtd.avg.shrs(m)
Reported EPS (NT$)
EPS for consensus (NT$)
Balance Sheet
NT$mn (Years End Dec)
Cash
Mk Securities
ARINR
Inventory
Other
Current Assets
Long-term investments
Fixed assets
1,311
3,831
4,322
2.454
1.485
| 96 | 96 | 96 | 96 |
|---|---|---|---|
| 15.46 | 25.48 | 39.79 | 44.89 |
| 15.46 | 25.48 | 39.79 | 44.89 |
| 0 |
Deffered assets
Other assets
Total Assets
SIT borrowings
APINP
Other ST liabilities
LT debt
Other LT liabilities
Total Liabilities
Common shares
Additional capital
Retained earning
Other shareholders equity
Total Equity
Total Liab. & Shrhidr's Equity
E = Morgan Stanley Research Estimates
Source: Morgan Stanley Rescarch, Company Data
| 971 |
|---|
76
76
76
Cash Flow Statement
NT$mn (Years End Dec)
Cashflow from Operations
Net profits
Depreciation
Working Capital Change
Other adjustments
Cashflox from Investing
Change of LT Investment
2024
1,079
1,311
47
(130)
(157)
(359)
(372)
(36)
Other adjustments
50
Cashflow from financing 1,851
Increase in L/T debt
Increase in S/T debt
Cash Dividend Paid
Net change in cash
Financial Ratios
Growth(%)
Turnover
Operating profits
Pretax profits
Net profits
EPS
Margins (%)
2025
1.958
1,485
59
476
(71)
(666)
(581)
36
(68)
(645)
1,797
2026E
2,454
59
(725)
(98)
(100)
(51)
(1,403)
2027E
2,752
3,831
59
(1,148)
0
(151)
(100)
(51)
(1,227)
-
2028E
4,046
4,322
59
(344)
0
(151)
(100)
(51)
(1,916)
| 0 | ||||
|---|---|---|---|---|
| 0 (131) | 0 | 0 | 0 | 0 |
| (980) | (1,403) | (1,227) | (1,916) | |
| 2,601 | 646 | 279 | 1,373 | 1.979 |
| 2024 | 2025 | 2026E | 2027E | 2028E |
| 359.2 | -3.0 | 75.3 | 59.0 | 11.4 |
| 1623.8 | 12.3 | 70.1 | 60.1 | 12.7 |
| 873.5 | 15.8 | 61.6 | 55.7 | 12.8 |
| 848.5 | 13.3 | 65.2 | 56.1 | 12.8 |
| 793.9 | 1.4 | 64.8 | 56.1 | 12.8 |
Gross Margin
Operating Margin
Pretax Margin
Net Profit
Return (%)
ROAE
ROAA
Gearing (%)
Net Debt/Equity
Liabilities/Equity
Ratios (X)
Currentratio
Quick ratio
Others
ARINR Turnover (days)
Inventory Turnover (days)
AP Turnover (days)
Cash Conversion (days)
(563)
49.1
25.9
28.3
54.3
30.0
33.8
51.9
29.1
51.9
29.3
52.5
29.7
30.9
| 27.7 | 26.1 | 25.6 | 25.9 |
|---|---|---|---|
| 21.2 | 30.6 | 38.9 | 34.9 |
| 16.1 | 23.3 | 29.1 | 26.6 |
| (51.3) | (48.3) | (49.2) | (55.0) |
| 28.3 | 33.8 | 33.6 | 29.4 |
| 4.4 | |||
| 4.2 | 3.6 | 3.8 2.9 | |
| 3.3 | 2.8 | 3.4 | |
| 69 | 69 | 69 | 69 |
| 131 | 131 | 131 | 131 |
| 104 | 104 | 104 | 104 |
| 97 | 97 | 97 | 97 |
30.5
31.2
2024
2026E
M
FOCI: Estimate Revisions and Quarterly Financials
Factoring in actual 1Q26 results, we revise our 2026 EPS estimate to a loss, reduce
2027 by 2%, and cut 2028 fractionally. Weaker -than -expected 1Q26 and 2Q26 results were mainly due to ongoing capacity transition from the Hsinchu fab to the new Thailand fab as the company prioritizes its SiPh/CPO development. The SiPh/CPO new capacity line will also take some time, and pre-mass production preparation such as destructive testing conducted could also affect its gross margin, followed by gradual recovery. We also reflect the one-off expense from new share issuance impact on gross and operating profit in 1H26, as well as the impact on EPS from new share issuance.
We slightly lower our 2027-28 revenue assumptions for the traditional business, as the company will focus on CPO development and let go some low-margin business. However, our supply -chain checks indicate more than 10 customers are currently prototyping, with potential NRE revenue recognition in 2026 and mass production beginning in 2027 and 2028. We have not fully incorporated this upside into our model yet as we look for clearer evidence of product launches and shipment momentum - developments that would push our outlook toward the bull -case scenario.
Exhibit 33: FOCI: Estimate revisions
| NT$ mn | New '26E | Old '26E | Diff. | New '27E | Old '27E | Diff. | New '28E | Old '28E | Diff. |
|---|---|---|---|---|---|---|---|---|---|
| Net sales | 1,985 | 2,795 | -29% | 8,694 | 9,764 | -11% | 23,559 | 24,437 | -4% |
| Gross profit | 370 | 599 | -38% | 3,194 | 3,245 | -2% | 9,044 | 8,925 | 1% |
| Operating profit | (129) | 72 | 2,184 | 2,219 | -2% | 6,443 | 6,429 | 0% | |
| Pretax Income | (58) | 94 | 2,214 | 2,241 | -1% | 6,454 | 6,457 | 0% | |
| Net income | (45) | 80 | 1,794 | 1,905 | -6% | 5,228 | 5,424 | -4% | |
| Reported EPS (NT$) | (0.41) | 0.70 | 16.36 | 16.76 | -2% | 47.68 | 47.72 | 0% | |
| Margins | |||||||||
| Gross margin | 18.7% | 21.4% | 36.7% | 33.2% | 38.4% | 36.5% | |||
| Operating margin | -6.5% | 2.6% | 25.1% | 22.7% | 27.3% | 26.3% | |||
| Pretax margin | -2.9% | 3.4% | 25.5% | 23.0% | 27.4% | 26.4% | |||
| Net margin | -2.3% | 2.9% | 20.6% | 19.5% | 22.2% | 22.2% |
Source: Company data, Morgan Stanley Research (E) estimates
Exhibit 34: FOCI: Quarterly financials
| NT$ in million # NT$ | 1Q26 NT$ 0 | 2Q26E NT$ 0 | 3Q26E NT$ 0 | 4Q26E NT$ 0 | 1Q27E NT$ 0 | 2Q27E NT$ 0 | 3Q27E NT$ 0 | 4Q27E NT$ 0 | 1Q28E NT$ 0 | 2Q28E NT$ 0 | 3Q28E NT$ 0 | 4Q28E NT$ 0 | 2024 NT$ 0 | 2025 NT$ 0 | 2026E NT$ 0 | 2027E NT$ 0 | 2028E NT$ |
|---|---|---|---|---|---|---|---|---|---|---|---|---|---|---|---|---|---|
| Total Revenues Sequential Change Change vs Year Ago | 382 -2.2% -6.7% | 400 4.8% -31.5% | 496 23.9% -2.4% | 718 44.9% 83.9% | 934 30.1% 144.6% | 1,392 49.0% 247.8% | 2,311 66.0% 366.3% | 4,058 75.6% 464.9% | 4,400 8.4% 370.9% | 5,239 19.1% 276.4% | 6,241 19.1% 170.1% | 7,680 23.0% 89.3% | 1,364 7.2% | 1,892 38.7% | 1,985 4.9% | 8,694 338.1% | 0 23,559 171.0% |
| Cost of Sales Percent of Revenues | 375 98% | 363 91% | 372 75% | 516 72% | 639 68% | 920 66% | 1,462 63% | 2,479 61% | 2,759 63% | 3,254 62% | 3,838 61% | 4,665 61% | 1,185 87% | 1,537 81% | 1,614 81% | 5,500 63% | 14,515 62% |
| Gross Profit Percent of Revenues Incremental Margin | 7 1.9% NM | 37 9.2% 163% | 123 24.9% 91% | 203 28.2% 36% | 295 31.6% 43% | 472 33.9% 39% | 849 36.7% 41% | 1,578 38.9% 42% | 1,641 37.3% 18% | 1,985 37.9% 41% | 2,404 38.5% 42% | 3,015 39.3% 42% | 179 13.1% 1% | 355 | 370 18.7% 17% | 3,194 36.7% 42% | 9,044 38.4% 39% |
| Total Opex Percent of Revenues R&D | 163 42.8% 72 18.8% 19.1% | 101 25.3% 77 | 111 22.4% | 124 17.3% 87 | 164 17.6% 100 5.4% | 231 16.6% 150 4.3% | 255 11.0% 150 6.5% | 361 8.9% 200 100 | 446 10.1% 260 2.7% | 559 10.7% 310 5.9% 170 3.2% | 786 12.6% 7.4% 220 3.5% | 811 6.0% 220 2.9% | 273 20.0% 147 2.2% (93) | 18.8% 33% 354 18.7% 5.8% | 500 25.2% 317 16.0% | 1,010 11.6% 600 6.9% | 2,601 11.0% 730 |
| Percent of Revenues General & administrative | 73 | 19.2% 13 3.2% | 82 16.5% 15 3.0% | 12.1% 17 2.3% | 10.7% 50 | 10.8% 60 | 70 3.0% | 4.9% | 5.9% 120 | 460 | 10.6% 460 | 10.8% 96 7.1% 29 | 212 11.2% 110 | 117 5.9% | 280 | 1,490 6.3% | |
| Percent of Revenues Selling & marketing | 19 4.9% | 12 2.9% | 14 2.9% | 21 2.9% | 14 1.5% | 21 1.5% | 35 1.5% | 2.5% 61 | 66 1.5% | 79 1.5% | 106 1.7% | 131 1.7% | -6.8% | 32 1.7% 0 0.0% | 65 3.3% (129) | 3.2% 130 1.5% | 3.1% 381 1.6% |
| Percent of Revenues Operating Income | (156) | (64) -16.1% | 12 | 78 10.9% | 131 14.1% | 241 17.3% | 594 25.7% | 1.5% 1,218 | 1,195 | 1,426 27.2% | 1,617 | 2,204 28.7% | n.a. | -6.5% | 2,184 | 6,443 27.3% | |
| Percent of Revenues Change vs Year Ago Total Non-operating Income(Loss) | -40.9% n.a. 22 | n.a. 17 | 2.5% n.a. 17 | n.a. 17 | n.a. 8 | n.a. 8 | n.a. 8 | 30.0% n.a. 8 | 27.2% n.a. 3 | n.a. 3 | 25.9% n.a. 3 | n.a. 3 | 37 (57) | n.a. 22 23 | n.a. 72 | 25.1% n.a. 30 | n.a. 12 |
| Profit Before Taxes Percent of Revenues Taxes | (135) -35% (28) | (48) -12% (10) | 29 6% 6 | 95 13% 19 | 139 15% 26 | 249 18% 47 | 601 26% 114 | 1,225 30% 233 | 1,198 27% 228 | 1,429 27% 272 | 1,620 26% 308 | 2,207 29% 419 | -4% (8) | 1% 7 | (58) -3% (12) | 2,214 25% 421 | 6,454 27% 1,226 |
| Reported Income (TW GAAP) Percent of Revenues Change vs Year Ago | (107) -28% 0% | (38) -10% 0% | 23 5% 0% | 76 11% | 113 12% | 201 | 487 21% | 992 | 970 22% 0% | 1,157 22% 0% | 1,312 21% 0% | 1,788 23% 0% | (48) -4% NM | 16 1% | (45) -2% NM | 1,794 21% NM | 5,228 22% 191% |
| Reported EPS (NT$, TW | (0.98) | (0.35) | 0.21 | 0% 0.69 | 0% | 14% 0% | 0% 4.44 | 24% 0% | 8.85 | 10.56 | 11.97 | 16.30 | NM | (0.41) | 47.68 | ||
| GAAP) Change vs Year Ago | -9215% | -317% | 7% | -421% | 1.03 n.a. | 1.84 n.a. | 1997% | 9.05 1205% | 762% | 475% | 169% | 80% | (0.47) NM | 0.16 NM | NM | 16.36 NM | 191% |
Source: Company data, Morgan Stanley Research (E) estimates
M
FOCI: Valuation Methodology
Our price target (base case scenario value) remains NT$708 as we essentially maintain our 2028 EPS forecast and RI parameters.
We keep our medium -term growth rate at 16%, in line with Asia optics peers (e.g., Landmark) at 15-16%, to reflect rapid development in CPO and silicon -photonics technology. We maintain our other assumptions: cost of equity of 12.9% (risk -free rate 2.0%, risk premium 6.9%), payout ratio of 61%, and terminal growth rate of 4.0%.
Exhibit 35: FOCI: RI base
| NT$million | 2026E | 2027E | 2028E | 2029E | 2030E | 2031E | 2032E | 2033E | 2034E | 2035E | 2036E | 2037E |
|---|---|---|---|---|---|---|---|---|---|---|---|---|
| Total Equity | 2,420 | 4,104 | 9,201 | 11,934 | 15,104 | 18,780 | 23,042 | 27,983 | 33,713 | 40,356 | 48,059 | 56,991 |
| Net Profit | (45) | 1,794 | 5,228 | 6,062 | 7,029 | 8,150 | 9,450 | 10,957 | 12,704 | 14,731 | 17,080 | 19,805 |
| ROAE | NM | 55.0% | 78.6% | 57.4% | 52.0% | 48.1% | 45.2% | 42.9% | 41.2% | 39.8% | 38.6% | 37.7% |
| Residual Income | 1,018 | 2,695 | 4,088 | 4,661 | 5,312 | 6,058 | 6,916 | 8,745 | 11,409 | 13,198 | 15,269 | |
| Spread | 42.0% | 65.7% | 44.4% | 39.1% | 35.2% | 32.3% | 30.0% | 28.3% | 26.8% | 25.7% | 24.8% | |
| Ending Equity Capital | 2,420 | |||||||||||
| PV of Forecast Period | 28,517 | |||||||||||
| PV of Continuing Value | 46,652 | |||||||||||
| Equity Value | 77,588 | |||||||||||
| No. of Shares | 110 | |||||||||||
| Projected Price | 708 |
Source: Company data, Morgan Stanley Research (E) estimates
Exhibit 37: FOCI: P/S
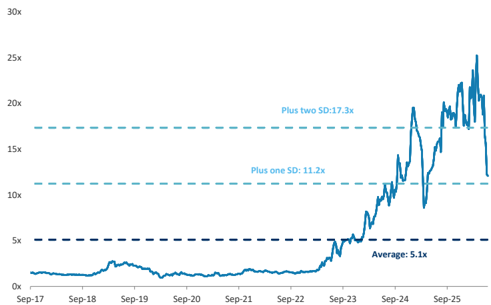
Source: Company data, Factset, Morgan Stanley Research estimates
Exhibit 36: FOCI: P/B
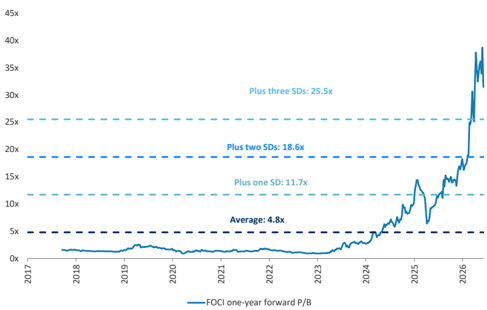
Source: Company data, Factset, Morgan Stanley Research estimates
M
Risk Reward - FOCI Fiber Optic Communications Inc Risk Reward - FOCI Fiber Optic Communications Inc (3363.TWO)
(3363.TWO) New page for networking market; OW
NT$708.00 PRICE TARGET
Base case, residual income model. Key assumptions: cost of equity of 12.9% (risk-free rate 2.0% and risk premium 6.9%), a payout ratio of 61%, a medium-term growth rate of 16%, and a terminal growth rate of 4.0%.
RISK REWARD CHART
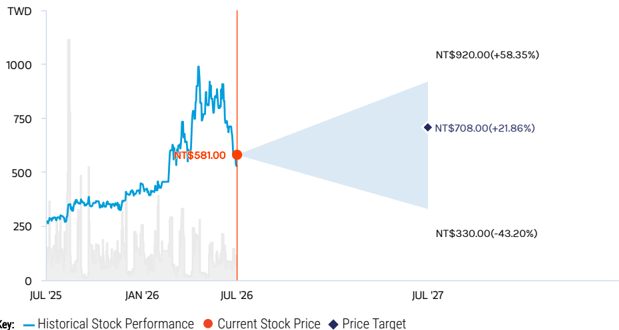
Key:
Source: Refinitiv, Morgan Stanley Research
BULL CASE
56x 2027e EPS
We assume: 1) 200% revenue CAGR, 202327e, from stronger-than-expected CPO development; 2) faster-than-expected CPO introduction; 3) gross margin improving to over 50% in 2027e thanks to scale effects and the company's technology competitiveness; and 4) >400% EPS CAGR, 2023-27e.
NT$920.00
BASE CASE
43x 2027e P/E
We project: 1) 107% revenue CAGR, 202327e, on fast CPO development; 2) gross margin improves to over 37% in 2027e thanks to scale effects and the company's technology competitiveness; 3) 231% EPS CAGR, 2023-27e.
NT$708.00
OVERWEIGHT THESIS
- Co-packaged optics (CPO) is an advanced silicon photonics (SiPh) method that integrates optics and silicon on a single packaged substrate, aiming to reduce signal loss, power consumption, and cost.
- Given geopolitical benefits and close partnership with TSMC, we think FOCI is well positioned to provide CPO's fiber array units (FAU) and related services, leveraging its ReLFACon technology.
- SiPh/CPO technology is expected to be FOCI's main growth driver in the future. We see its sales contribution expanding from 7% in 2024 to 92% in 2028.
- The company is still growing at a fast pace and in transition. Thus, we expect FOCI stock to trade at 43x 2027e P/E vs. an EPS CAGR of 231% over 2023-27e.
Risk Reward Themes
Disruption:
Positive
Secular Growth:
Positive
Technology Diffusion:
Positive
View descriptions of Risk Rewards Themes here
BEAR CASE
20x 2027e P/E
We assume: 1) 50% revenue CAGR, 202327e, given slower-than-expected CPO development; 2) slower-than-expected CPO introduction; and 3) gross margin falling below 10% in 2027 owing to the high bargaining power of customers.
NT$330.00
M
Risk Reward - FOCI Fiber Optic Communications Inc (3363.TWO)
KEY EARNINGS INPUTS
| Drivers | Dec 2025 | Dec 2026e Dec 2027e Dec 2028e | Dec 2026e Dec 2027e Dec 2028e | Dec 2026e Dec 2027e Dec 2028e |
|---|---|---|---|---|
| Revenue from computing segment (NT$, mn) | 1,198 | 1,108 | 1,313 | 1,454 |
| Revenue from communication segment (NT$, mn) | 326 | 215 | 329 | 356 |
| Revenue from battery segment (NT$, mn) | 109 | 650 | 7,032 | 21,724 |
INVESTMENT DRIVERS
- Silicon photonics and CPO
GLOBAL REVENUE EXPOSURE
Source: Morgan Stanley Research Estimate View explanation of regional hierarchies here
RISKS TO PT/RATING
RISKS TO UPSIDE
- Faster-than-expected CPO introduction
- More intense geopolitical tension
- Significant AI/cloud capex increase
RISKS TO DOWNSIDE
- Slower-than-expected CPO introduction slower than expected
- Easing geopolitical tension
- Significant AI/cloud capex cuts
OWNERSHIP POSITIONING
Inst. Owners, % Active
75.6%
Source: Refinitiv, Morgan Stanley Research
MS ESTIMATES VS. CONSENSUS
FY Dec 2026e
(0.41)
EPS
(NT$)
Sales /
Revenue
(NT$, mn)
EBITDA
(NT$, mn)
Net income
(NT$, mn)
ROE
(%)
Note: There are not sufficient brokers supplying consensus data for this metric
1,985
Note: There are not sufficient brokers supplying consensus data for this metric
Note: There are not sufficient brokers supplying consensus data for this metric
Note: There are not sufficient brokers supplying consensus data for this metric
(1.8)
Note: There are not sufficient brokers supplying consensus data for this metric
Mean
Morgan Stanley Estimates
Source: Refinitiv, Morgan Stanley Research
M
FOCI: Financial Summary
Income Statement
| NT$mn (Years End Dec ) | 2024 | 2025 | 2026E | 2027E | 2028E |
|---|---|---|---|---|---|
| Net sales | 1,364 | 1,892 | 1,985 | 8,694 | 23,559 |
| COGS | (1,185) | (1,537) | (1,614) | (5,500) | (14,515) |
| Gross profit | 179 | 355 | 370 | 3,194 | 9,044 |
| Operating expenses | (273) | (354) | (500) | (1,010) | (2,601) |
| Operating income | (93) | 0 | (129) | 2,184 | 6,443 |
| Non-operating income | 37 | 22 | 72 | 30 | 12 |
| Pre-tax income | (57) | 23 | (58) | 2,214 | 6,454 |
| Income tax | (8) | 7 | (12) | 421 | 1,226 |
| Reported net Income | (48) | 16 | (45) | 1,794 | 5,228 |
| Adj.wtd.avg.shrs( m) | 88 | 88 | 110 | 110 | 110 |
| Reported EPS (NT$) | (0.47) | 0.16 | (0.41) | 16.36 | 47.68 |
| Modelware EPS (NT$) | (0.47) | 0.16 | (0.41) | 16.36 | 47.68 |
Balance Sheet
| NT$mn (Years End Dec ) | 2024 | NT$ 2,025 | 2026E | 2027E | 2028E |
|---|---|---|---|---|---|
| Cash | 1,470 | 1,412 | 2,251 | 5,106 | 9,932 |
| Mkt Securities | 43 | 20 | 20 | 20 | 20 |
| AR/NR | 285 | 276 | 294 | 1,290 | 3,495 |
| Inventory | 288 | 409 | 366 | 1,246 | 3,289 |
| Other | 56 | 91 | 91 | 91 | 91 |
| Current Assets | 2,141 | 2,207 | 3,022 | 7,752 | 16,826 |
| Long-term investments | 0 | 0 | 0 | 0 | 0 |
| Fixed assets | 485 | 647 | 2,024 | 4,090 | 6,496 |
| Deffered assets | 51 | 56 | 56 | 56 | 56 |
| Other assets | 290 | 247 | 247 | 247 | 247 |
| Total Assets | 2,967 | 3,157 | 5,349 | 12,145 | 23,625 |
| S/T borrowings | 0 | 153 | 459 | 1,072 | 2,297 |
| AP/NP | 202 | 194 | 208 | 707 | 1,866 |
| Other ST liabilities | 146 | 175 | 175 | 175 | 175 |
| LT debt | 89 | 86 | 2,086 | 6,086 | 10,086 |
| Other LT liabilities | 0 | 0 | 0 | 0 | 0 |
| Common shares | 1,036 | 1,036 | 1,036 | 1,036 | 1,036 |
| Total Liabilities | 437 | 608 | 2,928 | 8,040 | 14,424 |
| Additional capital | 1,440 | 1,464 | 1,464 | 1,464 | 1,464 |
| Retained earning | 276 | 273 | 145 | 1,829 | 6,925 |
| Other shareholders' equity | (222) | (225) | (225) | (225) | (225) |
| Total Equity | 2,531 | 2,549 | 2,420 | 4,104 | 9,201 |
| Total Liab. & Shrhldr's Equity | 2,967 | 3,157 | 5,349 | 12,145 | 23,625 |
E = Morgan Stanley Research Estimates
Source: Morgan Stanley Research, Company Data
Cash Flow Statement
| NT$mn (Years End Dec ) | 2024 | 2025 | 2026E | 2027E | 2028E |
|---|---|---|---|---|---|
| Cashflow from Operations | 70 | (17) | 154 | 659 | 2,501 |
| Net profits | (48) | 16 | (45) | 1,794 | 5,228 |
| Depreciation | 100 | 107 | 161 | 241 | 362 |
| Working Capital Change | (71) | (154) | 39 | (1,376) | (3,089) |
| Other adjustments | 88 | 13 | 0 | 0 | 0 |
| Cashflow from Investing | 19 | (165) | (1,538) | (2,307) | (2,768) |
| Capex | (55) | (55) | (1,538) | (2,307) | (2,768) |
| Change of LT Investment | 170 | 43 | 0 | 0 | 0 |
| Change of ST Investment | 0 | 0 | 0 | 0 | 0 |
| Other adjustments | (95) | (153) | 0 | 0 | 0 |
| Cashflow from financing | 453 | 122 | 2,223 | 4,503 | 5,093 |
| Increase in L/T debt | 2 | (3) | 2,000 | 4,000 | 4,000 |
| Increase in S/T debt | 0 | 153 | 306 | 613 | 1,225 |
| Cash Dividend Paid | (49) | 0 | (83) | (110) | (132) |
| Issuance of stock | 522 | 0 | 0 | 0 | 0 |
| Other adjustments | (21) | (28) | 0 | 0 | 0 |
| Exchange rate adjustment | 15 | 3 | 0 | 0 | 0 |
| Net change in cash | 557 | -58 | 839 | 2,855 | 4,826 |
Financial Ratios
| 2024 | NT$ 2,025 | 2026E | 2027E | 2028E | |
|---|---|---|---|---|---|
| Growth(%) | |||||
| Turnover | 7.2 | 38.7 | 4.9 | 338.1 | 171.0 |
| Operating profits | 60.3 | -100.5 | -26622.3 | -1787.3 | 195.0 |
| Pretax profits | -1091.4 | -140.4 | -353.0 | -3937.1 | 191.5 |
| Net profits | -500.3 | -133.5 | -380.8 | -4044.4 | 191.5 |
| EPS | -441.3 | -133.4 | -366.6 | -4044.4 | 191.5 |
| Margins (%) | |||||
| Gross Margin | 13.1 | 18.8 | 18.7 | 36.7 | 38.4 |
| Operating Margin | -6.8 | 0.0 | -6.5 | 25.1 | 27.3 |
| Pretax Margin | -4.1 | 1.2 | -2.9 | 25.5 | 27.4 |
| Net Profit | -3.5 | 0.9 | -2.3 | 20.6 | 22.2 |
| Return (%) | |||||
| ROAE | (2.1) | 0.6 | (1.8) | 55.0 | 78.6 |
| ROAA | (1.8) | 0.5 | (1.1) | 20.5 | 29.2 |
| Gearing (%) | |||||
| Net Debt/Equity | (58.1) | (49.4) | (74.0) | (98.3) | (83.0) |
| Liabilities/Equity | 17.3 | 23.9 | 121.0 | 195.9 | 156.8 |
| Ratios (X) | |||||
| Current ratio | 6.2 | 4.2 | 3.6 | 4.0 | 3.9 |
| Quick ratio | 5.1 | 3.2 | 3.0 | 3.3 | 3.1 |
| Others | |||||
| AR/NR Turnover (days) | 75 | 54 | 54 | 54 | 54 |
| Inventory Turnover (days) | 82 | 83 | 83 | 83 | 83 |
| AP Turnover (days) | 49 | 47 | 47 | 47 | 47 |
| Cash Conversion (days) | 108 | 90 | 90 | 90 | 90 |
M
Risk Reward Reference links
- View explanation of Options Probabilities methodology -Options_Probabilities_Exhibit_Link.pdf
- View descriptions of Risk Rewards Themes - RR_Themes_Exhibit_Link.pdf
-
View explanation of regional hierarchies - GEG_Exhibit_Link.pdf
-
View explanation of Theme/Exposure methodology -
-
ESG_Sustainable_Solutions_External_Link.pdf
- View explanation of HERS methodology - ESG_HERS_External_Link.pdf
M
Disclosure Section
The information and opinions in Morgan Stanley Research were prepared or are disseminated by Morgan Stanley Asia Limited (which accepts the responsibility for its contents) and/or Morgan Stanley Asia (Singapore) Pte. (Registration number 199206298Z) and/or Morgan Stanley Asia (Singapore) Securities Pte Ltd (Registration number 200008434H), regulated by the Monetary Authority of Singapore (which accepts legal responsibility for its contents and should be contacted with respect to any matters arising from, or in connection with, Morgan Stanley Research), and/or Morgan Stanley Taiwan Limited and/or Morgan Stanley & Co International plc, Seoul Branch, and/or Morgan Stanley Australia Limited (A.B.N. 67 003 734 576, holder of Australian financial services license No. 233742, which accepts responsibility for its contents), and/or Morgan Stanley Wealth Management Australia Pty Ltd (A.B.N. 19 009 145 555, holder of Australian financial services license No. 240813, which accepts responsibility for its contents), and/or Morgan Stanley India Company Private Limited having Corporate Identification No (CIN) U22990MH1998PTC115305, regulated by the Securities and Exchange Board of India ('SEBI') and holder of licenses as a Research Analyst (SEBI Registration No. INH000001105); Stock Broker (SEBI Stock Broker Registration No. INZ000244438), Merchant Banker (SEBI Registration No. INM000011203), and depository participant with National Securities Depository Limited (SEBI Registration No. IN-DP-NSDL-567-2021) having registered office at Altimus, Level 39 & 40, Pandurang Budhkar Marg, Worli, Mumbai 400018, India; Telephone no. +91-22-61181000; Compliance Officer Details: Mr. Tejarshi Hardas, Tel. No.: +91-22-61181000 or Email: tejarshi.hardas@morganstanley.com; Grievance officer details: Mr. Tejarshi Hardas, Tel. No.: +91-22-61181000 or Email: msic-compliance@morganstanley.com which accepts the responsibility for its contents and should be contacted with respect to any matters arising from, or in connection with, Morgan Stanley Research, and their affiliates (collectively, "Morgan Stanley"). Morgan Stanley India Company Private Limited (MSICPL) may use AI tools in providing research services. All recommendations contained herein are made by the duly qualified research analysts.
For important disclosures, stock price charts and equity rating histories regarding companies that are the subject of this report, please see the Morgan Stanley Research Disclosure Website at www.morganstanley.com/eqr/disclosures/webapp/generalresearch, or contact your investment representative or Morgan Stanley Research at 1585 Broadway, (Attention: Research Management), New York, NY, 10036 USA.
For valuation methodology and risks associated with any recommendation, rating or price target referenced in this research report, please contact the Client Support Team as follows: US/Canada +1 800 303-2495; Hong Kong +852 2848-5999; Latin America +1 718 754-5444 (U.S.); London +44 (0)20-7425-8169; Singapore +65 6834-6860; Sydney +61 (0)2-9770-1505; Tokyo +81 (0)3-6836-9000. Alternatively you may contact your investment representative or Morgan Stanley Research at 1585 Broadway, (Attention: Research Management), New York, NY 10036 USA.
圖片清單(已驗證 2026-07-06)
| 檔名 | 大小 | 分類 | 內容摘要 |
|---|---|---|---|
| 2026-07-05 ms_CPO Supply Chain Updates_20260705_001.png | 66KB | 裝飾 | "Asia Summer School 2026" 廣告 banner |
| 2026-07-05 ms_CPO Supply Chain Updates_20260705_002.png | 380KB | 真資料圖 | Corning CPO Tray 實物展示,含 Fiber Array Units(展覽照片) |
| 2026-07-05 ms_CPO Supply Chain Updates_20260705_003.png | 319KB | 真資料圖 | Wiwynn CPO 生態圖:CORNING/FOCI/SENKO/DROWAYS FAU 供應商,FOCI 機箱光纖方案 |
| 2026-07-05 ms_CPO Supply Chain Updates_20260705_004.png | 121KB | 真資料圖 | TPC FAU 產品:MMC-FAU DR Series(400G/800G)及 16F MT-90 FAU(CPO/Silicon photonics 800G/1.6T) |
| 2026-07-05 ms_CPO Supply Chain Updates_20260705_005.png | 186KB | 真資料圖 | FAU 全自動封裝系統示意圖(Fully Automated Packaging + Active Angle Optimization) |
| 2026-07-05 ms_CPO Supply Chain Updates_20260705_006.png | 97KB | 真資料圖 | Corning GlassBridge 玻璃基板 FAU 產品外觀 |
| 2026-07-05 ms_CPO Supply Chain Updates_20260705_007.png | 171KB | 真資料圖 | GlassBridge 架構圖:PIC 層整合,支援多 GlassBridge 元件於單一 PIC |
| 2026-07-05 ms_CPO Supply Chain Updates_20260705_009.png | 187KB | 真資料圖 | CPO 測試插入路線圖(Ins1-5):TSMC wafer→OSAT die/module 完整測試流程,2025-2027 產品時間軸 |
| 2026-07-05 ms_CPO Supply Chain Updates_20260705_011.png | 278KB | 真資料圖 | TSMC COUPE 技術路線:1.6Tbps 2025 可插拔→6.4Tbps 2026 CPO Switch→12.8Tbps XPU interposer pathfinding |
| 2026-07-05 ms_CPO Supply Chain Updates_20260705_012.png | 146KB | 真資料圖 | Marvell CPO 世代:TH4/TH5/TH6-Davisson(>1M device hours 0 link flaps),Gen4 400G/lane 開發中 |
| 2026-07-05 ms_CPO Supply Chain Updates_20260705_013.png | 73KB | 裝飾 | 晶片產品攝影(行銷用) |
| 2026-07-05 ms_CPO Supply Chain Updates_20260705_014.png | 64KB | 裝飾 | 晶片產品攝影(行銷用) |
| 2026-07-05 ms_CPO Supply Chain Updates_20260705_015.png | 193KB | 真資料圖 | FOCI SiPh Roadmap:2025 1.6T OSFP pluggable → 2026 CPO Switch 6.4T → 2026+ CPO XPU 12.8T |
| 2026-07-05 ms_CPO Supply Chain Updates_20260705_016.png | 241KB | 真資料圖 | FOCI Advanced Technologies:FAU 挑戰 vs 解方(20/40/80ch FAU 完成,ReLFACon™),含 V-groove 截面圖 |
| 2026-07-05 ms_CPO Supply Chain Updates_20260705_017.png | 46KB | 真資料圖 | FOCI ReLFACon™ 示意:Switch/XPU 堆疊於 PIC/EIC/Si 基板→ReLFACon™ 產品照 |
| 2026-07-05 ms_CPO Supply Chain Updates_20260705_022.png | 62KB | 真資料圖 | 某公司 P/E 歷史走勢(Jan-13 至 Jan-26),附均值與 ±1/2 SD |
| 2026-07-05 ms_CPO Supply Chain Updates_20260705_028.png | 79KB | 真資料圖 | MS 目標價歷史(Jul-23 至 Jul-26),最新 PT ~NT$381,000 |
| 2026-07-05 ms_CPO Supply Chain Updates_20260705_029.png | 72KB | 真資料圖 | MS 目標價歷史(Jul-23 至 Jul-26),最新 PT ~NT$304,800 |
| 2026-07-05 ms_CPO Supply Chain Updates_20260705_030.png | 79KB | 真資料圖 | MS 目標價歷史(Jul-23 至 Jul-26),最新 PT ~NT$2,600,000 |