資料修復紀錄(2026-08-13)
pdf_trim 腳本因第 1 頁頁腳即含免責聲明關鍵字,誤判全文為免責聲明並砍成 139 行(僅剩開頭段落)。本檔已改用 proceed/3.unprocessed_data/parsed/ms_Asustek_20260812.md(完整解析版,676 行)重新落地,含完整 Disclosure Section、Stock Ratings、Industry Coverage 等章節。
PDF 原檔:報告_MS_華碩2357_20260812_original.pdf
圖片清單(已驗證 2026-08-13)
| 檔名 | size | 分類 | 親眼所見內容 |
|---|---|---|---|
ms_Asustek_20260812_003.png |
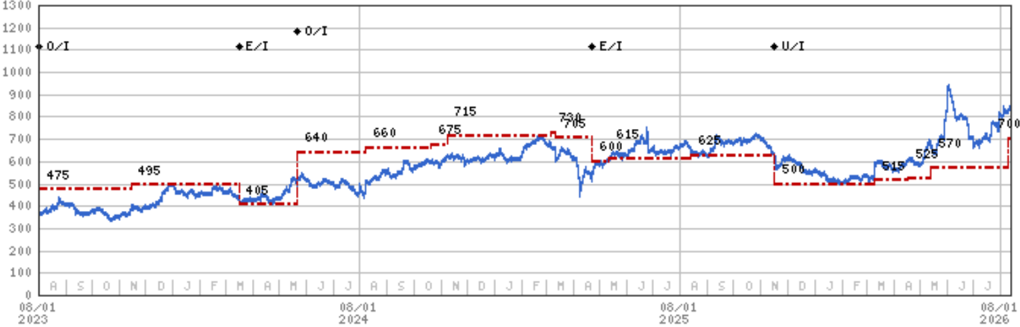
77KB | 真資料圖 | 華碩(2357.TW)股價與目標價/評等沿革圖,橫軸 08/01/2023–08/01/2026,縱軸價格 0–1300,標示歷次目標價變動節點(475→495→405→640→660→675→715→730/705→615/600→625→500→515→525→570→700),末端標 700 |
ms_Asustek_20260812_002.png |
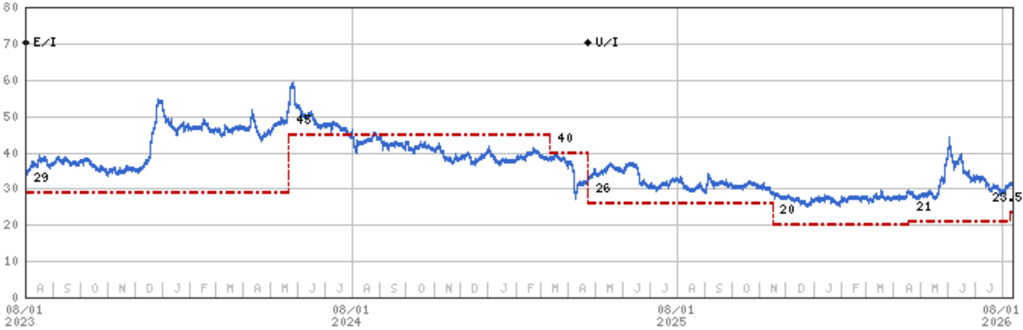
64KB | 真資料圖 | 宏碁(Acer 2353.TW)股價與目標價/評等沿革圖,橫軸 08/01/2023–08/01/2026,縱軸價格 0–80,標示目標價變動節點(29→45→40→26→20→21→23.5) |
ms_Asustek_20260812_004.png |
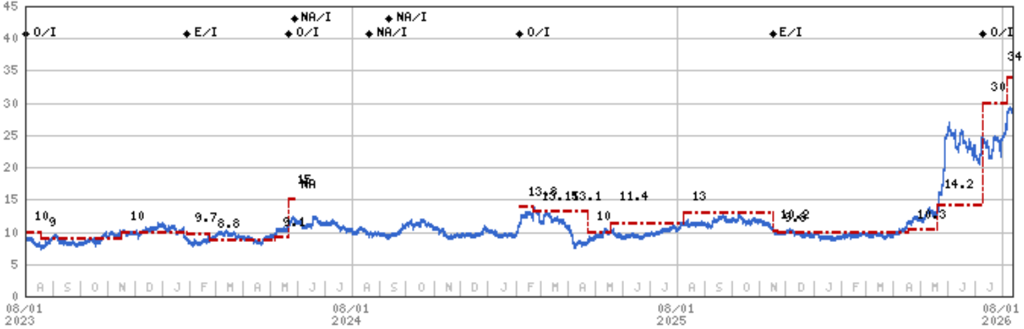
69KB | 真資料圖 | 聯想(Lenovo 0992.HK)股價與目標價/評等沿革圖,橫軸 08/01/2023–08/01/2026(HKD),縱軸價格 0–45,標示目標價變動節點,末端標 30、34 |
ms_Asustek_20260812_001.png |
66KB | 裝飾·banner | 「Asia Summer School 2026」藍色水池背景橫幅廣告,非資料圖 |
三張股價圖對應報告末段「Stock Price, Price Target and Rating History」章節,分別為華碩本身及同業比較(宏碁、聯想);<40KB 未逐張列出(預設 logo)。
原始內容
M August 12, 2026 11:24 AM GMT
Asustek Computer Inc. | Asia Pacific
2Q OP beat MSe by 38% and consensus by 87%
AlphaSignals Earnings Reaction
Unchanged
Impact to our thesis
Source: Company data, Morgan Stanley Research
Key Takeaways
- We underestimated Asustek's pricing power, and expect the stock to react positively on the material 2Q beat.
- CY26 server revenue guidance raised to +150% y/y (up from +100% y/y).
- Management maintained its mid-term OpM guidance at 4-5%, which we view as conservative given the stronger revenue outlook.
2Q operating profit came in 38% above MSe and 87% above the Street:
- GM was 16.5% (+280bps q/q, +420bps y/y) - 390bps above MSe and 350bps above the Street
- OpM was 8.1% (+270bps q/q, +470bps y/y) - 230bps above MSe and 350bps above the Street
- Net profit reached NT$19.0B (+94% q/q and y/y) for EPS of NT$25.64, 34% above MSe and 79% above the Street
- 2Q mix: System 45%, Open Platform 19%, IS 36% (HGX 60%, NVL72 30%, General Server 10%)
3Q outlook:
- PC revenue +15% to 20% q/q (driven by volume and price, roughly 50/50)
- Component revenue +5-10% q/q
- Server revenue +10-15% q/q
Meaningful upside
Financial results versus consensus
Meaningful revision higher Direction of next 12-month consensus EPS
Morgan Stanley Taiwan Limited+
Howard Kao
Equity Analyst
Howard.Kao@morganstanley.com
+886 2 2730-2989
Irene Yen
Research Associate
Irene.Yen@morganstanley.com
+886 2 2730-2869
Morgan Stanley Asia Limited+
Andy Meng, CFA
Equity Analyst
Andy.Meng@morganstanley.com
+852 2239-7689

Asustek Computer Inc. (2357.TW, 2357 TT)
Greater China Technology Hardware | Taiwan
Stock Rating Industry View
Underweight In-Line
Price target
NT$700.00
Up/downside to price target (%)
(18)
Shr price, close (Aug 12, 2026)
NT$852.00
52-Week Range
NT$964.00-490.00
Sh out, dil, curr (mn)
743
Mkt cap, curr (mn)
NT$632,832
EV, curr (mn)
NT$544,316
Avg daily trading value (mn)
NT$2,918
| Fiscal Year Ending | 12/25 | 12/26e | 12/27e | 12/28e |
|---|---|---|---|---|
| EPS (NT$)** | 59.99 | 65.16 | 68.06 | 69.60 |
| Prior EPS (NT$)** | - | - | - | - |
| EPS (NT$)§ | 56.11 | 55.67 | 61.46 | 64.74 |
| Revenue, net (NT$ mn) | 688,935 | 881,855 | 980,967 | 1,112,15 7 |
| EBITDA (NT$ mn) | 35,091 | 52,492 | 54,496 | 56,033 |
| ModelWare net inc (NT | 44,558 | 48,399 | 50,556 | 51,695 |
| $ mn) | ||||
| P/E | 9.1 | 13.1 | 12.5 | 12.2 |
| P/BV | 1.4 | 2.1 | 2.0 | 1.7 |
| ROE (%) | 16.5 | 16.8 | 16.7 | 16.2 |
| EV/EBITDA | 9.1 | 10.3 | 9.8 | 8.8 |
| Div yld (%) | 6.2 | 5.4 | 5.6 | 0.0 |
Unless otherwise noted, all metrics are based on Morgan Stanley ModelWare framework
** = Based on consensus methodology
§ = Consensus data is provided by Refinitiv Estimates
e = Morgan Stanley Research estimates
Morgan Stanley does and seeks to do business with companies covered in Morgan Stanley Research. As a result, investors should be aware that the firm may have a conflict of interest that could affect the objectivity of Morgan Stanley Research. Investors should consider Morgan Stanley Research as only a single factor in making their investment decision.
For analyst certification and other important disclosures, refer to the Disclosure Section, located at the end of this report.
+= Analysts employed by non-U.S. affiliates are not registered with FINRA, may not be associated persons of the member and may not be subject to FINRA restrictions on communications with a subject company, public appearances and trading securities held by a research analyst account.
Update
Year to Dec. 31
(NTSm)
COGS
MSe
2Q26
MS Forecast Diff.%
2Q26E
Cons.
2Q26E
M
Operating income
Exhibit 1 : Asustek's 2Q26 result summary table
Pre-tax income
Income tax
Net income
EPS (NTS)
Margins
Gross margin
Operating margin
Pretax margin
Net margin
10,502
2,775
| 24,674 (5,626) | 101% 122% | 18,058 37% (3,837) | 13,277 (2,655) 86% | |||
|---|---|---|---|---|---|---|
| 19,048 | 94% | 94% | 14,221 | 34% | 10,622 | 79% |
| 19.15 | ||||||
| ppt 2.8 | ppt 4.2 | ppt 3.9 | ppt 3.5 | |||
| 16.5% | 12.7% | 5.9% | 13.0% | |||
| 8.1% | 2.7 | 4.7 | 2.3 2.7 | 4.6% 5.9% | 3.5 | |
| 10.2% 7.9% | 3.9 2.9 | 3.9 | 7.5% F | 2.0 | 4.4 3.2 | |
| 2.3 | 5.9% | 4.7% | ||||
| Amaa aamnaandaaaaanhannaan waalamanaana |
Source: Company data, Visible Alpha, Morgan Stanley Research estimates.
Q/Q
Y/Y
Diff. %
7%
36%
87%
M
Valuation Methodology and Risks
Lenovo (0992.HK)
Base case, residual income model. Our key assumptions include a cost of equity of 9.3% (based on a beta of 1.1, risk-free rate of 2.0%), a medium-term growth rate of 5.0%, and a terminal growth rate of 3.0%.
Risks to Upside
- n Faster-than-expected smartphone and data center turnaround
- n Stronger PC demand recovery in China
- n Better cost savings and improved product mix
- n Lower-than-expected increase in memory price
Risks to Downside
- n Slower-than-expected smartphone and data center turnaround
- n Weaker PC demand recovery in China
- n Deterioration in cost savings and product mix
- n Higher-than-expected increase in memory price
Acer Inc. (2353.TW)
Base case, residual income model. We use RI model for Acer's valuation. Key assumptions include a cost of equity of 9.2% (beta of 0.9, equity risk premium of 10.2% and risk-free rate of 0.5%), a 6.0% medium-term growth rate, and a 3% terminal growth rate.
Risks to Upside
- n Stronger macro recovery than expected
- n Share gains in the PC market
- n Better-than-expected cost controls
- n Lower-than-expected increase in memory cost
Risks to Downside
- n Weaker macro recovery than expected
- n Share loss in the PC market
- n Worse-than-expected cost controls
- n Higher-than-expected increase in memory cost
Asustek Computer Inc. (2357.TW)
Base case, sum of the parts:
We apply a 9x multiple to Asustek's 2026 brand profits. This is somewhat below the midpoint of its historical band of 7-15x since 2009, which we view as fair because memory prices are rising and will have a negative impact on margins.
We value its stakes in Pegatron and Advantech based on our price targets in proportion to Asustek's holdings.
M
Risks to Upside
- n Stronger global NB demand
- n Stronger AI server demand
- n Stronger ROG Ally demand
- n Better margin recovery
- n Slower rise of memory prices
Risks to Downside
- n Weaker global NB demand
- n Weaker AI server demand
- n Weaker ROG Ally demand
- n Slower margin recovery
- n Memory prices rises faster than expected
M
Disclosure Section
The information and opinions in Morgan Stanley Research were prepared or are disseminated by Morgan Stanley Asia Limited (which accepts the responsibility for its contents) and/or Morgan Stanley Asia (Singapore) Pte. (Registration number 199206298Z) and/or Morgan Stanley Asia (Singapore) Securities Pte Ltd (Registration number 200008434H), regulated by the Monetary Authority of Singapore (which accepts legal responsibility for its contents and should be contacted with respect to any matters arising from, or in connection with, Morgan Stanley Research), and/or Morgan Stanley Taiwan Limited and/or Morgan Stanley & Co International plc, Seoul Branch, and/or Morgan Stanley Australia Limited (A.B.N. 67 003 734 576, holder of Australian financial services license No. 233742, which accepts responsibility for its contents), and/or Morgan Stanley Wealth Management Australia Pty Ltd (A.B.N. 19 009 145 555, holder of Australian financial services license No. 240813, which accepts responsibility for its contents), and/or Morgan Stanley India Company Private Limited having Corporate Identification No (CIN) U22990MH1998PTC115305, regulated by the Securities and Exchange Board of India ('SEBI') and holder of licenses as a Research Analyst (SEBI Registration No. INH000001105); Stock Broker (SEBI Stock Broker Registration No. INZ000244438), Merchant Banker (SEBI Registration No. INM000011203), and depository participant with National Securities Depository Limited (SEBI Registration No. IN-DP-NSDL-567-2021) having registered office at Altimus, Level 39 & 40, Pandurang Budhkar Marg, Worli, Mumbai 400018, India; Telephone no. +91-22-61181000; Compliance Officer Details: Mr. Tejarshi Hardas, Tel. No.: +91-22-61181000 or Email: tejarshi.hardas@morganstanley.com; Grievance officer details: Mr. Tejarshi Hardas, Tel. No.: +91-22-61181000 or Email: msic-compliance@morganstanley.com which accepts the responsibility for its contents and should be contacted with respect to any matters arising from, or in connection with, Morgan Stanley Research, and their affiliates (collectively, "Morgan Stanley"). Morgan Stanley India Company Private Limited (MSICPL) may use AI tools in providing research services. All recommendations contained herein are made by the duly qualified research analysts.
For important disclosures, stock price charts and equity rating histories regarding companies that are the subject of this report, please see the Morgan Stanley Research Disclosure Website at www.morganstanley.com/eqr/disclosures/webapp/generalresearch, or contact your investment representative or Morgan Stanley Research at 1585 Broadway, (Attention: Research Management), New York, NY, 10036 USA.
For valuation methodology and risks associated with any recommendation, rating or price target referenced in this research report, please contact the Client Support Team as follows: US/Canada +1 800 303-2495; Hong Kong +852 2848-5999; Latin America +1 718 754-5444 (U.S.); London +44 (0)20-7425-8169; Singapore +65 6834-6860; Sydney +61 (0)2-9770-1505; Tokyo +81 (0)3-6836-9000. Alternatively you may contact your investment representative or Morgan Stanley Research at 1585 Broadway, (Attention: Research Management), New York, NY 10036 USA.
Analyst Certification
The following analysts hereby certify that their views about the companies and their securities discussed in this report are accurately expressed and that they have not received and will not receive direct or indirect compensation in exchange for expressing specific recommendations or views in this report: Howard Kao; Andy Meng, CFA.
.
Global Research Conflict Management Policy
Morgan Stanley Research has been published in accordance with our conflict management policy, which is available at www.morganstanley.com/institutional/research/conflictpolicies. A Portuguese version of the policy can be found at www.morganstanley.com.br
Important Regulatory Disclosures on Subject Companies
As of July 31, 2026, Morgan Stanley beneficially owned 1% or more of a class of common equity securities of the following companies covered in Morgan Stanley Research: AAC Technologies Holdings, Accelink Technologies Co. Ltd., Acer Inc., AirTAC International, Auras Technology Co Ltd, Catcher Technology, Chenbro, Compal Electronics, Delta Electronics Inc., E Ink Holdings Inc., Eoptolink Technology Inc Ltd, Fositek Corp, Genius Electronic Optical Co. Ltd., Gold Circuit Electronics Ltd., Hiwin Technologies Corp., Innolux, Inspur Electronic Information, LandMark Optoelectronics Corporation, LianChuang Electronic Technology Co Ltd, Lingyi Itech Guangdong Co, Lite-On Technology, Lotes Co. Ltd., Nan Ya PCB, Quanta Computer Inc., Sunny Optical, Suzhou TFC Optical Communication Co Ltd., Unimicron, Visual Photonics Epitaxy Co Ltd, Wistron Corporation, Wiwynn Corp, Xiaomi Corp, Yageo Corp., Yangtze Optical Fibre and Cable JSC Ltd, Zhejiang Crystal-Optech Co Ltd, Zhen Ding, Zhongji Innolight Co Ltd, ZTE Corporation.
Within the last 12 months, Morgan Stanley managed or co-managed a public offering (or 144A offering) of securities of Unimicron, Wistron Corporation, Wiwynn Corp, Zhen Ding, Zhongji Innolight Co Ltd.
Within the last 12 months, Morgan Stanley has received compensation for investment banking services from Lenovo, Unimicron, Wistron Corporation, Wiwynn Corp, Xiaomi Corp, Yageo Corp., Zhen Ding, Zhongji Innolight Co Ltd.
In the next 3 months, Morgan Stanley expects to receive or intends to seek compensation for investment banking services from AAC Technologies Holdings, Accton Technology Corporation, Acer Inc., Advantech, AirTAC International, Asia Vital Components Co. Ltd., Asustek Computer Inc. , AU Optronics, Bizlink, Catcher Technology, Chenbro, Compal Electronics, Delta Electronics Inc., E Ink Holdings Inc., Ennostar Inc, Eoptolink Technology Inc Ltd, FIT Hon Teng Ltd, Giga-Byte Technology Co. Ltd., GoerTek Inc, Gold Circuit Electronics Ltd., Hon Hai Precision, Innolux, Lenovo, Lens Technology, Lingyi Itech Guangdong Co, Lite-On Technology, Luxshare Precision Industry Co., Ltd., Pegatron Corporation, Q Technology (Group) Company Ltd, Quanta Computer Inc., Shanghai Conant Optical Co Ltd, Shenzhen Transsion Holdings Co Ltd, Suzhou TFC Optical Communication Co Ltd., TCL Corp., Unimicron, Wistron Corporation, Wiwynn Corp, Xiaomi Corp, Yageo Corp., Yangtze Optical Fibre and Cable JSC Ltd, Zhen Ding, Zhongji Innolight Co Ltd.
Within the last 12 months, Morgan Stanley has received compensation for products and services other than investment banking services from AAC Technologies Holdings, Accton Technology Corporation, Acer Inc., Asustek Computer Inc. , AU Optronics, BYD Electronics, Compal Electronics, E Ink Holdings Inc., Eoptolink Technology Inc Ltd, Giga-Byte Technology Co. Ltd., GoerTek Inc, Hon Hai Precision, Innolux, Lenovo, Lingyi Itech Guangdong Co, Quanta Computer Inc., Xiaomi Corp, Yageo Corp..
Within the last 12 months, Morgan Stanley has provided or is providing investment banking services to, or has an investment banking client relationship with, the following company: AAC Technologies Holdings, Accton Technology Corporation, Acer Inc., Advantech, AirTAC International, Asia Vital Components Co. Ltd., Asustek Computer Inc. , AU Optronics, Bizlink, Catcher Technology, Chenbro, Compal Electronics, Delta Electronics Inc., E Ink Holdings Inc., Ennostar Inc, Eoptolink Technology Inc Ltd, FIT Hon Teng Ltd, Giga-Byte Technology Co. Ltd., GoerTek Inc, Gold Circuit Electronics Ltd., Hon Hai Precision, Innolux, Lenovo, Lens Technology, Lingyi Itech Guangdong Co, Lite-On Technology, Luxshare Precision Industry Co., Ltd., Pegatron Corporation, Q Technology (Group) Company Ltd, Quanta Computer Inc., Shanghai Conant Optical Co Ltd, Shenzhen Transsion Holdings Co Ltd, Suzhou TFC Optical Communication Co Ltd., TCL Corp., Unimicron, Wistron Corporation, Wiwynn Corp, Xiaomi Corp, Yageo Corp., Yangtze Optical Fibre and Cable JSC Ltd, Zhen Ding, Zhongji Innolight Co Ltd.
Within the last 12 months, Morgan Stanley has either provided or is providing non-investment banking, securities-related services to and/or in the past has entered into an agreement to provide services or has a client relationship with the following company: AAC Technologies Holdings, Accton Technology Corporation, Acer Inc., Asustek Computer Inc. , AU Optronics, BYD Electronics, Compal Electronics, E Ink Holdings Inc., Eoptolink Technology Inc Ltd, Giga-Byte Technology Co. Ltd., GoerTek Inc, Hon Hai Precision, Innolux, Lenovo, Lingyi Itech Guangdong Co, Quanta Computer Inc., Xiaomi Corp, Yageo Corp., Zhen Ding.
The equity research analysts or strategists principally responsible for the preparation of Morgan Stanley Research have received compensation based upon various factors, including quality of research, investor client feedback, stock picking, competitive factors, firm revenues and overall investment banking revenues. Equity Research analysts' or strategists' compensation is not
M
linked to investment banking or capital markets transactions performed by Morgan Stanley or the profitability or revenues of particular trading desks.
Morgan Stanley and its affiliates do business that relates to companies/instruments covered in Morgan Stanley Research, including market making, providing liquidity, fund management, commercial banking, extension of credit, investment services and investment banking. Morgan Stanley sells to and buys from customers the securities/instruments of companies covered in Morgan Stanley Research on a principal basis. Morgan Stanley may have a position in the debt of the Company or instruments discussed in this report. Morgan Stanley trades or may trade as principal in the debt securities (or in related derivatives) that are the subject of the debt research report.
Certain disclosures listed above are also for compliance with applicable regulations in non-US jurisdictions.
STOCK RATINGS
Morgan Stanley uses a relative rating system using terms such as Overweight, Equal-weight, Not-Rated or Underweight (see definitions below). Morgan Stanley does not assign ratings of Buy, Hold or Sell to the stocks we cover. Overweight, Equal-weight, Not-Rated and Underweight are not the equivalent of buy, hold and sell. Investors should carefully read the definitions of all ratings used in Morgan Stanley Research. In addition, since Morgan Stanley Research contains more complete information concerning the analyst's views, investors should carefully read Morgan Stanley Research, in its entirety, and not infer the contents from the rating alone. In any case, ratings (or research) should not be used or relied upon as investment advice. An investor's decision to buy or sell a stock should depend on individual circumstances (such as the investor's existing holdings) and other considerations.
Global Stock Ratings Distribution
(as of July 31, 2026)
The Stock Ratings described below apply to Morgan Stanley's Fundamental Equity Research and do not apply to Debt Research produced by the Firm.
For disclosure purposes only (in accordance with FINRA requirements), we include the category headings of Buy, Hold, and Sell alongside our ratings of Overweight, Equal-weight, Not-Rated and Underweight. Morgan Stanley does not assign ratings of Buy, Hold or Sell to the stocks we cover. Overweight, Equal-weight, Not-Rated and Underweight are not the equivalent of buy, hold, and sell but represent recommended relative weightings (see definitions below). To satisfy regulatory requirements, we correspond Overweight, our most positive stock rating, with a buy recommendation; we correspond Equal-weight and Not-Rated to hold and Underweight to sell recommendations, respectively.
| Coverage Universe | Coverage Universe | Investment Banking Clients (IBC) | Investment Banking Clients (IBC) | Investment Banking Clients (IBC) | Other Material Investment Services Clients (MISC) | Other Material Investment Services Clients (MISC) | |
|---|---|---|---|---|---|---|---|
| Stock Rating Category | Count | %of Total | Count | %of Total IBC | %of Rating Category | Count | %of Total Other MISC |
| Overweight/Buy | 1529 | 42% | 442 | 47% | 29% | 750 | 43% |
| Equal-weight/Hold | 1582 | 43% | 396 | 42% | 25% | 773 | 44% |
| Not-Rated/Hold | 3 | 0% | 1 | 0% | 33% | 1 | 0% |
| Underweight/Sell | 560 | 15% | 97 | 10% | 17% | 217 | 12% |
| Total | 3,674 | 936 | 1741 |
Data include common stock and ADRs currently assigned ratings. Investment Banking Clients are companies from whom Morgan Stanley received investment banking compensation in the last 12 months. Due to rounding off of decimals, the percentages provided in the "% of total" column may not add up to exactly 100 percent.
Analyst Stock Ratings
Overweight (O). The stock's total return is expected to exceed the average total return of the analyst's industry (or industry team's) coverage universe, on a risk-adjusted basis, over the next 12-18 months.
Equal-weight (E). The stock's total return is expected to be in line with the average total return of the analyst's industry (or industry team's) coverage universe, on a risk-adjusted basis, over the next 12-18 months.
Not-Rated (NR). Currently the analyst does not have adequate conviction about the stock's total return relative to the average total return of the analyst's industry (or industry team's) coverage universe, on a risk-adjusted basis, over the next 12-18 months.
Underweight (U). The stock's total return is expected to be below the average total return of the analyst's industry (or industry team's) coverage universe, on a risk-adjusted basis, over the next 12-18 months.
Unless otherwise specified, the time frame for price targets included in Morgan Stanley Research is 12 to 18 months.
Analyst Industry Views
Attractive (A): The analyst expects the performance of his or her industry coverage universe over the next 12-18 months to be attractive vs. the relevant broad market benchmark, as indicated below.
In-Line (I): The analyst expects the performance of his or her industry coverage universe over the next 12-18 months to be in line with the relevant broad market benchmark, as indicated below. Cautious (C): The analyst views the performance of his or her industry coverage universe over the next 12-18 months with caution vs. the relevant broad market benchmark, as indicated below. Benchmarks for each region are as follows: North America - S&P 500; Latin America - relevant MSCI country index or MSCI Latin America Index; Europe - MSCI Europe; Japan - TOPIX; Asia relevant MSCI country index or MSCI sub-regional index or MSCI AC Asia Pacific ex Japan Index.
Stock Price, Price Target and Rating History (See Rating Definitions)
80
13 0 0
1200
70 + E/I
1000
60
900
50
800
700
40
600
500
$ 0
400
20
300
200
10
100
08/01
2028
2025
Industry : Greater China Technology Hardware
Asustek Computer Inc. (2357.TW) - As of 08/12/26 GMT in TWD
Acer Inc. (2353.TW) - As of 08/12/26 GMT in TWD
Industry : Greater China Technology Hardware
M
-
U/I
-
E/I
715 FIS
relative to the analyst?s industry
06/01
Industry View: Attractive dAb In-line iI Cautious (C) No Rating Effective January 10, 2014, the stocks covered by Morgan Stanley Asia Pacific will be rated Stock and Industry Ratings cabbraviations below, appear as * Stock Rating/Industry View Stock Ratings: Querueight coo Equal-night dE) Underueight dup Not-Rated iNR. No Rating Available ina.
cor industry team'si courage. Effective January 15, 2014, the industry view benchwarks for Morgan Stanley Asia Pacific are as follous! relevant MSCI country Industry View: Attracting cao No Rating iNRI Effective January 10, 2014, the stocks covered by Horgan Stanley Asia Pacifie will be rated relative to the analysts industry ion industry team'si coverage.
index or MSCI sub-regional index or MSCI AC Asia Pacific ex Japan Index.
Etfective January 10. 2014, the industry view benchmarks for Horgan Stanley Asia Pacific are as follous! relauant MSCI country index or MSCI sub-regional index or HSCI AC Asia Pacific ex Japan Index.
- U/1
475
45
40 + 0/1
35
$0
25
20
15
5
06/01
2025
2/5/25 : 0/17 11/16/25 : E/I; 7/10/25 : 0/1
7/10/26 : 60F 8/7/26 : 94
Lenovo (0992.HK) - As of 08/12/26 GMT in HKD
Industry : Greater China Technology Hardware
M
$ 0/1
34
$ 0,
Source: Morgan Stanley Research Date Format. : MM/DD./Y7 Price Target. No Price Target Assigned ¿NAS Stock Price iNot Covered by Current Analyst Stock Price (Covered by Current Analyst imm Stock and Industry Ratings cabbraviations below, appear as + Stock Rating/Industry View
Stock Ratings: Querueight 600 Equal-weight. (E) Underweight 60) Not.-Rated (NR) No Rating Available iNA Industry View: Attractine CAD In-line tIl Cautious ceo No Rating CNRy Effective January 16, 2014, the stocks covered by Morgan Stanley Asia Pacifie will be rated relative to the analyst's industry
Cor industry team si courage. Effective January 15, 2014, the industry view benchwarks for Morgan Stanley Asia Pacific are as follous! releuant MSCI country index or MSCI sub-regional index or MSCI AC Asia Pacific ex Japan Index.
Important Disclosures for Morgan Stanley Smith Barney LLC Customers
Important disclosures regarding any material conflict of interest that can reasonably be expected to have influenced Morgan Stanley Smith Barney LLC's choice of a third-party research provider or the subject company of a third-party research report, are available on the Morgan Stanley Wealth Management disclosure website at www.morganstanley.com/online/researchdisclosures. For Morgan Stanley specific disclosures, you may refer to https://www.morganstanley.com/eqr/disclosures/webapp/generalresearch.
Each Morgan Stanley research report is reviewed and approved on behalf of Morgan Stanley Smith Barney LLC. This review and approval is conducted by the same person who reviews the research report on behalf of Morgan Stanley. This could create a conflict of interest.
Other Important Disclosures
As of August 10, 2026, Morgan Stanley beneficially owned a net long position exceeding 0.5% of the total issued share capital of the following companies covered in Morgan Stanley Research: Lingyi Itech Guangdong Co.
Morgan Stanley Research policy is to update research reports as and when the Research Analyst and Research Management deem appropriate, based on developments with the issuer, the sector, or the market that may have a material impact on the research views or opinions stated therein. In addition, certain Research publications are intended to be updated on a regular periodic basis (weekly/monthly/quarterly/annual) and will ordinarily be updated with that frequency, unless the Research Analyst and Research Management determine that a different publication schedule is appropriate based on current conditions.
Morgan Stanley is not acting as a municipal advisor and the opinions or views contained herein are not intended to be, and do not constitute, advice within the meaning of Section 975 of the Dodd-Frank Wall Street Reform and Consumer Protection Act.
Morgan Stanley produces an equity research product called a "Tactical Idea." Views contained in a "Tactical Idea" on a particular stock may be contrary to the recommendations or views expressed in research on the same stock. This may be the result of differing time horizons, methodologies, market events, or other factors. For all research available on a particular stock, please contact your sales representative or go to Matrix at http://www.morganstanley.com/matrix.
Morgan Stanley Research is provided to our clients through our proprietary research portal on Matrix and also distributed electronically by Morgan Stanley to clients. Certain, but not all, Morgan Stanley Research products are also made available to clients through third-party vendors or redistributed to clients through alternate electronic means as a convenience. For access to all available Morgan Stanley Research, please contact your sales representative or go to Matrix at http://www.morganstanley.com/matrix.
Any access and/or use of Morgan Stanley Research is subject to Morgan Stanley's Terms of Use (http://www.morganstanley.com/terms.html). By accessing and/or using Morgan Stanley Research, you are indicating that you have read and agree to be bound by our Terms of Use (http://www.morganstanley.com/terms.html). In addition you consent to Morgan Stanley processing your personal data and using cookies in accordance with our Privacy Policy and our Global Cookies Policy (http://www.morganstanley.com/privacy_pledge.html), including for the purposes of setting your preferences and to collect readership data so that we can deliver better and more personalized service and products to you. To find out more information about how Morgan Stanley processes personal data, how we use cookies and how to reject cookies see our Privacy Policy and our Global Cookies Policy (http://www.morganstanley.com/privacy_pledge.html). Please use the provided link to review the Terms and Conditions and Most Important Terms and Conditions for Morgan Stanley India Company Private Limited (https://www.morganstanley.com/assets/
- E./I
M
pdfs/about-us-global-offices/india/Terms_and_conditions.pdf) and the following link to review the audit report (https://ny.matrix.ms.com/eqr/research/webapp/researchdocs/ MSICPL_Morgan_Stanley_Research_Audit_Report.pdf).
If you do not agree to our Terms of Use and/or if you do not wish to provide your consent to Morgan Stanley processing your personal data or using cookies please do not access our research. Morgan Stanley Research does not provide individually tailored investment advice. Morgan Stanley Research has been prepared without regard to the circumstances and objectives of those who receive it. Morgan Stanley recommends that investors independently evaluate particular investments and strategies, and encourages investors to seek the advice of a financial adviser. The appropriateness of an investment or strategy will depend on an investor's circumstances and objectives. The securities, instruments, or strategies discussed in Morgan Stanley Research may not be suitable for all investors, and certain investors may not be eligible to purchase or participate in some or all of them. Morgan Stanley Research is not an offer to buy or sell or the solicitation of an offer to buy or sell any security/instrument or to participate in any particular trading strategy. The value of and income from your investments may vary because of changes in interest rates, foreign exchange rates, default rates, prepayment rates, securities/instruments prices, market indexes, operational or financial conditions of companies or other factors. There may be time limitations on the exercise of options or other rights in securities/instruments transactions. Past performance is not necessarily a guide to future performance. Estimates of future performance are based on assumptions that may not be realized. If provided, and unless otherwise stated, the closing price on the cover page is that of the primary exchange for the subject company's securities/instruments.
The fixed income research analysts, strategists or economists principally responsible for the preparation of Morgan Stanley Research have received compensation based upon various factors, including quality, accuracy and value of research, firm profitability or revenues (which include fixed income trading and capital markets profitability or revenues), client feedback and competitive factors. Fixed Income Research analysts', strategists' or economists' compensation is not linked to investment banking or capital markets transactions performed by Morgan Stanley or the profitability or revenues of particular trading desks.
The "Important Regulatory Disclosures on Subject Companies" section in Morgan Stanley Research lists all companies mentioned where Morgan Stanley owns 1% or more of a class of common equity securities of the companies. For all other companies mentioned in Morgan Stanley Research, Morgan Stanley may have an investment of less than 1% in securities/instruments or derivatives of securities/instruments of companies and may trade them in ways different from those discussed in Morgan Stanley Research. Employees of Morgan Stanley not involved in the preparation of Morgan Stanley Research may have investments in securities/instruments or derivatives of securities/instruments of companies mentioned and may trade them in ways different from those discussed in Morgan Stanley Research. Derivatives may be issued by Morgan Stanley or associated persons.
With the exception of information regarding Morgan Stanley, Morgan Stanley Research is based on public information. Morgan Stanley makes every effort to use reliable, comprehensive information, but we make no representation that it is accurate or complete. We have no obligation to tell you when opinions or information in Morgan Stanley Research change apart from when we intend to discontinue equity research coverage of a subject company. Facts and views presented in Morgan Stanley Research have not been reviewed by, and may not reflect information known to, professionals in other Morgan Stanley business areas, including investment banking personnel.
Morgan Stanley Research personnel may participate in company events such as site visits and are generally prohibited from accepting payment by the company of associated expenses unless pre-approved by authorized members of Research management.
Morgan Stanley may make investment decisions that are inconsistent with the recommendations or views in this report.
To our readers based in Taiwan or trading in Taiwan securities/instruments: Information on securities/instruments that trade in Taiwan is distributed by Morgan Stanley Taiwan Limited ("MSTL"). Such information is for your reference only. The reader should independently evaluate the investment risks and is solely responsible for their investment decisions. Morgan Stanley Research may not be distributed to the public media or quoted or used by the public media without the express written consent of Morgan Stanley. Any non-customer reader within the scope of Article 7-1 of the Taiwan Stock Exchange Recommendation Regulations accessing and/or receiving Morgan Stanley Research is not permitted to provide Morgan Stanley Research to any third party (including but not limited to related parties, affiliated companies and any other third parties) or engage in any activities regarding Morgan Stanley Research which may create or give the appearance of creating a conflict of interest. Information on securities/instruments that do not trade in Taiwan is for informational purposes only and is not to be construed as a recommendation or a solicitation to trade in such securities/instruments. MSTL may not execute transactions for clients in these securities/instruments.
Certain information in Morgan Stanley Research was sourced by employees of the Shanghai Representative Office of Morgan Stanley Asia Limited for the use of Morgan Stanley Asia Limited. Morgan Stanley is not incorporated under PRC law and the research in relation to this report is conducted outside the PRC. Morgan Stanley Research does not constitute an offer to sell or the solicitation of an offer to buy any securities in the PRC. PRC investors shall have the relevant qualifications to invest in such securities and shall be responsible for obtaining all relevant approvals, licenses, verifications and/or registrations from the relevant governmental authorities themselves. Neither this report nor any part of it is intended as, or shall constitute, provision of any consultancy or advisory service of securities investment as defined under PRC law. Such information is provided for your reference only.
Morgan Stanley Research is disseminated in Brazil by Morgan Stanley C.T.V.M. S.A. located at Av. Brigadeiro Faria Lima, 3600, 6th floor, São Paulo - SP, Brazil; and is regulated by the Comissão de Valores Mobiliários; in Mexico by Morgan Stanley México, Casa de Bolsa, S.A. de C.V which is regulated by Comision Nacional Bancaria y de Valores. Paseo de los Tamarindos 90, Torre 1, Col. Bosques de las Lomas Floor 29, 05120 Mexico City; in Japan by Morgan Stanley MUFG Securities Co., Ltd. and, for Commodities related research reports only, Morgan Stanley Capital Group Japan Co., Ltd; in Hong Kong by Morgan Stanley Asia Limited (which accepts responsibility for its contents) and by Morgan Stanley Bank Asia Limited; in Singapore by Morgan Stanley Asia (Singapore) Pte. (Registration number 199206298Z) and/or Morgan Stanley Asia (Singapore) Securities Pte Ltd (Registration number 200008434H), regulated by the Monetary Authority of Singapore (which accepts legal responsibility for its contents and should be contacted with respect to any matters arising from, or in connection with, Morgan Stanley Research) and by Morgan Stanley Bank Asia Limited, Singapore Branch (Registration number T14FC0118J); in Australia to "wholesale clients" within the meaning of the Australian Corporations Act by Morgan Stanley Australia Limited A.B.N. 67 003 734 576, holder of Australian financial services license No. 233742, which accepts responsibility for its contents; in Australia to "wholesale clients" and "retail clients" within the meaning of the Australian Corporations Act by Morgan Stanley Wealth Management Australia Pty Ltd (A.B.N. 19 009 145 555, holder of Australian financial services license No. 240813, which accepts responsibility for its contents; in Korea by Morgan Stanley & Co International plc, Seoul Branch; in India by Morgan Stanley India Company Private Limited having Corporate Identification No (CIN) U22990MH1998PTC115305, regulated by the Securities and Exchange Board of India ('SEBI') and holder of licenses as a Research Analyst (SEBI Registration No. INH000001105); Stock Broker (SEBI Stock Broker Registration No. INZ000244438), Merchant Banker (SEBI Registration No. INM000011203), and depository participant with National Securities Depository Limited (SEBI Registration No. IN-DP-NSDL-567-2021) having registered office at Altimus, Level 39 & 40, Pandurang Budhkar Marg, Worli, Mumbai 400018, India; Telephone no. +91-22-61181000; Compliance Officer Details: Mr. Tejarshi Hardas, Tel. No.: +91-22-61181000 or Email: tejarshi.hardas@morganstanley.com; Grievance officer details: Mr. Tejarshi Hardas, Tel. No.: +91-22-61181000 or Email: msic-compliance@morganstanley.com. Morgan Stanley India Company Private Limited (MSICPL) may use AI tools in providing research services. All recommendations contained herein are made by the duly qualified research analysts; in Canada by Morgan Stanley Canada Limited; in Germany and the European Economic Area where required by Morgan Stanley Europe S.E., authorised and regulated by Bundesanstalt fuer Finanzdienstleistungsaufsicht (BaFin) under the reference number 149169; in the US by Morgan Stanley & Co. LLC, which accepts responsibility for its contents. Morgan Stanley & Co. International plc, authorized by the Prudential Regulation Authority and regulated by the Financial Conduct Authority and the Prudential Regulation Authority, disseminates in the UK research that it has prepared, and research which has been prepared by any of its affiliates, only to persons who (i) are investment professionals falling within Article 19(5) of the Financial Services and Markets Act 2000 (Financial Promotion) Order 2005 (as amended, the 'Order'); (ii) are persons who are high net worth entities falling within Article 49(2)(a) to (d) of the Order; or (iii) are persons to whom an invitation or inducement to engage in investment activity (within the meaning of section
M
21 of the Financial Services and Markets Act 2000, as amended) may otherwise lawfully be communicated or caused to be communicated. RMB Morgan Stanley Proprietary Limited is a member of the JSE Limited and A2X (Pty) Ltd. RMB Morgan Stanley Proprietary Limited is a joint venture owned equally by Morgan Stanley International Holdings Inc. and RMB Investment Advisory (Proprietary) Limited, which is wholly owned by FirstRand Limited. The information in Morgan Stanley Research is being disseminated by Morgan Stanley Saudi Arabia, regulated by the Capital Market Authority in the Kingdom of Saudi Arabia, and is directed at Sophisticated investors only.
Morgan Stanley Hong Kong Securities Limited is the liquidity provider/market maker for securities of AAC Technologies Holdings, BYD Electronics, FIT Hon Teng Ltd, Hon Hai Precision, Lenovo, Lens Technology, Luxshare Precision Industry Co., Ltd., Sunny Optical, Xiaomi Corp, Yangtze Optical Fibre and Cable JSC Ltd, ZTE Corporation listed on the Stock Exchange of Hong Kong Limited. An updated list can be found on HKEx website: http://www.hkex.com.hk.
The information in Morgan Stanley Research is being communicated by Morgan Stanley & Co. International plc (DIFC Branch), regulated by the Dubai Financial Services Authority (the DFSA) or by Morgan Stanley & Co. International plc (ADGM Branch), regulated by the Financial Services Regulatory Authority Abu Dhabi (the FSRA), and is directed at Professional Clients only, as defined by the DFSA or the FSRA, respectively. The financial products or financial services to which this research relates will only be made available to a customer who we are satisfied meets the regulatory criteria of a Professional Client. A distribution of the different MS Research ratings or recommendations, in percentage terms for Investments in each sector covered, is available upon request from your sales representative.
The information in Morgan Stanley Research is being communicated by Morgan Stanley & Co. International plc (QFC Branch), regulated by the Qatar Financial Centre Regulatory Authority (the QFCRA), and is directed at business customers and market counterparties only and is not intended for Retail Customers as defined by the QFCRA.
As required by the Capital Markets Board of Turkey, investment information, comments and recommendations stated here, are not within the scope of investment advisory activity. Investment advisory service is provided exclusively to persons based on their risk and income preferences by the authorized firms. Comments and recommendations stated here are general in nature. These opinions may not fit to your financial status, risk and return preferences. For this reason, to make an investment decision by relying solely to this information stated here may not bring about outcomes that fit your expectations.
The trademarks and service marks contained in Morgan Stanley Research are the property of their respective owners. Third-party data providers make no warranties or representations relating to the accuracy, completeness, or timeliness of the data they provide and shall not have liability for any damages relating to such data. The Global Industry Classification Standard (GICS) was developed by and is the exclusive property of MSCI and S&P.
Morgan Stanley Research, or any portion thereof may not be reprinted, sold or redistributed without the written consent of Morgan Stanley.
Indicators and trackers referenced in Morgan Stanley Research may not be used as, or treated as, a benchmark under Regulation EU 2016/1011, or any other similar framework.
The issuers and/or fixed income products recommended or discussed in certain fixed income research reports may not be continuously followed. Accordingly, investors should regard those fixed income research reports as providing stand-alone analysis and should not expect continuing analysis or additional reports relating to such issuers and/or individual fixed income products. Morgan Stanley may hold, from time to time, material financial and commercial interests regarding the company subject to the Research report.
Registration granted by SEBI and certification from the National Institute of Securities Markets (NISM) in no way guarantee performance of the intermediary or provide any assurance of returns to investors. Investment in securities market are subject to market risks. Read all the related documents carefully before investing.
INDUSTRY COVERAGE: Greater China Technology Hardware
| Company (Ticker) | Rating (As Of) | Price* (08/12/2026) |
|---|---|---|
| Andy Meng, CFA | ||
| AAC Technologies Holdings (2018.HK) | O (01/29/2024) | HK$42.68 |
| Accelink Technologies Co. Ltd. (002281.SZ) | U (05/12/2022) | Rmb185.03 |
| BYD Electronics (0285.HK) | O (04/28/2023) | HK$23.82 |
| China TransInfo Technology Co Ltd (002373.SZ) | E (07/18/2023) | Rmb7.94 |
| Dahua Technology Co. Ltd. (002236.SZ) | E (12/12/2024) | Rmb16.62 |
| Eoptolink Technology Inc Ltd (300502.SZ) | O (02/27/2026) | Rmb428.20 |
| Genius Electronic Optical Co. Ltd. (3406.TW) | E (04/23/2025) | NT$578.00 |
| GoerTek Inc (002241.SZ) | U (04/23/2025) | Rmb22.56 |
| Gosuncn Technology Group Co Ltd (300098.SZ) | U (11/07/2022) | Rmb4.72 |
| HIKVision Digital Technology (002415.SZ) | E (12/12/2024) | Rmb36.47 |
| Largan Precision (3008.TW) | O (07/10/2026) | NT$4,585.00 |
| LianChuang Electronic Technology Co Ltd (002036.SZ) | U (06/12/2024) | Rmb7.25 |
| Lingyi Itech Guangdong Co (002600.SZ) | U (04/23/2025) | Rmb12.51 |
| Luxshare Precision Industry Co., Ltd. (002475.SZ) | O (10/24/2016) | Rmb57.35 |
| OFILM Group Co Ltd (002456.SZ) | U (06/12/2024) | Rmb7.41 |
| Q Technology (Group) Company Ltd (1478.HK) | U (03/23/2026) | HK$6.85 |
| Quectel Wireless Solutions Co Ltd (603236.SS) | E (10/09/2024) | Rmb54.03 |
| Shanghai Conant Optical Co Ltd (2276.HK) | O (04/10/2026) | HK$37.40 |
| Shenzhen Transsion Holdings Co Ltd (688036.SS) | E (03/23/2026) | Rmb56.29 |
| Sunny Optical (2382.HK) | E (03/23/2026) | HK$58.85 |
| Suzhou TFC Optical Communication Co Ltd. (300394.SZ) | E (11/06/2025) | Rmb240.05 |
| Wingtech Technology Co Ltd (600745.SS) | U (05/18/2026) | Rmb17.15 |
| Xiaomi Corp (1810.HK) | O (04/14/2021) | HK$26.36 |
| Yangtze Optical Fibre and Cable JSC Ltd (601869.SS) | U (10/13/2021) | Rmb345.79 |
| Yangtze Optical Fibre and Cable JSC Ltd (6869.HK) | O (07/15/2026) | HK$131.40 |
| Yongxin Optics Co Ltd (603297.SS) | E (11/15/2022) | Rmb102.87 |
| Zhejiang Crystal-Optech Co Ltd (002273.SZ) | O (11/15/2022) | Rmb27.55 |
| Zhongji Innolight Co Ltd (300308.SZ) | ++ | Rmb921.00 |
| ZTE Corporation (0763.HK) | O (06/04/2026) | HK$25.50 |
| ZTE Corporation (000063.SZ) | E (06/04/2026) | Rmb35.59 |
| Derrick Yang | ||
| Accton Technology Corporation (2345.TW) | O (06/06/2024) | NT$2,215.00 |
| Advantech (2395.TW) | O (01/20/2021) | NT$686.00 |
| AirTAC International (1590.TW) | O (04/16/2025) | NT$1,595.00 |
| Asia Vital Components Co. Ltd. (3017.TW) | O (07/30/2024) | NT$2,910.00 |
| AU Optronics (2409.TW) | E (02/10/2026) | NT$26.25 |
| Auras Technology Co Ltd (3324.TWO) | E (05/04/2023) | NT$1,050.00 |
| Bizlink (3665.TW) | O (03/10/2025) | NT$2,155.00 |
| BOE Technology (000725.SZ) | O (09/06/2019) | Rmb5.93 |
| Chenbro (8210.TW) | O (07/23/2025) | NT$1,005.00 |
| Chroma Ate Inc. (2360.TW) | O (10/05/2021) | NT$2,195.00 |
| Delta Electronics Inc. (2308.TW) | O (07/13/2017) | NT$1,790.00 |
| E Ink Holdings Inc. (8069.TWO) | E (08/10/2026) | NT$166.00 |
| Ennostar Inc (3714.TW) | U (09/23/2022) | NT$58.30 |
| Fositek Corp (6805.TW) | O (06/25/2025) | NT$1,835.00 |
| Hiwin Technologies Corp. (2049.TW) | O (03/30/2026) | NT$369.00 |
| Innolux (3481.TW) | E (04/07/2025) | NT$50.40 |
| King Slide Works Co. Ltd. (2059.TW) | O (11/08/2023) | NT$12,045.00 |
| Lens Technology (300433.SZ) | E (07/22/2020) | Rmb35.25 |
| Lite-On Technology (2301.TW) | E (01/15/2025) | NT$259.50 |
| TCL Corp. (000100.SZ) | E (04/07/2025) | Rmb5.09 |
| Tianma Microelectronics (000050.SZ) | U (01/24/2018) | Rmb6.70 |
| Wuhan Jingce Electronic Group Co Ltd (300567.SZ) | E (11/26/2021) | Rmb225.20 |
| Howard Kao | ||
| Acer Inc. (2353.TW) | U (04/23/2025) | NT$31.75 |
| Asustek Computer Inc. (2357.TW) | U (11/16/2025) | NT$852.00 |
| Catcher Technology (2474.TW) | U (11/17/2025) | NT$205.00 |
| Compal Electronics (2324.TW) | U (04/23/2025) | NT$39.90 |
| FIT Hon Teng Ltd (6088.HK) | O (11/03/2025) | HK$5.22 |
| Foxconn Industrial Internet Co. Ltd. (601138.SS) | O (07/10/2019) | Rmb65.60 |
| Giga-Byte Technology Co. Ltd. (2376.TW) | E (11/16/2025) | NT$375.50 |
| Gold Circuit Electronics Ltd. (2368.TW) | O (10/06/2022) | NT$1,000.00 |
| Hon Hai Precision (2317.TW) | O (03/15/2024) | NT$270.00 |
| Inspur Electronic Information (000977.SZ) | E (08/28/2023) | Rmb75.02 |
| LandMark Optoelectronics Corporation (3081.TWO) | E (03/26/2026) | NT$2,725.00 |
| Lenovo (0992.HK) | O (07/10/2026) | HK$29.04 |
| Lotes Co. Ltd. (3533.TW) | E (05/12/2025) | NT$2,010.00 |
| Nan Ya PCB (8046.TW) | O (02/23/2026) | NT$1,265.00 |
| Pegatron Corporation (4938.TW) | E (03/25/2026) | NT$91.40 |
| Quanta Computer Inc. (2382.TW) | O (05/01/2023) | NT$325.50 |
| Shengyi Technology Co Ltd. (600183.SS) | E (05/26/2022) | Rmb143.23 |
| Shennan Circuits Co Ltd (002916.SZ) | E (08/24/2023) | Rmb385.80 |
| Unimicron (3037.TW) | O (02/23/2026) | NT$1,000.00 |
| Visual Photonics Epitaxy Co Ltd (2455.TW) | E (09/11/2023) | NT$384.50 |
| Wistron Corporation (3231.TW) | O (07/12/2023) | NT$193.50 |
| Wiwynn Corp (6669.TW) | O (11/10/2025) | NT$6,025.00 |
| Yageo Corp. (2327.TW) | O (10/28/2025) | NT$602.00 |
| Zhen Ding (4958.TW) | ++ | NT$471.50 |
M
Stock Ratings are subject to change. Please see latest research for each company.
- Historical prices are not split adjusted.