PDF 原檔:報告_MS_南電8046_20260730_original.pdf
圖片清單(已驗證 2026-07-31)
| 檔名 | size | 分類 | 親眼所見內容 |
|---|---|---|---|
ms 8046_001.png |
66KB | 裝飾·banner | "Asia Summer School 2026" 廣告 banner,泳池主題,非資料圖 |
ms 8046_002.png |
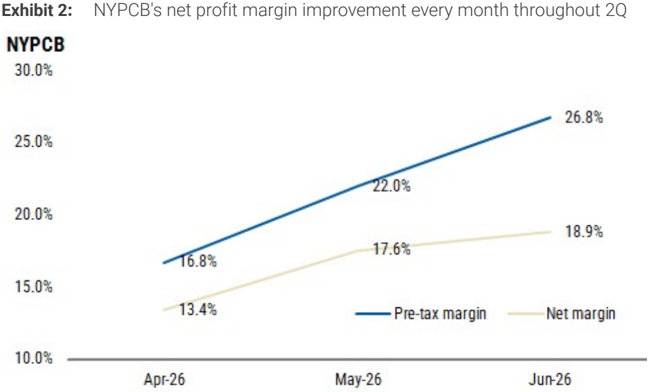
91KB | 真資料圖 | Exhibit 2:南電(NYPCB)2Q26 各月毛利/淨利率改善圖,稅前margin 16.8%→22.0%→26.8%、淨margin 13.4%→17.6%→18.9%(Apr-Jun 26) |
ms 8046_003.png |
63KB | 真資料圖 | 南電(8046.TW)股價與評等/目標價歷史階梯圖,目標價自低點上修至 NT$1,550(與內文現行 TP 一致) |
ms 8046_004.png |
61KB | 真資料圖 | 同業(本報告同時覆蓋之 Unimicron 3037 或 Zhen Ding 4958,圖上無公司名標示、目標價階梯上緣 NT$1,465,非南電本身,具體對應公司待核對) |
ms 8046_005.png |
58KB | 真資料圖 | 同業(同上,圖上無公司名標示、目標價階梯上緣 NT$690,非南電本身,具體對應公司待核對) |
004、005 為本報告同時覆蓋之同業(Unimicron 3037/Zhen Ding 4958)目標價歷史圖,非南電(8046)本身資料,故不嵌入南電公司頁;因涉及之 3037 頁本輪由其他批次處理中,本批不另建/更新該同業頁面。
原始內容
NTS M
Asia Summer School 2026
Jun-26
Prelim
2Q26
MSe
Cons
M July 30, 2026 12:56 PM GMT
Nan Ya PCB | Asia Pacific
Margin improvement monthly in 2Q; total 2Q net profit 4% above MSe
Key Takeaways
- We believe the AI-driven up-cycle remains in early innings, with undersupply seen emerging from CY27 onward.
- NYPCB's BT substrate business should continue to benefit from the memory super-cycle.
- Stay OW - on a 12-month view, we prefer Unimicron over NYPCB and Zhen Ding.
Details of the release: NYPCB reported June 2026 profit per TWSE regulatory requirements:
- June pre-tax margin at 26.8% (+470bps m/m)
- June net profit margin at 18.9% (+130bps m/m)
NYPCB was required to disclose every month in 2Q, so we can see the monthly margin improvements during the quarter ( Exhibit 2 ).
NYPCB is set to report full 2Q numbers on August 6, but we now have unaudited 2Q net profit as they had disclosed preliminary April (report here) and May (report here). 2Q net profit reached ~NT$2,261M, which is 4% above MSe and in line with the Street.
- Unaudited 2Q pre-tax margin is 21.9%, which is 250bps above MSe and 120bps above the Street, implying there could be upside to gross margin estimates.
Exhibit 1 : NYPCB's preliminary May 2026 profit numbers
Source: Company data, Visible Alpha, Morgan Stanley Research estimates.
Update
| Morgan Stanley Taiwan Limited+ Howard Kao Equity Analyst Howard.Kao@morganstanley.com | +886 2 2730-2989 |
|---|---|
| Irene Yen Research Associate Irene.Yen@morganstanley.com | +886 2 2730-2869 |
| Andy Meng, CFA Equity Analyst Andy.Meng@morganstanley.com | +852 2239-7689 |

Nan Ya PCB (8046.TW, 8046 TT)
Greater China Technology Hardware | Taiwan
Stock Rating
Industry View
Price target
Up/downside to price target (%)
Shr price, close (Jul 30, 2026)
52-Week Range
Sh out, dil, curr (mn)
Mkt cap, curr (mn)
EV, curr (mn)
Avg daily trading value (mn)
Overweight
In-Line
NT$1,550.00
85
NT$837.00
NT$1,415.00-166.00
646
NT$540,919
NT$531,829
NT$9,589
| Fiscal Year Ending | 12/25 | 12/26e | 12/27e | 12/28e |
|---|---|---|---|---|
| EPS (NT$)** | 3.01 | 15.64 | 33.02 | 62.87 |
| EPS (NT$)§ | 2.63 | 16.45 | 40.66 | 78.10 |
| Revenue, net (NT$ mn) | 40,173 | 56,808 | 78,966 | 111,555 |
| EBITDA (NT$ mn) | 8,876 | 17,290 | 30,095 | 52,608 |
| ModelWare net inc (NT | 1,947 | 10,108 | 21,337 | 40,621 |
| $ mn) | ||||
| P/E | 80.0 | 53.5 | 25.3 | 13.3 |
| P/BV | 3.4 | 9.9 | 7.8 | 5.6 |
| RNOA (%) | 4.5 | 25.5 | 60.3 | 124.0 |
| ROE (%) | 4.3 | 21.9 | 38.9 | 58.5 |
| EV/EBITDA | 16.5 | 30.1 | 16.7 | 9.1 |
| Div yld (%) | 0.4 | 0.2 | 1.2 | 2.6 |
| FCF yld ratio (%)** | 0.7 | 2.4 | 4.3 | 7.7 |
| Leverage (EOP) (%) | (19.7) | (37.4) | (53.5) | (67.6) |
Morgan Stanley does and seeks to do business with companies covered in Morgan Stanley Research. As a result, investors should be aware that the firm may have a conflict of interest that could affect the objectivity of Morgan Stanley Research. Investors should consider Morgan Stanley Research as only a single factor in making their investment decision.
For analyst certification and other important disclosures, refer to the Disclosure Section, located at the end of this report.
+= Analysts employed by non-U.S. affiliates are not registered with FINRA, may not be associated persons of the member and may not be subject to FINRA restrictions on communications with a subject company, public appearances and trading securities held by a research analyst account.
• alya
NYPCB
30.0%
25.0%
20.0%
15.0%
10.0%
M
26.8%
Source: Company data, Morgan Stanley Research.
M
AlphaSignals Catalyst Event Reaction
| Company / Catalyst | Date | Impact to thesis | Catalyst versus expectation |
|---|---|---|---|
| Nan Ya PCB 8046.TW | |||
| Preliminary June profits announcement | 30 Jul 2026 | Strengthens | Modest upside surprise |
| Takeaways: |
M
Valuation Methodology and Risks
Unimicron (3037.TW)
Base case, residual income (RI) valuation model, which we think derives the most accurate value of the firm given that it takes into account cost of equity. We use a cost of equity of 9.2% [risk-free rate of 1% (10-year Taiwan government note yield), equity risk premium of 8.7%, and a beta of 1.0], a medium-term growth rate of 15%, and a terminal growth rate of 3%.
Risks to Upside
- n Better-than-expected ABF substrate demand from PC and server customers
- n Capex cuts; halt to its capacity expansion plan
- n Continued yield issues of alternative technology that doesn't require substrate (e.g., CoWoP)
Risks to Downside
- n Sudden demand shortfall
- n Technological change that would not require ABF substrates
- n Intensifying competition
- n Yield issues or production hiccups when ramping new capacity
Zhen Ding (4958.TW)
Base case, residual income model. Key assumptions include a cost of equity of 10%, a mediumterm growth rate of 15% and a terminal growth rate of 3%.
Risks to Upside
- n Higher-than-expected F-PCB content increase for iPhones
- n Better-than-expected production yield/share allocation for SLP
- n Share gains on higher margin F-PCB pieces
Risks to Downside
- n Worse-than-expected iPhone sell-through
- n Lower-than-expected F-PCB content increase for iPhones
- n Worse-than-expected production yield/share allocation for SLP
- n Increasing competition from Chinese peers, intensifying pricing pressure
Nan Ya PCB (8046.TW)
Base case, residual income (RI) valuation model, which we think derives the most accurate value of the firm given that it takes into account cost of equity. We use a cost of equity of 9.3% [risk-free rate of 1% (10-year Taiwan government note yield), equity risk premium of 8.7%, and a beta of 1.0], a medium-term growth rate of 17%, and a terminal growth rate of 3%.
Risks to Upside
- n Better-than-expected ABF and BT demand
- n Faster-than-expected pickup in AI and 5G demand
- n Stronger-than-expected ASP hike
M
- n Continued yield issues of alternative technology that doesn't require substrate (e.g. CoWoP)
Risks to Downside
- n Sudden demand shortfall, creating headwinds for ABF substrate demand and pricing
- n Technological change that would not require ABF substrates
- n Intensifying competition
M
Disclosure Section
The information and opinions in Morgan Stanley Research were prepared or are disseminated by Morgan Stanley Asia Limited (which accepts the responsibility for its contents) and/or Morgan Stanley Asia (Singapore) Pte. (Registration number 199206298Z) and/or Morgan Stanley Asia (Singapore) Securities Pte Ltd (Registration number 200008434H), regulated by the Monetary Authority of Singapore (which accepts legal responsibility for its contents and should be contacted with respect to any matters arising from, or in connection with, Morgan Stanley Research), and/or Morgan Stanley Taiwan Limited and/or Morgan Stanley & Co International plc, Seoul Branch, and/or Morgan Stanley Australia Limited (A.B.N. 67 003 734 576, holder of Australian financial services license No. 233742, which accepts responsibility for its contents), and/or Morgan Stanley Wealth Management Australia Pty Ltd (A.B.N. 19 009 145 555, holder of Australian financial services license No. 240813, which accepts responsibility for its contents), and/or Morgan Stanley India Company Private Limited having Corporate Identification No (CIN) U22990MH1998PTC115305, regulated by the Securities and Exchange Board of India ('SEBI') and holder of licenses as a Research Analyst (SEBI Registration No. INH000001105); Stock Broker (SEBI Stock Broker Registration No. INZ000244438), Merchant Banker (SEBI Registration No. INM000011203), and depository participant with National Securities Depository Limited (SEBI Registration No. IN-DP-NSDL-567-2021) having registered office at Altimus, Level 39 & 40, Pandurang Budhkar Marg, Worli, Mumbai 400018, India; Telephone no. +91-22-61181000; Compliance Officer Details: Mr. Tejarshi Hardas, Tel. No.: +91-22-61181000 or Email: tejarshi.hardas@morganstanley.com; Grievance officer details: Mr. Tejarshi Hardas, Tel. No.: +91-22-61181000 or Email: msic-compliance@morganstanley.com which accepts the responsibility for its contents and should be contacted with respect to any matters arising from, or in connection with, Morgan Stanley Research, and their affiliates (collectively, "Morgan Stanley"). Morgan Stanley India Company Private Limited (MSICPL) may use AI tools in providing research services. All recommendations contained herein are made by the duly qualified research analysts.
For important disclosures, stock price charts and equity rating histories regarding companies that are the subject of this report, please see the Morgan Stanley Research Disclosure Website at www.morganstanley.com/eqr/disclosures/webapp/generalresearch, or contact your investment representative or Morgan Stanley Research at 1585 Broadway, (Attention: Research Management), New York, NY, 10036 USA.
For valuation methodology and risks associated with any recommendation, rating or price target referenced in this research report, please contact the Client Support Team as follows: US/Canada +1 800 303-2495; Hong Kong +852 2848-5999; Latin America +1 718 754-5444 (U.S.); London +44 (0)20-7425-8169; Singapore +65 6834-6860; Sydney +61 (0)2-9770-1505; Tokyo +81 (0)3-6836-9000. Alternatively you may contact your investment representative or Morgan Stanley Research at 1585 Broadway, (Attention: Research Management), New York, NY 10036 USA.