PDF 原檔:報告_MS_南亞科2408_20261012_original.pdf
圖片清單(已驗證 2026-10-13)
16 張抽圖皆為真資料圖(MS 圖表密度高,無封面/logo),lib 嵌圖只從此清單挑。
| 檔名 | size | 分類 | 親眼所見內容 |
|---|---|---|---|
報告_MS_南亞科2408_20261012_001.png |
74KB | 真資料圖 | DDR4 8Gb(1Gx8) 2666Mbps Spot vs Contract 價格(US$),Jan-19至Oct-26;現貨 37.50、合約 25.00 |
報告_MS_南亞科2408_20261012_002.png |
96KB | 真資料圖 | DDR5 16G(2Gx8) 4800/5600 Spot vs Contract 價格(US$),Jan-23至Oct-26;現貨 58.00、合約 48.00 |
報告_MS_南亞科2408_20261012_003.png |
94KB | 真資料圖 | DDR4 Contract(YoY%):DDR3 4Gb 與 DDR4 8Gb 對比,Jan-18至Oct-26,近期雙雙逾 500% |
報告_MS_南亞科2408_20261012_004.png |
74KB | 真資料圖 | DDR5 Contract(YoY%),Mar-24至Oct-26,近期約 600-700% |
報告_MS_南亞科2408_20261012_005.png |
125KB | 真資料圖 | Nanya Historical P/B band,Oct-16至Oct-26;Average 1.3x、+1SD 1.7x、-1SD 0.8x,近期約 2.1x 貼近上緣 |
報告_MS_南亞科2408_20261012_006.png |
137KB | 真資料圖 | Nanya Historical forward P/B vs ROAE,Oct-15至Oct-26,近期 P/B 約 2.2x、ROAE 約 75-85% |
報告_MS_南亞科2408_20261012_007.png |
132KB | 真資料圖 | Nanya FY2 EPS Revision(3MMA) vs 股價年增率,Jan-16至2026,近期股價年增逾 1,000% |
報告_MS_南亞科2408_20261012_008.png |
24KB | 真資料圖 | Nanya Risk Reward 圖:現價 NT$527、熊案 NT$330(-37.4%)、基準 NT$600(+13.9%)、牛案 NT$1,270(+141.0%) |
報告_MS_南亞科2408_20261012_009.png |
25KB | 真資料圖 | Nanya Consensus Rating Distribution:93% Overweight、0% Equal-weight、7% Underweight |
報告_MS_南亞科2408_20261012_010.png |
17KB | 真資料圖 | Nanya Global Revenue Exposure 圓餅圖:Mainland China 40-50%、APAC ex Japan/China/India 40-50%、Europe/Japan/North America 各 0-10% |
報告_MS_南亞科2408_20261012_011.png |
34KB | 真資料圖 | Nanya FY Dec 2026e 估值區間圖:Sales NT$405,725mn(區間 195,412-422,497、共識均值 366,494);EBITDA 322,470;Net income 257,292;EPS 75.96(區間 31.62-79.89、共識均值 67.67) |
報告_MS_南亞科2408_20261012_012.png |
17KB | 真資料圖 | CXMT Risk Reward 圖:現價 Rmb48.34、熊案 Rmb40(-17.3%)、基準 Rmb88(+82.0%)、牛案 Rmb132(+173.1%) |
報告_MS_南亞科2408_20261012_013.png |
9KB | 真資料圖 | CXMT Consensus Rating Distribution:91% Overweight、9% Equal-weight、0% Underweight |
報告_MS_南亞科2408_20261012_014.png |
27KB | 真資料圖 | CXMT FY2027e 估值區間圖:EPS Rmb6.1(區間 3.7-6.8、共識均值 4.8);Sales 718,171.6mn;Net income 411,029mn |
報告_MS_南亞科2408_20261012_015.png |
22KB | 真資料圖 | CXMT 5 年股價走勢圖,近期約 Rmb50-60,標示目標價 88 虛線 |
報告_MS_南亞科2408_20261012_016.png |
55KB | 真資料圖 | Nanya 評等/目標價沿革圖,2023/10-2026/10:目標價階梯由約 60 逐步上修至 NT$580,標註歷次評等變動(E/A、U/A、O/A 等) |
原始內容
| Morgan Stanley Taiwan Limited+ | |
|---|---|
| Charlie Chan | |
| Equity Analyst | |
| C arlie.C an@morganstanley.com | +886 2 2730-1725 |
| Morgan Stanley Asia Limited+ | |
| Ethan Jia | |
| Researc Associate | |
| Et an.Jia@morganstanley.com | +852 3963-2287 |
| Morgan Stanley Taiwan Limited+ | |
| Daniel Yen, CFA | |
| Equity Analyst | |
| Daniel.Yen@morganstanley.com | +886 2 2730-2863 |
| Morgan Stanley Asia Limited+ | |
| Daisy Dai, CFA | |
| Equity Analyst Daisy.Dai@morganstanley.com | +852 2848-7310 |
| Henry Zhao | |
| Equity Analyst | |
| Henry.Z ao@morganstanley.com | +852 2239-7731 |
| Morgan Stanley Taiwan Limited+ | |
| Lucas Wang | |
| Equity Analyst | |
| Lucas.Wang@morganstanley.com | +886 2 2730-2875 |
| Greater China Technology Semiconductors | Greater China Technology Semiconductors |
| Asia Pacific | |
| Industry View | Attractive |
| What's Changed | |
| Nanya Technology Corp. | |
| (2408.TW) | From To |
| Price Target | NT$580.00 NT$ 00.00 |
Morgan Stanley does and seeks to do business with companies covered in Morgan Stanley Research. As a result, investors should be aware that the firm may have a conflict of interest that could affect the objectivity of Morgan Stanley Research. Investors should consider Morgan Stanley Research as only a single factor in making their investment decision.
For analyst certification and other important disclosures, refer to the Disclosure Section, located at the end of this report.
= Analysts employed by non-U.S. affiliates are not registered with FINRA, may not be associated persons of the member and may not be subject to FINRA restrictions on communications with a subject company, public appearances and trading securities held by a research analyst account.
M Idea October 12, 2026 03:39 PM GMT
Greater China Semiconductors - DRAM | Asia Pacific
Nanya 3Q beat; CXMT updates
DRAM supply constraints continue. Contract renewals drove Nanya's 3Q beat. CXMT's 5 milestone strengthens its tech roadmap, but yield ramp and customer qualification take time.
Nanya 3Q beat; LTAs in spotlight: Nanya reported 3 revenue of NT$134bn, +62% / , +612% Y/Y, 8% above consensus. 3 gross profit was NT$114bn, +114% / , 12% above consensus, implying a GM of 85.7%. 3 net profit was NT$88bn, +75% / , 9% above consensus, implying a net margin of 65.1%. The 3 / revenue growth was driven mainly by ASP increase, which primarily reflects renewal of the one-year and six-month LTAs, which were previously negotiated when ASPs were lower; most expired in 3 26. Currently LTAs cover 50-70% of output; only 20% of output is covered by three-year contracts; Nanya intends to extend the LTA durations for longer-term supply according to customer demand, and there are discussions on price floors and ceilings for the new contracts.
Nanya management sees continued D AM shortage in 4Q and expects that ASP may continue to improve: The supply constraint is the long lead time for new capacity, and the undersupply is unlikely to be resolved in the near term. Nanya targets capex of NT$69.7bn in 2026 and NT$346bn for the 35.9kwpm capacity of its new Fab 5A from 2026-29. Management estimates that AI infra currently accounts for ~20% of its revenue mix, but that could increase to 40-50% by 2029/30.
CXMT updates: On September 7 during &A, CXMT reiterated expectations for tight DRAM supply in 2H26; its response on Apple expressed openness to global customers without confirming a supply agreement. On September 21, after its G5 mass production announcement, CXMT clarified that G5 sales are not yet at scale, while yield ramp-up and customer qualification would take time. Based on our checks, CXMT's HBM3E yield is already 40%, and DRAM wafer input should ramp to 30kwpm by end-2027.
Constrained D AM supply is the industry consensus: The 4 F26 earnings call for Micron (covered by Joseph Moore) highlighted that persistent supply constraints are expected through CY2027-28. It cited industry-wide clean room constraints owing to lengthy construction; most of the increase in Micron's F27 capex (vs. its previous plan) is allocated to construction, targeting clean room availability in late CY28 and beyond. Micron also expects rising industry HBM wafer requirements to limit bit growth, forecasting industry DRAM bit shipment growth of low-20s (%) in CY27-28. Samsung (covered by Shawn Kim) also expects HBM to absorb nearly 30% of industry DRAM wafer capacity in 2027, vs ~20% currently.
Stock implications:
- Nanya Tech (OW): Price target raised to NT$600; 2026e, 2027e, and 2028e EPS raised 22%, 18%, and 19%, respectively.
- CXMT (OW): Base case value/price target unchanged at Rmb88.
M Idea
AlphaSignals Earnings Reaction
Impact to our thesis Financial results versus consensus irection of next 12-month consensus EPS
Nanya Technology Corp. (2408.TW)
Strengthens our thesis Modest upside Modest revision higher
Source: Company data, Morgan Stanley Research M Idea
Key Charts and Exhibits
Exhibit 1: DDR4 8Gb (1Gx8) pricing c art
Exhibit 2: DDR5 16Gb (2Gx8) pricing c art
Source: DRAMeXc ange, Morgan Stanley Researc . Data as of Sep 2026.
Exhibit 3: DDR4 Contract (YoY%)
Source: DRAMeXc ange, Morgan Stanley Researc . Data as of Sep 2026.
Exhibit 4: DDR5 Contract (YoY%)
Source: DRAMeXc ange, Morgan Stanley Researc . Data as of Sep 2026
Source: DRAMeXc ange, Morgan Stanley Researc . Data as of Sep 2026
Exhibit 5: DRMA/NAND ASP Projection
| 4Q26E-New | 1Q27F | 2Q27F | 3Q27F | 4Q27 | |
|---|---|---|---|---|---|
| PC DRAM | DDR4: up 13-18% DDR5: up 13-18% Blended ASP: up 13-18% | up 3-8% | up 3-8% | up 0-5% | up 0-5% |
| Server DRAM | DDR4: up 10-15% DDR5: up 10-15% Blended ASP: up 10-15% | up 3-8% | up 3-8% | up 0-5% | up 0-5% |
| Mobile DRAM | LPDDR5(x): up 0-5% LPDDR4X: up 0-5% | LPDDR5(x): up 13-18% LPDDR4X: up 5-10% | LPDDR5(x): up 5-10% LPDDR4X: up 0-5% | LPDDR5(x): up 3-8% LPDDR4X: up 0-5% | LPDDR5(x): up 0-5% LPDDR4X: up 0-5% |
| Graphics DRAM | GDDR6: up 5-10% GDDR7: up 8-13% | up 3-8% | up 3-8% | up 0-5% | up 0-5% |
| Consumer DRAM | DDR3: up 3-8% DDR4: up 3-8% | up 3-8% | up 3-8% | up 0-5% | up 0.5% |
| Total DRAM | Conventional DRAM: up 10-15% HBM Blended: up 15-20% | Conventional DRAM: up 5-10% | Conventional DRAM: up 3-8% | Conventional DRAM: up 0-5% | Conventional DRAM: up 0-5% |
| 4Q26E - New | 1Q27F | 2Q27F | 3Q27F | 4Q27 | |
| eMMC UFS | up 5-10% | up 0-5% | mostly flat | mostly flat | down 3-8% |
| Enterprise SSD Client SSD | up 23-28% up 5-10% up 3-8% | up 13-18% up 0-5% mostly flat | up 8-13% mostly flat mostly flat | up 3-8% mostly flat down 5-10% | mostly flat down 3-8% |
| 3D NAND Wafers (TLC & QLC) | down 10-15% | ||||
| Total NAND Flash | up 15-20% | up 13-18% | up 5-10% | up 0-5% | down 0-5% |
Source: DRAMeXc ange, Morgan Stanley Researc . Data as of Sep 2026
M Idea
Nanya Tech: Estimate Revisions and Quarterly Financials
We raise our EPS estimates 22% for 2026, 18% for 2027, and 19% for 2028: We incorporate 3 26 actual results, which were driven by ASP increases. We also expect DDR4 pricing to remain elevated into 1H27, helped by the continued industry-wide DRAM supply constraint.
Exhibit : Nanya Tec : Estimate revisions
| NT$ mn | New'26E | Old '26E | Diff. | New'27E | Old '27E | Diff. | New'28E | Old '28E | Diff. |
|---|---|---|---|---|---|---|---|---|---|
| Net sales | 405,725 | 348,048 | 17% | 728,810 | 638,966 | 14% | 585,384 | 518,763 | 13% |
| Gross profit | 333,069 | 275,802 | 21% | 609,702 | 520,060 | 17% | 426,727 | 360,346 | 18% |
| Operating profit | 310,209 | 255,102 | 22% | 559,124 | 473,137 | 18% | 374,295 | 310,712 | 20% |
| Pretax Income | 316,087 | 260,265 | 21% | 560,644 | 477,413 | 17% | 375,827 | 315,001 | 19% |
| Net income | 257,292 | 209,579 | 23% | 455,960 | 384,461 | 19% | 305,892 | 254,439 | 20% |
| EPS (NT$) | 75.96 | 62.13 | 22% | 132.17 | 112.32 | 18% | 88.67 | 74.33 | 19% |
| Margins | |||||||||
| Gross margin | 82.1% | 79.2% | 83.7% | 81.4% | 72.9% | 69.5% | |||
| Operating margin | 76.5% | 73.3% | 76.7% | 74.0% | 63.9% | 59.9% | |||
| Pretax margin | 77.9% | 74.8% | 76.9% | 74.7% | 64.2% | 60.7% | |||
| Net margin | 63.4% | 60.2% | 62.6% | 60.2% | 52.3% | 49.0% | |||
| NT$ | New '26E | Old '26E | Diff. | New'27E | Old '27E | Diff. | New'28E | Old '28E | Diff. |
| BVPS (NT$) | 146.00 | 121.52 | 20% | 278.16 | 245.60 | 13% | 366.81 | 327.71 | 12% |
Source: Morgan Stanley Researc (E) estimates
Exhibit 7: Nanya Tec : Quarterly financials
| NT$ in million | 1Q26 | 2Q26 | 3Q26P | 4Q26E | 1Q27E | 2Q27E | 3Q27E | 4Q27E | 2024 | 2025 | 2026e | 2027e | 2028e |
|---|---|---|---|---|---|---|---|---|---|---|---|---|---|
| Total Revenues | 49,087 | 82,549 | 133,649 | 140,440 | 171,301 | 191,350 | 190,679 | 175,480 | 34,132 | 66,587 | 405,725 | 728,810 | 585,384 |
| Sequential Change | 63.1% | 68.2% | 61.9% | 5.1% | 22.0% | 11.7% | -0.4% | -8.0% | |||||
| Change vs Year Ago | 582.9% | 684.2% | 611.7% | 366.7% | 249.0% | 131.8% | 42.7% | 24.9% | 14.2% | 95.1% | 509.3% | 79.6% | -19.7% |
| Cost of Sales | (15,771) | (16,930) | (19,167) | (20,788) | (22,805) | (25,384) | (28,086) | (42,833) | (32,292) | (50,841) | (72,656) | (119,107) | (158,657) |
| Percent of Revenues | 32.1% | 20.5% | 14.3% | 14.8% | 13.3% | 13.3% | 14.7% | 24.4% | 94.6% | 76.4% | 1.99% | 16.3% | 27.1% |
| Variable costs | (12,874) | (13,970) | (16,102) | (17,449) | (19,924) | (22,502) | (25,204) | (28,007) | (18,408) | (37,321) | (60,394) | (95,637) | (133,967) |
| as a % of revenue | 26.2% | 16.9% | 12.0% | 12.4% | 11.6% | 11.8% | 13.2% | 16.0% | 53.9% | 56.0% | 14.9% | 13.1% | 22.9% |
| Dep. & Amort. expense | (2,897) | (2,960) | (3,065) | (3,340) | (2,882) | (2,882) | (2,882) | (14,825) | (13,883) | (13,520) | (12,262) | (23,470) | (24,690) |
| as a % of COGS | 18.4% | 17.5% | 16.0% | 16.1% | 12.6% | 11.4% | 10.3% | 34.6% | 43.0% | 26.6% | 16.9% | 19.7% | 15.6% |
| as a % of revenue | 5.9% | 3.6% | 2.3% | 2.4% | 1.7% | 1.5% | 1.5% | 8.4% | 40.7% | 20.3% | 3.0% | 3.2% | 4.2% |
| Gross Margin | 33,316 | 65,619 | 114,482 | 119,652 | 148,496 | 165,966 | 162,593 | 132,647 | 1,840 | 15,745 | 333,069 | 609,702 | 426,727 |
| Percent of Revenues | 67.9% | 79.5% | 85.7% | 85.2% | 86.7% | 86.7% | 85.3% | 75.6% | 5.4% | 23.6% | 82.1% | 83.7% | 72.9% |
| Total Opex | (3,205) | (4,793) | (7,588) | (7,275) | (11,352) | (12,604) | (13,263) | (13,360) | (10,134) | (9,741) | (22,860) | (50,579) | (52,432) |
| Percent of Revenues | 6.5% | 5.8% | 5.7% | 5.2% | 6.6% | 6.6% | 7.0% | 7.6% | 29.7% | 14.6% | 5.6% | 6.9% | 9.0% |
| R&D | (2,109) | (3,230) | (5,145) | (4,334) | (4,500) | (4,950) | (5,445) | (5,990) | (7,685) | (7,041) | (14,818) | (20,885) | (27,846) |
| Percent of Revenues | 4.3% | 3.9% | 3.8% | 3.1% | 2.6% | 2.6% | 2.9% | 3.4% | 22.5% | 10.6% | 3.7% | 2.9% | 4.8% |
| Sales and Marketing | (347) | (503) | (594) | (856) | (1,713) | (1,913) | (1,907) | (1,755) | (665) | (832) | (2,301) | (7,288) | (7,025) |
| Percent of Revenues | 0.7% | 0.6% | 0.4% | 0.6% | 1.0% | 1.0% | 1.0% | 1.0% | 1.9% | 1.2% | 0.6% | 1.0% | 1.2% |
| General and Admin | (748) | (1,060) | (1,849) | (2,084) | (5,139) | (5,740) | (5,911) | (5,615) | (1,784) | (1,868) | (5,742) | (22,406) | (17,562) |
| Percent of Revenues | 1.5% | 1.3% | 1.4% | 1.5% | 3.0% | 3.0% | 3.1% | 3.2% | 5.2% | 2.8% | 1.4% | 3.1% | 3.0% |
| Operating Income | 30,111 | 60,826 | 106,894 | 112,377 | 137,144 | 153,362 | 149,330 | 119,287 | (8,294) | 6,004 | 310,209 | 559,124 | 374,295 |
| Percent of Revenues | 61.3% | 73.7% | 80.0% | 80.0% | 80.1% | 80.1% | 78.3% | 68.0% | -24.3% | 9.0% | 76.5% | 76.7% | 63.9% |
| EBITDA | 33,008 | 63,786 | 109,959 | 115,717 | 140,026 | 156,243 | 152,212 | 134,113 | 5,589 | 19,524 | 322,470 | 582,594 | 398,985 |
| EBITDA margin | 67% | %71 | 82% | 82% | 82% | 82% | 80% | 76% | 16% | 29% 2,639 | 79% | 80% | 68% |
| Non-operating Income(Loss) | 1,607 | 1,503 | 2,438 | 330 | 381 | 381 | 381 | 378 | 3,998 | 5,878 | 1,520 | 1,532 | |
| Profit Before Taxes | 31,718 | 62,329 | 109,332 | 112,707 | 137,525 | 153,743 | 149,711 | 119,665 | (4,297) | 8,643 | 316,087 | 560,644 | 375,827 |
| Percent of Revenues | 64.6% | 75.5% | 81.8% | 80.3% | 80.3% | 80.3% | 78.5% | 68.2% | -12.6% | 13.0% | 7.2 | 76.9% | 64.2% |
| Taxes | (5,660) | (12,138) | (21,705) | (19,292) | (24,540) | (29,939) | (29,721) | (20,483) | 1,474 | (1,269) | (58,795) | (104,684) | (69,934) |
| Tax Rate | 17.8% 26,058 | 19.5% | 19.9% | 17.1% | 17.8% | 19.5% | 19.9% | 17.1% | 34.3% | 14.7% | 18.6% | 18.7% | 18.6% |
| Reported Income (TW GAAP) Percent of Revenues | 50,192 | 87,627 65.6% | 93,415 66.5% | 112,985 | 123,804 | 119,990 62.9% | 99,182 | (23) -8.3% | 7,373 | 257,292 63.4% | 455,960 62.6% | 305,892 52.3% | |
| Change vs Year Ago | -1443% | -1324% | 9005% | 742% | 334% | 147% | 37% | 6% | 11.1% | 77% | -33% | ||
| 53.1% | 60.8% | 66.0% | 64.7% | 56.5% | -59% | -361% | 3389% | ||||||
| Reported EPS (NTS, TW GAAP) | 129% | 81% | 7% | 27.08 | 32.75 | 10% | -% | -17% | -59% | -359% | 317% | 132.17 | 88.67 -33% |
| Sequential Change | 8.08 | 14.66 | 25.40 | 7% | 21% | 35.89 | 34.78 | 28.75 | (0.91) | 2.36 | 75.96 | 74% | |
| Book value per share | 53.3 | 54.6 | 148.7 | 278.2 | 366.8 |
Source: Company data, Morgan Stanley Researc (E) estimates
M Idea
Nanya Tech: Valuation Methodology
We raise our price target (base case scenario value) from NT$580 to NT$600: Our price target reflects a BVPS multiple of 4.11x for 2026 (was 4.77x) versus ROE of 76% for 2026. We lower our target multiple to reflect recent memory segment volatility. Our 2026e BVPS estimates is raised to NT$146.00 from NT$121.52. We expect DDR4 pricing strength and LTAs to drive a re-rating.
We raise our bull and bear case values from NT$1,230 and NT$320 to NT$1,270 and NT $330, respectively, implying 8.70x and 2.26x 2026e BVPS.
Exhibit 8: Nanya Tec - Historical P/B band
Source: Company data, Morgan Stanley Researc estimates
Exhibit 9: Nanya Tec : Historical forward P/B vs. ROE
Source: Company data, Morgan Stanley Researc estimates M Idea Source: Company data, Morgan Stanley Researc estimates M Idea
Exhibit 10: Nanya Tec : Earnings estimate revision breadt
Risk Reward - Nanya Technology Corp. (2408.TW) Risk Reward - Nanya Technology Corp. (2408.TW)
DDR4 supply-demand becoming more favorable; OW
NT$600.00 PRICE TARGET
Base case, P/B. We expect the stock to trade at 4.11x 2026e BVPS, above its average since 2015, justified by 2026e ROE of 76%. We think NTC will benefit from a supply-driven upcycle as major memory players are exiting the DDR4 market. That should help NTC more than offset the competitive impact from CXMT in the near term.
NT$612.67
MS PT
Mean Morgan Stanley Estimates
Consensus Price Target Distribution
NT$150.00
NT$800.00
Source: Refinitiv, Morgan Stanley Research
RISK REWARD CHART
Key: Historical Stock Performance Current Stock Price Price Target
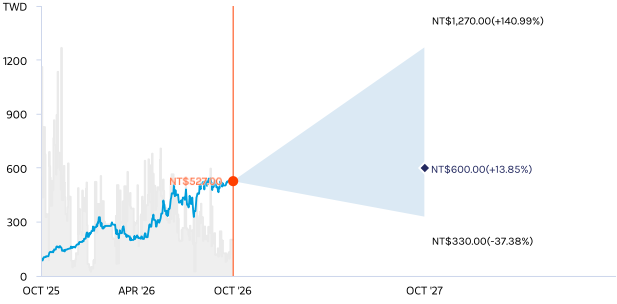
Source: Refinitiv, Morgan Stanley Research
BULL CASE
BASE CASE
OVERWEIGHT THESIS
- ▪Major memory suppliers are gradually exiting the DDR4 market, benefiting existing Taiwanese players, including Nanya Tech.
- ▪We expect DDR4 shortage into 4Q26 to help NTC more than offset the competitive impact from CXMT in the near term. The supply shortage appears set to widen into 1H27.
- ▪Our price target reflects BVPS of 4.11x for 2026e and 2.16x for 2027e, and 1.64x 2028e BVPS. We expect re-rating.
BEAR CASE
8.70x 2026e BVPS
DRAM prices strong; faster-than-expected 1a/1b nm ramp; competition from Korea and China is a non-factor: DRAM pricing remains elevated in into 1H27 thanks to production cuts and relief of inventory pressure. NTC's utilization rate returns to the 100% level. Korean and Chinese mainstream vendors exit the consumer DRAM market.
4.11x 2026e BVPS
Strong DRAM cycle: Major DRAM players now plan to exit the DDR4 market, which positions Taiwanese players to benefit. We expect price -hike momentum to continue through 4Q26, with widened supply shortage into 1H27.
NT$330.00
2.26x 2026e BVPS
Specialty DRAM demand becomes weak in 1H27 with intensifying Chinese competition: Nanya Tech could face more pressure from pricing and technological competition amid a weak cycle. Inventory remains at historical peak levels. SK hynix and Chinese DRAM competitors take all the market share in China. Nanya Tech's utilization rate falls to the 40% level.
NT$1,270.00
NT$600.00
M Idea
Risk Reward - Nanya Technology Corp. (2408.TW)
KEY EARNINGS INPUTS
| Drivers | Dec 2025 | Dec 2026eDec | 2027eDec | 2028e |
|---|---|---|---|---|
| 12" Wafers Out per quarter (000s) | 825.0 | 820.0 | 932.5 | 1,112.5 |
| Average Wafer Yield (%) | 81.8 | 102.8 | 106.2 | 95.0 |
| Total Die shipments - 2 gb equivalent (mn) | 2,368.0 | 2,975.7 | 3,604.0 | 3,985.1 |
INVESTMENT DRIVERS
- Specialty DRAM pricing
- Monthly sales momentum
- Industry outlook reported by industry peers
GLOBAL REVENUE EXPOSURE
Source: Morgan Stanley Research Estimate View explanation of regional hierarchies here
MS ALPHA MODELS
1/5
MOST
3 Month
Horizon
Source: Refinitiv, FactSet, Morgan Stanley Research; 1 is the highest favored Quintile and 5 is the least favored Quintile
RISKS TO PT/RATING
RISKS TO UPSIDE
- Sustained DRAM prices from more disciplined supply and stronger demand
- Stronger pricing environment, enabling revenue guidance to be beaten
- Faster-than-expected 1a/1b nm ramp-up progress
RISKS TO DOWNSIDE
- Slower-than-expected 1a/1b nm ramp-up
- Less demand for specialty DRAM from 4K2K TVs and smart set-top boxes
OWNERSHIP POSITIONING
Inst. Owners, % Active
73.3%
Source: Refinitiv, Morgan Stanley Research
MS ESTIMATES VS. CONSENSUS
Source: Refinitiv, Morgan Stanley Research M Idea
Nanya Tech: Financial Summary
Income Statement
Cash Flow Statement
| NT$mn (Years End Dec ) | 2025 | 2026E | 2027E | 2028E |
|---|---|---|---|---|
| Net sales | 66,587 | 405,725 | 728,810 | 585,384 |
| COGS | (50,841) | (72,656) | (119,107) | (158,657) |
| Depreciation Expense | (13,520) | (12,262) | (23,470) | (24,690) |
| Variable Cost | (37,321) | (60,394) | (95,637) | (133,967) |
| Gross profit | 15,745 | 333,069 | 609,702 | 426,727 |
| Operating expenses | (9,741) | (22,860) | (50,579) | (52,432) |
| Operating income | 6,004 | 310,209 | 559,124 | 374,295 |
| Non-operating income | 2,639 | 5,878 | 1,520 | 1,532 |
| Pre-taxincome | 8,643 | 316,087 | 560,644 | 375,827 |
| Income tax | (1,269) | (58,795) | (104,684) | (69,934) |
| Reported net Income | 7,373 | 257,292 | 455,960 | 305,892 |
| Adj.wtd.avg.shrs( m) | 3,123 | 3,387 | 3,450 | 3,450 |
| Reported EPS (NT$) | 2.36 | 75.96 | 132.17 | 88.67 |
| EPS for consensus (NT$) | 2.36 | 75.96 | 132.17 | 88.67 |
Balance Sheet
| NT$mn (Years End Dec ) | 2025 | 2026E | 2027E | 2028E |
|---|---|---|---|---|
| Cash | 58,074 | 468,374 | 880,681 | 1,189,638 |
| Mkt Securities | 0 | 0 | 0 | 0 |
| ARINR | 16,558 | 71,688 | 89,574 | 64,618 |
| Inventory | 27,288 | 26,437 | 54,472 | 56,422 |
| Other | 6,621 | 20,033 | 24,134 | 18,411 |
| Current Assets | 108,541 | 586,532 | 1,048,861 | 1,329,089 |
| Long-term investments | 5,904 | 8,476 | 9,415 | 10,354 |
| Fixed assets | 85,031 | 128,544 | 135,074 | 140,384 |
| Other assets | 8,977 | 5,426 | 5,426 | 5,426 |
| Total Assets | 208,453 | 728,978 | 1,198,776 | 1,485,253 |
| S/T borrowings | 5,060 | 160,000 | 165,000 | 145,000 |
| APINP | 6,481 | 8,308 | 17,117 | 17,730 |
| Other ST liabilities | 7,480 | 33,045 | 33,074 | 33,076 |
| LT debt | 14,196 | 18,397 | 18,397 | 18,397 |
| Other LT liabilities | 4,698 | 5,488 | 5,488 | 5,488 |
| Total Liabilities | 37,914 | 225,237 | 239,076 | 219,690 |
| Common stocks | 30,986 | 34,502 | 34,502 | 34,502 |
| Preferred stocks | 0 | 0 | 0 | 0 |
| Capital Researve | 33,081 | 108,459 | 108,459 | 108,459 |
| Retained earning | 106,333 | 360,642 | 816,601 | 1,122,464 |
| Other shareholders' equity | 0 | 0 | 0 | 0 |
| Total Equity | 170,538 | 503,741 | 959,700 | 1,265,562 |
| Total Liab. & Shrhldr's Equity | 208,453 | 728,978 | 1,198,776 | 1,485,253 |
| BVPS | 54.61 | 148.72 | 278.18 | 366.84 |
Source: Company data, TEJ, Morgan Stanley ResearchE= Morgan Stanley Research Estimates
| NT$mn (Years | 2025 | 2026E | 2027E | 2028E |
|---|---|---|---|---|
| Cashflow fror | 18,568 | 223,324 | 437,308 | 358,986 |
| Net profits | 7,373 | 257,292 | 455,960 | 305,892 |
| Depreciation | 14,034 | 12,262 | 23,470 | 24,690 |
| Working Capital | 5,697 | (52,453) | (37,111) | 23,618 |
| Other adjustmei | (8,536) | 6,223 | (5,011) | 4,785 |
| Cashflow fror | (14,110) | (52,201) | (30,000) | (30,000) |
| Capex | (13,441) | (51,996) | (30,000) | (30,000) |
| Change of LT In | (612) | 0 | 0 | 0 |
| Change of ST Ir | 0 | 0 | 0 | 0 |
| Other adjustmei | (57) | (206) | 0 | 0 |
| Cashflow fror | (6,317) | 237,868 | 4,999 | (20,030) |
| Increase in L/T | (6,750) | 4,201 | 0 | 0 |
| Increase in S/T. | (9,477) | 154,941 | 5,000 | (20,000) |
| Cash DividendF | 0 | 0 | (1) | (30) |
| Dir& Emp Bonus | (7,000) | 0 | 0 | 0 |
| Proceed fmNew | 0 | 78,718 | 0 | 0 |
| Other adjustmei | 16,909 | 9 | 0 | 0 |
| Exchange rate | (1,970) | 1,309 | 0 | (0) |
| Net change il | -3,829 | 410,300 | 412,307 | 308,956 |
Financial Ratios
| 2025 | 2026E | 2027E | 2028E | |
|---|---|---|---|---|
| Growth(%) | ||||
| Turnover | 95.1 | 509.3 | 79.6 | -19.7 |
| Margins (%) | ||||
| Gross Margin | 23.6 | 82.1 | 83.7 | 72.9 |
| Operating Marg | 9.0 | 76.5 | 76.7 | 63.9 |
| EBITA Margin | -11.3 | 73.4 | 73.5 | 59.7 |
| Pretax Margin | 13.0 | 77.9 | 76.9 | 64.2 |
| Net Profit | 11.1 | 63.4 | 62.6 | 52.3 |
| Return (%) | ||||
| ROAE | 4.4 | 76.3 | 62.3 | 27.5 |
| ROAA | 3.6 | 54.9 | 47.3 | 22.8 |
| Gearing (%) | ||||
| Net Debt/Equity | (22.7) | (57.6) | (72.7) | (81.1) |
| Liabilities/Equity | 22.2 | 44.7 | 24.9 | 17.4 |
| Ratios (X) | ||||
| Current ratio | 5.7 | 2.9 | 4.9 | 6.8 |
| Quick ratio | 3.9 | 2.7 | 4.5 | 6.4 |
| Others | ||||
| AR/NR Turnove | 50 | 57 | 40 | 40 |
| Inventory Turno | 337 | 172 | 24 | 20 |
| AP Turnover (da | 59 | 47 | 42 | 52 |
| Cash Conversio | 328 | 182 | 22 | 8 |
M Idea
CXMT: Estimate Revisions and Quarterly Financials
We raise our EPS estimates 28% for 2026 and 29% for 2027; we keep our 2028 estimate virtually unchanged: This incorporates 2 26 actual results and the stronger outlook for mainstream DRAM driven by continued supply constraint. We also factor in CXMT's G5 breakthrough, which reduces risks around its technology roadmap.
Exhibit 11: CXMT: Estimate revisions
| Rmb mn | Current 2026E | Previous 2026E | Diff. | Current 2027E | Previous 2027E | Diff. | Current 2028E | Previous 2028E | Diff. |
|---|---|---|---|---|---|---|---|---|---|
| Net sales | 438,929 | 388,869 | 13% | 718,172 | 643,077 | 12% | 870,554 | 850,096 | 2% |
| COGS | 56,776 | 92,599 | 84,300 | 144,853 | 204,734 | 185,478 | |||
| Gross profit | 382,153 | 296,271 | 29% | 633,871 | 498,224 | 27% | 665,820 | 664,618 | %0 |
| Operating expenses | 24,152 | 22,789 | 42,372 | 37,942 | 55,803 | 54,491 | |||
| Operating profit | 358,001 | 273,482 | 31% | 591,499 | 460,282 | 29% | 610,017 | 610,127 | %0 |
| Non-op. income (exp.) | (3,577) | (1,078) | (941) | (1,600) | (941) | (1,600) | |||
| PretaxIncome | 354,424 | 272,404 | 30% | 590,558 | 458,682 | 29% | 609,077 | 608,527 | 0% |
| Taxes | (26,680) | (19,485) | (42,520) | (33,025) | (43,854) | (43,814) | |||
| Net income | 242,751 | 189,693 | 28% | 411,029 | 319,243 | 29% | 423,917 | 423,535 | %0 |
| Reported EPS (Rmb) | 3.84 | 3.00 | 28% | 6.15 | 4.77 | 29% | 6.34 | 6.33 | 0% |
| Margins | |||||||||
| Gross margin | 87.1% | 76.2% | 10.9 ppt | 83% | 77.5% | 10.8 ppt | 76.5% | 78.2% | -1.7 ppt |
| Operating margin | 81.6% | 70.3% | 11.2 ppt | 82.4% | 71.6% | 10.8 ppt | 70.1% | 71.8% | -1.7 ppt |
| Pretax margin | 80.7% | 70.1% | 10.7 ppt | 82.2% | 71.3% | 10.9 ppt | 70.0% | 71.6% | -1.6 ppt |
| Net margin | 55.3% | 48.8% | 6.5 ppt | 57.2% | 49.6% | 7.6 ppt | 48.7% | 49.8% | -1.1 ppt |
| BVPS (Rmb) | 8.53 | 7.35 | 16% | 16.26 | 13.31 | 22% | 24.71 | 21.76 | 14% |
Source: Morgan Stanley Researc (E) estimates
Exhibit 12: CXMT: Quarterly financials
| Rmb mn | 1Q26 | 2Q26 | 3Q26E | 4Q26E | 1Q27E | 2Q27E | 3Q27E | 4Q27E | 1Q28E | 2Q28E | 3Q28E | 4Q28E | 2026E | 2027E | 2028E |
|---|---|---|---|---|---|---|---|---|---|---|---|---|---|---|---|
| Total Revenues | 50,800 | 99,510 | 126,347 | 162,271 | 153,054 | 172,641 | 188,204 | 204,273 | 210,668 | 220,600 | 219,190 | 220,096 | 438,929 | 718,172 | 870,554 |
| Sequential Change | 71.0% | 95.9% | 27.0% | 28.4% | -5.7% | 12.8% | 9.0% | 8.5% | 3.1% | 4.7% | -0.6% | 0.4% | |||
| Change vs Year Ago | 719.1% | 977.4% | 659.0% | 446.1% | 201.3% | 73.5% | 49.0% | 25.9% | 37.6% | 27.8% | 16.5% | 7.7% | 610.2% | 63.6% | 21.2% |
| Cost of Sales | 10,588 | 12,346 | 16,022 | 17,819 | 19,751 | 20,730 | 21,508 | 22,312 | 37,664 | 47,581 | 56,137 | 63,352 | 56,776 | 84,300 | 204,734 |
| Percent of Revenues | 21% | 12% | 13% | 11% | 13% | 12% | 11% | 11% | 18% | 22% | 26% | 29% | 13% | 12% | 24% |
| Gross Profit | 40,212 | 87,163 | 110,325 | 144,453 | 133,303 | 151,911 | 166,696 | 181,961 | 173,003 | 173,019 | 163,053 | 156,744 | 382,153 | 633,871 | 665,820 |
| Percent of Revenues | 79.2% | 87.6% | 87.3% | 89.0% | 87.1% | 88.0% | 88.6% | 89.1% | 82.1% | 78.4% | 74.4% | 71.2% | 87.1% | 88.3% | 76.5% |
| Incremental Margin | 0% | %96 | 86% | 9%5% | NM | %G6 | %56 | %56 | -140% | 0% | NM | %969- | %5% | %06 | 21% |
| Total Opex | 2,715 | 4,408 | 7,454 | 9,574 | 9,030 | 10,186 | 11,104 | 12,052 | 13,504 | 14,140 | 14,050 | 14,108 | 24,152 | 42,372 | 55,803 |
| Percent of Revenues | 5.3% | 4.4% | 5.9% | 5.9% | 5.9% | 5.9% | 5.9% | 5.9% | 6.4% | 6.4% | 6.4% | 6.4% | 5.5% | 5.9% | 6.4% |
| R&D | 2,154 | 3,383 | 4,422 | 5,679 | 5,357 | 6,042 | 6,587 | 7,150 | 8,005 | 8,383 | 8,329 | 8,364 | 15,639 | 25,136 | 33,081 |
| Percent of Revenues | 4.2% | 3.4% | 3.5% | 3.5% | 3.5% | 3.5% | 3.5% | 3.5% | 3.8% | 3.8% | 3.8% | 3.8% | 3.6% | 3.5% | 3.8% |
| General & administrative | 483 | 880 | 2,906 | 3,732 | 3,520 | 3,971 | 4,329 | 4,698 | 5,267 | 5,515 | 5,480 | 5,502 | 8,001 | 16,518 | 21,764 |
| Percent of Revenues | 1.0% | 0.9% | 2.3% | 2.3% | 2.3% | 2.3% | 2.3% | 2.3% | 2.5% | 2.5% | 2.5% | 2.5% | 1.8% | 2.3% | 2.5% |
| Selling & marketing | 78 | 145 | 126 | 162 | 153 | 173 | 188 | 204 | 232 | 243 | 241 | 242 | 512 | 718 | 958 |
| Percent of Revenues | 0.2% | 0.1% | 0.1% | 0.1% | 0.1% | 0.1% | 0.1% | 0.1% | 0.1% | 0.1% | 0.1% | 0.1% | 0.1% | 0.1% | 0.1% |
| Operating Income | 37,497 | 82,755 | 102,870 | 134,879 | 124,273 | 141,725 | 155,592 | 169,909 | 159,500 | 158,879 | 149,003 | 142,636 | 358,001 | 591,499 | 610,017 |
| Percent of Revenues | 73.8% | 83.2% | 81.4% | 83.1% | 81.2% | 82.1% | 82.7% | 83.2% | 75.7% | 72.0% | 68.0% | 64.8% | 81.6% | 82.4% | 70.1% |
| Change vs Year Ago | 0.0% | 0.0% | 0.0% | 885.3% | 231.4% | 71.3% | 51.3% | 26.0% | 28.3% | 12.1% | -4.2% | -16.1% | 3981% | 65% | 3% |
| Total Non-operating Income(Loss) | (2,063) | (1,044) | (235) | (235) | (235) | (235) | (235) | (235) | (235) | (235) | (235) | (235) | (3,577) | (941) | (941) |
| Profit Before Taxes | 35,434 | 81,711 | 102,635 | 134,643 | 124,038 | 141,490 | 155,356 | 169,674 | 159,264 | 158,644 | 148,768 | 142,401 | 354,424 | 590,558 | 609,077 |
| Percent of Revenues | 70% | 82% | 81% | 83% | 81% | 82% | 83% | 83% | 76% | 72% | 68% | 65% | 81% | 82% | 70% |
| Taxes | (2,423) | (7,173) | (7,390) | (9,694) | (8,931) | (10,187) | (11,186) | (12,217) | (11,467) | (11,422) | (10,711) | (10,253) | (26,680) | (42,520) | (43,854) |
| Tax Rate | 6.8% | 8.8% | 7.2% | 72% | 72% | 7.2% | 7.2% | 7.2% | 7.2% | 7.2% | 7.2% | 7.2% | 7.5% | 7.2% | 7.2% |
| Net Income, Cont Ops | 33,012 | 74,538 | 95,245 | 124,949 | 115,107 | 131,303 | 144,171 | 157,458 | 147,797 | 147,221 | 138,057 | 132,148 | 327,744 | 548,038 | 565,223 |
| Percent of Revenues | 65% | 75% | 75% | %L% | 75% | 76% | %LL | 77% | 70% | 67% | 63% | 60% | 75% | 76% | 65% |
| Reported Income (Rmb) | 24,762 | 52,843 | 71,434 | 93,712 | 86,330 | 98,477 | 108,128 | 118,093 | 110,848 | 110,416 | 103,542 | 99,111 | 242,751 | 411,029 | 423,917 |
| Percent of Revenues | 49% | 53% | 57% | 58% | 56% | 57% | 57% | 58% | 53% | 50% | 47% | 45% | 55% | 57% | 49% |
| Change vs Year Ago | 0% | 0% | 0% | 0% | 0% | 0% | 0% | %0 | 0% | 0% | %0 | 0% | 12848% | 69% | % |
| Reported EPS (Rmb, cent) | 0.41 | 88.0 | 1.09 | 1.40 | 1.29 | 1.47 | 1.62 | 1.77 | 1.66 | 1.65 | 1.55 | 1.48 | 3.84 | 6.15 | 6.34 |
| Change vs Year Ago | %0 | %0 | %0 | 1079% | 214% | 68% | 48% | 26% | 28% | 12% | -4% | -16% | 11715% | 60% | 3% |
Source: Company data, Morgan Stanley Researc (E) estimates M Idea
CXMT: Valuation Methodology
We keep our base case value/price target unchanged: We continue to apply RI methodology to derive our price target. The price target did not change despite our 2026/27 earnings estimate increases because the contribution to calculated value from our RI model comes mostly from the subsequent forecast period and the continuing value. Key RI assumptions remain unchanged, including cost of equity of 9.9%, , intermediate growth rate of 11.0%, terminal growth rate of 3.0%, and cash dividend payout ratio of 51%, .
Our base case value/price target now implies 14.3x 2027e EPS vs. our prior target multiple of 18.4x 2027e BVPS, as we see a stronger DRAM market outlook given the continued supply constraint; we also believe the G5 breakthrough reduces risks around CXMT's technology roadmap.
Our bull case value remains unchanged at Rmb132; it now implies 21.5x our 2027e EPS.
We adjust our bear case value to Rmb40 from Rmb70 to account for recent volatility; it now implies 6.5x 2027e EPS.
Exhibit 13: CXMT: RI model
| Rmb mn | 2026E | 2027E | 2028E | 2029E | 2030E | 2031E | 2032E | 2033E | 2034E | 2035E | 2036E | 2037E |
|---|---|---|---|---|---|---|---|---|---|---|---|---|
| Total Equity | 357,143 | 768,172 | 1,192,089 | 1,422,658 | 1,678,589 | 1,962,673 | 2,278,006 | 2,628,025 | 3,016,547 | 3,447,806 | 3,926,503 | 4,457,857 |
| Net Profit | 242,751 | 411,029 | 423,917 | 470,548 | 522,309 | 579,763 | 643,536 | 714,325 | 792,901 | 880,120 | 976,934 | 1,084,396 |
| ROAE | 117.3% | 73.1% | 43.3% | 36.0% | 33.7% | 31.8% | 30.4% | 29.1% | 28.1% | 27.2% | 26.5% | 25.9% |
| Residual Income | 60,942 237,121 | 225,469 | 256,040 | 310,800 | 338,077 | 368,015 | 400,987 | 437,384 | 477,625 | 522,163 | 571,494 | 626,164 |
| Spread | 107.4% | 63.1% | 33.3% | 26.1% | 23.8% | 21.9% | 20.4% | 19.2% | 18.2% | 17.3% | 16.6% | 15.9% |
| Ending Equity Capital | 357,143 | |||||||||||
| PV of Forecast Period | 2,233,870 | |||||||||||
| PV of Continuing Value | 3,292,876 | |||||||||||
| Equity Value | 5,883,890 | |||||||||||
| No. of Shares | 66,881 | |||||||||||
| Projected Price | 88 |
Source: Morgan Stanley Researc (E) estimates M Idea
Risk Reward - CXMT Corp (688825.SS) Risk Reward - CXMT Corp (688825.SS)
Chinese DRAM Going Mainstream; OW
Rmb88.00 PRICE TARGET
Base case, residual income model. Key assumptions:
- 9.9% CoE (1.2 beta, 2.0% risk-free rate, and 6.6% risk premium)
- 51% payout ratio
- 11.0% medium-term growth rate
- 3% terminal growth rate
We believe these assumptions are justified, given CXMT's fast growth, capacity expansion, localization tailwinds and AI-memory exposure. Target implies 14.3x 2027e P/E vs global peers' 4.4x 2027e P/E; the premium reflects CXMT's stronger growth profile.
Rmb81.76
MS PT
Mean
Consensus Price Target Distribution
Source: Refinitiv, Morgan Stanley Research
RISK REWARD CHART
Key: Historical Stock Performance Current Stock Price Price Target
Source: Refinitiv, Morgan Stanley Research
BULL CASE
BASE CASE
OVERWEIGHT THESIS
- ▪CXMT is now the world' s #4 DRAM maker and a key beneficiary of China ' s memory localization push.
- ▪We forecast that DRAM capacity will rise from 180k wpm in 2025 to 500k by 2028, with G4b, DDR5, LPDDR5/5X, server DRAM and HBM3e/HBM4 improving mix.
- ▪We expect 2025-28E revenue CAGR of
- 140%+, 2026-28E GM >76%, and OPM of ~70-80%, supported by pricing, scale and higher-value products.
- ▪Our Rmb88 price target is based on a residual income model and implies 14.3x 2027E P/E. We see the premium to global memory peers as justified by CXMT' s faster growth, capacity expansion, localization tailwinds, and AI-memory exposure.
- ▪Risks: DRAM pricing, capex/depreciation, export controls and migration execution.
Consensus Rating Distribution
Source: Refinitiv, Morgan Stanley Research
Risk Reward Themes
Pricing Power:
Secular Growth:
Positive Positive
View descriptions of Risk Rewards Themes here
BEAR CASE
21.5x 2027e P/E
We assume stronger sales/earnings growth, with faster global market share expansion:
- (1) 200% revenue CAGR, 2025-28e, as we assume a stronger-than-expected DRAM commodity cycle, supported by AI inference demand moving into 2027 and beyond;
- (2) Faster-than-expected HBM and G5 rampup;
- (3) Gross margin improves to over 90%, driven by economies of scale and CXMT's technology competitiveness;
(4) >800% earnings CAGR, 2025-28e.
14.3x 2027e P/E
We forecast strong revenue/earnings growth, with global market share expansion.
- (1) 140%+ revenue CAGR, 2025-28e, as we assume DRAM pricing remains strong, supported by AI demand;
- (2) Moderate pace of HBM and G5 ramp-up;
- (3) 2026-28e gross margin of over 76%, driven by economies of scale and CXMT's technology competitiveness;
- (4) ~480% earnings CAGR, 2025-28e
Rmb40.00
6.5x 2027e P/E
We assume revenue/earnings growth is slower, with slower global market share expansion.
(1) 80% revenue CAGR, 2025-28e, as we assume a period of AI computing digestion in 2028, leading to more aggressive margin erosion for HBM owing to competitors' aggressive capacity expansion and pricing competition, as well as faster DRAM pricing drops with muted demand recovery;
- (2) Slower than expected G5 ramp;
- (2) Customer bargaining power pushes gross margin below 40%;
- (3) 200% earnings CAGR, 2025-28e
Rmb132.00
Rmb48.70
Rmb129.00
Morgan Stanley Estimates
Rmb88.00
M Idea
Risk Reward - CXMT Corp (688825.SS)
KEY EARNINGS INPUTS
| Drivers | Dec 2025 | Dec 2026e | Dec 2027e | Dec 2028e |
|---|---|---|---|---|
| Revenue (Rmb, mn) | 180 | 300 | 400 | 500 |
| Gross profit (Rmb, mn) | 25,334 | 382,153 | 633,871 | 665,820 |
| EPS (Rmb, mn) | 0 | 4 | 6 | 6 |
INVESTMENT DRIVERS
- Commodity DRAM pricing
- HBM capacity expansion and tech migration
- Demand from major customers
GLOBAL REVENUE EXPOSURE
Source: Morgan Stanley Research Estimate View explanation of regional hierarchies here
RISKS TO PT/RATING
RISKS TO UPSIDE
- resilient DRAM pricing, supported by AI demand
- faster-than-expected tech migration
- export control relief
- stronger demand from major customers
RISKS TO DOWNSIDE
- earlier-than-expected global DRAM price declines
- CXMT delays in new products, HBM or 3D DRAM development
- tighter restrictions on China's fabs for semi equipment, materials, or servicing
- weaker demand from major China customers
MS ESTIMATES VS. CONSENSUS
Source: Refinitiv, Morgan Stanley Research M Idea
CXMT: Financial Summary
Exhibit 14: Financial summary
Income Statement
| Rmb mn (Years End Dec) | 2025 | 2026E | 2027E | 2028E |
|---|---|---|---|---|
| Net sales | 61,799 | 438,929 | 718,172 | 870,554 |
| COGS | (36,465) | (56,776) | (84,300) | (204,734) |
| Gross profit | 25,334 | 382,153 | 633,871 | 665,820 |
| Operating expenses | (16,561) | (24,152) | (42,372) | (55,803) |
| Operating income | 8,773 | 358,001 | 591,499 | 610,017 |
| Non-operating income | (1,071) | (3,577) | (941) | (941) |
| Pre-tax income | 7,701 | 354,424 | 590,558 | 609,077 |
| Income tax | (557) | (26,680) | (42,520) | (43,854) |
| Minority interests | 5,269 | 84,993 | 137,010 | 141,306 |
| Reported net Income | 1,875 | 242,751 | 411,029 | 423,917 |
| Adj.wtd.avg.shrs(m) | 59,018 | 63,216 | 66,881 | 66,881 |
| MW EPS (Rmb) | 0.03 | 3.84 | 6.15 | 6.34 |
| Reported EPS (Rmb) | 0.03 | 3.84 | 6.15 | 6.34 |
| EPS for consensus (Rmb) | 0.03 | 3.84 | 6.15 | 6.34 |
Balance Sheet
| Rmb mn (Years End Dec) | 2025 | 2026E | 2027E | 2028E |
|---|---|---|---|---|
| Cash | 37,798 | 364,853 | 874,560 | 1,373,537 |
| Mkt Securities | 0 | 0 | 0 | 0 |
| AR/NR | 1,524 | 11,966 | 19,579 | 23,734 |
| Inventory | 28,568 | 36,680 | 54,462 | 132,269 |
| Other | 43,096 | 43,096 | 43,096 | 43,096 |
| Current Assets | 110,986 | 456,596 | 991,698 | 1,572,636 |
| Long-term investments | 4,384 | 4,384 | 4,384 | 4,384 |
| Fixed assets | 183,024 | 225,774 | 244,382 | 253,419 |
| Deferred assets | 1,006 | 1,006 | 1,006 | 1,006 |
| Other assets | 37,385 | 37,385 | 37,385 | 37,385 |
| Total Assets | 336,785 | 725,145 | 1,278,855 | 1,868,830 |
| S/T borrowings | 9,676 | 9,686 | 9,696 | 9,706 |
| AP/NP | 8,702 | 11,659 | 17,311 | 42,043 |
| Other ST liabilities | 34,465 | 34,465 | 34,465 | 34,465 |
| LT debt | 118,825 | 118,835 | 118,845 | 118,855 |
| Other LT liabilities | 11,017 | 11,017 | 11,017 | 11,017 |
| Total Liabilities | 182,685 | 185,662 | 191,335 | 216,086 |
| Common shares | 60,193 | 66,881 | 66,881 | 66,881 |
| Additional capital | 33,104 | 84,054 | 84,054 | 84,054 |
| Retained earming | (36,650) | 206,101 | 617,129 | 1,041,047 |
| Other shareholders' equity | 97,454 | 182,447 | 319,456 | 460,762 |
| Total Equity | 154,100 | 539,482 | 1,087,521 | 1,652,744 |
| Total Liab. & Shrhldr's Equity | 336,785 | 725,145 | 1,278,855 | 1,868,830 |
E = Morgan Stanley Research Estimates
Source: Morgan Stanley Research, Company Data
Source: Company data, Morgan Stanley Researc (E) estimates
| Cash Flow Statement Rmb mn (Years End Dec) | 2025 | 2026E | 2027E | 2028E |
|---|---|---|---|---|
| Cashflow from Operations | 36,520 | 350,967 | 576,687 | 565,957 |
| Net profits | 7,144 | 327,744 | 548,038 | 565,223 |
| Depreciation | 24,680 | 38,820 | 48,392 | 57,963 |
| Working Capital Change | (48,395) | (15,598) | (19,743) | (57,229) |
| Other adjustments | 53,090 | 0 | 0 | 0 |
| Cashflow from Investing | (86,823) | (81,570) | (67,000) | (67,000) |
| Capex | (49,739) | (81,570) | (67,000) | (67,000) |
| Change of LT Investment | 2,434 | 0 | 0 | 0 |
| Change of ST Investment | 194 | 0 | 0 | 0 |
| Other adjustments | (39,712) | 0 | 0 | 0 |
| Cashflow from financing | 46,121 | 57,658 | 20 | 20 |
| Increase in L/T debt | 22,832 | 10 | 10 | 10 |
| Increase in S/T debt | 7,879 | 10 | 10 | 10 |
| Cash Dividend Paid | 0 | 0 | 0 | 0 |
| Dir& Emp Bonus Paid | 0 | 0 | 0 | 0 |
| Issuance of stock | 2,422 | 57,638 | 0 | 0 |
| Other adjustments | 12,988 | 0 | 0 | 0 |
| Exchange rate adjustment | (528) | 0 | 0 | 0 |
| Net change in cash | -4,710 | 327,055 | 509,707 | 498,977 |
Financial Ratios
| 2025 | 2026E | 2027E | 2028E | |
|---|---|---|---|---|
| Growth(%) | ||||
| Turnover | 155.6 | 610.2 | 63.6 | 21.2 |
| Operating profits | -250.2 | 3980.9 | 65.2 | 3.1 |
| EPS | -125.7 | 11715.5 | 60.0 | 3.1 |
| Margins (%) | ||||
| Gross Margin | 41.0 | 87.1 | 88.3 | 76.5 |
| Operating Margin | 14.2 | 81.6 | 82.4 | 70.1 |
| Pretax Margin | 12.5 | 80.7 | 82.2 | 70.0 |
| Net Margin | 3.0 | 55.3 | 57.2 | 48.7 |
| Return (%) | ||||
| ROAE | 1.2 | 70.0 | 50.5 | 30.9 |
| ROAA | 0.6 | 45.7 | 41.0 | 26.9 |
| Gearing (%) | ||||
| Net Debt/Equity | 58.9 | (43.8) | (68.6) | (75.3) |
| Liabilities/Equity | 118.5 | 34.4 | 17.6 | 13.1 |
| Ratios (X) | ||||
| Current ratio | 2.1 | 8.2 | 16.1 | 18.2 |
| Quick ratio | 0.7 | 6.8 | 14.5 | 16.2 |
| Others | ||||
| AR/NR Turnover (days) | 10 | 10 | 10 | 10 |
| Inventory Turnover (days) | 236 | 236 | 236 | 236 |
| AP Turnover (days) | 75 | 75 | 75 | 75 |
| Cash Conversion (days) | 171 | 171 | 171 | 171 |
M Idea
Risk Reward Reference links
- View explanation of Options Probabilities methodology -
Options_Probabilities_Exhibit_Link.pdf
- View descriptions of Risk Rewards Themes - RR_Themes_Exhibit_Link.pdf
-
View explanation of regional hierarchies - GEG_Exhibit_Link.pdf
-
View explanation of Theme/Exposure methodology -
ESG_Sustainable_Solutions_External_Link.pdf
- View explanation of HERS methodology - ESG_HERS_External_Link.pdf
M Idea
INDUSTRY COVERAGE: Greater Ch na Technology Sem conductors
M Idea M Idea Stock Ratings are subject to c ange. Please see latest researc for eac company.
| Company (Ticker) | Rating (As Of) | Price* (10/12/202 ) |
|---|---|---|
| Charlie Chan | ||
| Advanced Wireless Semiconductor Co (8086.TWO) | U (07/14/2025) | NT$148.50 |
| Alchip Technologies Ltd (3661.TW) | O (05/14/2021) | NT$4,395.00 |
| ASE Technology Holding Co. Ltd. (3711.TW) | O (09/15/2024) | NT$762.00 |
| Cambricon Technology Corporation (688256.SS) | O (04/27/2026) | Rmb971.88 |
| CXMT Corp (688825.SS) | O (08/26/2026) | Rmb48.34 |
| Global Unichip Corp (3443.TW) | O (06/24/2026) | NT$8,100.00 |
| GlobalWafers Co Ltd (6488.TWO) | E (05/19/2026) | NT$1,115.00 |
| Gudeng Precision (3680.TWO) | O (11/25/2025) | NT$569.00 |
| Hua Hong Semiconductor Ltd (1347.HK) | E (03/12/2026) | HK$89.85 |
| Iluvatar CoreX Semiconductor Co., Ltd. (9903.HK) | O (04/27/2026) | HK$88.00 |
| MediaTek (2454.TW) | O (11/28/2025) | NT$4,625.00 |
| MetaX Integrated Circuits (688802.SS) | E (04/27/2026) | Rmb451.55 |
| Nanya Technology Corp. (2408.TW) | O (05/28/2026) | NT$527.00 |
| OmniVision Integrated Circuits Group Inc (603501.SS) | E (11/17/2025) | Rmb77.29 |
| Phison Electronics Corp (8299.TWO) | E (02/25/2026) | NT$2,055.00 |
| SG Micro Corp. (300661.SZ) | E (11/03/2025) | Rmb93.41 |
| Silergy Corp. (6415.TW) | U (05/19/2026) | NT$440.00 |
| SMIC (0981.HK) | O (10/21/2025) | HK$56.20 |
| TSMC (2330.TW) | O (02/07/2022) | NT$2,540.00 |
| UMC (2303.TW) | O (05/19/2026) | NT$145.50 |
| Vanguard International Semiconductor (5347.TWO) | E (01/14/2026) | NT$181.00 |
| WIN Semiconductors Corp (3105.TWO) | E (10/09/2026) | NT$580.00 |
| Daisy Dai, CFA | ||
| ASMPT Ltd (0522.HK) | O (07/24/2025) | HK$160.70 |
| China Resources Microelectronics Limited (688396.SS) | U (03/02/2026) | Rmb50.15 |
| Empyrean Technology Co Ltd (301269.SZ) | E (01/17/2025) | Rmb97.90 |
| Hangzhou Silan Microelectronics Co. Ltd. (600460.SS) | U (08/25/2025) | Rmb27.85 |
| Hygon Information Technology Co., Ltd. (688041.SS) | O (07/03/2026) | Rmb213.50 |
| Innoscience (2577.HK) | E (10/13/2025) | HK$35.62 |
| JCET Group Co Ltd (600584.SS) | O (09/16/2026) | Rmb59.99 |
| Shanghai Fudan Microelectronics (1385.HK) | O (03/07/2025) | HK$23.54 |
| SICC Co Ltd (688234.SS) | O (03/20/2026) | Rmb93.57 |
| SJ Semiconductor Corp (688820.SS) | E (09/16/2026) | Rmb104.09 |
| StarPower Semiconductor Ltd (603290.SS) | E (05/14/2026) | Rmb74.06 |
| Unigroup Guoxin Microelectronics Co Ltd (002049.SZ) | U (01/10/2023) | Rmb55.70 |
| Universal Scientific Ind. (Shanghai) (601231.SS) | O (11/05/2025) | Rmb22.39 |
| Yangjie Technology (300373.SZ) | O (06/10/2022) | Rmb78.79 |
| Daniel Yen, CFA | ||
| AP Memory Technology Corp (6531.TW) | O (07/11/2025) | NT$947.00 |
| ASMedia Technology Inc (5269.TW) | U (10/03/2025) | NT$1,540.00 |
| Aspeed Technology (5274.TWO) | O (06/09/2025) | NT$17,695.00 |
| Egis Technology Inc (6462.TWO) | E (01/28/2026) | NT$100.00 |
| Elan Microelectronics Corp (2458.TW) | O (10/03/2025) | NT$133.00 |
| eMemory Technology Inc (3529.TWO) | O (08/18/2026) | NT$2,850.00 |
| Espressif Systems (688018.SS) | O (05/15/2023) | Rmb111.70 |
| Giga evice Semiconductor Beijing Inc (603986.SS) | O (05/15/2025) | Rmb310.84 |
| Macronix International Co Ltd (2337.TW) | O (09/18/2025) | NT$115.50 |
| Montage Technology Co Ltd (6809.HK) | O (03/18/2026) | HK$254.80 |
| Montage Technology Co Ltd (688008.SS) | O (03/18/2026) | Rmb191.84 |
| Novatek (3034.TW) | U (02/04/2026) | NT$529.00 |
| Nuvoton Technology Corporation (4919.TW) | U (11/10/2025) | NT$154.00 |
| Parade Technologies Ltd (4966.TWO) | O (05/27/2026) | NT$553.00 |
| Powerchip Semiconductor Manufacturing Co (6770.TW) | O (10/27/2025) | NT$71.40 |
|---|---|---|
| Realtek Semiconductor (2379.TW) | E (01/30/2026) | NT$746.00 |
| Shenzhen Goodix Technology Co Ltd (603160.SS) | U (07/14/2025) | Rmb50.08 |
| Winbond Electronics Corp (2344.TW) | O (05/28/2026) | NT$174.00 |
| WPG Holdings (3702.TW) | O (03/16/2026) | NT$116.00 |
| WT Microelectronics Co. Ltd. (3036.TW) | O (01/27/2026) | NT$216.50 |
| Duan Liu | ||
| osilicon Co Ltd (688110.SS) | U (09/06/2024) | Rmb65.71 |
| Shenzhen Longsys Electronics Co Ltd (301308.SZ) | E (02/25/2026) | Rmb271.81 |
| Henry Zhao | ||
| ACM Research Inc (ACMR.O) | O (03/07/2023) | US$71.37 |
| Advanced Micro-Fabrication Equipment Inc (688012.SS) | O (11/06/2023) | Rmb311.21 |
| Maxscend Microelectronics Co Ltd (300782.SZ) | U (01/11/2021) | Rmb60.48 |
| NAURA Technology Group Co Ltd (002371.SZ) | O (11/06/2023) | Rmb587.98 |
| Lucas Wang | ||
| AllRing Tech Co. (6187.TWO) | O (09/23/2025) | NT$1,675.00 |
| FOCI Fiber Optic Communications Inc (3363.TWO) | E (10/09/2026) | NT$602.00 |
| Hon Precision (7769.TW) | O (04/17/2026) | NT$6,490.00 |
| King Yuan Electronics Co Ltd (2449.TW) | O (03/03/2023) | NT$300.00 |
| MPI Corporation (6223.TWO) | O (04/17/2026) | NT$6,130.00 |
| Tiffany Yeh | ||
| Himax Technologies Inc (HIMX.O) | E (02/04/2026) | US$13.30 |
| Silicon Motion (SIMO.O) | O (05/06/2024) | US$263.90 |
| WinWay Technology Co Ltd (6515.TW) | O (04/17/2026) | NT$6,025.00 |
- Historical prices are not split adjusted.