PDF 原檔:報告_JPM_ASMPT0522_20260715_original.pdf
圖片清單(已驗證 2026-07-17)
| 檔名 | size | 分類 | 親眼所見內容 |
|---|---|---|---|
JPM_ASMPT_Ltd__0522__TCB_2026-07-15_5369386_016.png |
147KB | 真資料圖 | ASMPT Ltd (0522) Price Chart:股價走勢 2023/09-2026/06 疊加歷次評等/目標價變動標籤(OW HK$87→82→100→120→115→90→N58→67→76→OW125→130→175);右側附完整日期/評等/股價/目標價明細表 12 筆,最新 2026-04-22 OW、股價 148.10、TP 175(本次報告即由此上調至 225) |
JPM_ASMPT_Ltd__0522__TCB_2026-07-15_5369386_001.png |
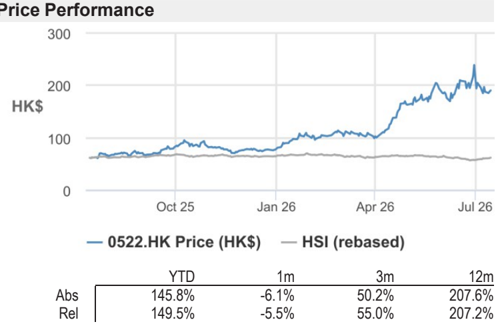
55KB | 真資料圖 | Price Performance:0522.HK Price(HK$,藍線)vs HSI rebased(灰線)2025/09-2026/07;下表列 Abs/Rel 報酬 YTD +145.8%/1m -6.1%/3m +50.2%/12m +207.6% |
JPM_ASMPT_Ltd__0522__TCB_2026-07-15_5369386_015.png |
69KB | 真資料圖 | Figure 13:ASMPT trailing P/BV bands(多條倍數線 0.7x-4x)與 ROE(右軸)2010-2026,股價與 ROE 於 2026 同步急升 |
JPM_ASMPT_Ltd__0522__TCB_2026-07-15_5369386_014.png |
69KB | 真資料圖 | Figure 11:ASMPT trailing P/E bands(6x/11x/15x/20x/24x)2010-2026,股價 2026 突破 24x 帶 |
JPM_ASMPT_Ltd__0522__TCB_2026-07-15_5369386_013.png |
68KB | 真資料圖 | Figure 12:ASMPT 12M forward P/BV bands(0.7x-4x)與 ROE(右軸)2010-2026 |
JPM_ASMPT_Ltd__0522__TCB_2026-07-15_5369386_012.png |
69KB | 真資料圖 | Figure 10:ASMPT 12M forward P/E bands(6x/11x/15x/20x/24x)2010-2026,2026 年股價急升穿越 24x 帶頂部 |
JPM_ASMPT_Ltd__0522__TCB_2026-07-15_5369386_009.png |
62KB | 真資料圖 | Figure 8:Semiconductor bookings(HK$mn 柱狀)與 YoY%(折線)2Q21-1Q26,近期 YoY 回升至 39%~101% |
JPM_ASMPT_Ltd__0522__TCB_2026-07-15_5369386_008.png |
54KB | 真資料圖 | Figure 6:Semiconductor revenue(柱狀)與 YoY%(折線)2017-2028E,2026E-2028E YoY 25%/29%/19% |
JPM_ASMPT_Ltd__0522__TCB_2026-07-15_5369386_007.png |
55KB | 真資料圖 | Figure 4:ASMPT operating profit(柱狀)與 OPM%(折線)2018-2028E,2026E-2028E OPM 11.8%/15.8%/17.1% 明顯優於 2023-2025 個位數低點 |
JPM_ASMPT_Ltd__0522__TCB_2026-07-15_5369386_006.png |
57KB | 真資料圖 | Figure 2:ASMPT quarterly revenue(柱狀)與 YoY%(折線)1Q25-4Q28E |
JPM_ASMPT_Ltd__0522__TCB_2026-07-15_5369386_011.png |
59KB | 真資料圖 | Figure 9:SMT bookings(柱狀)與 YoY%(折線)2Q21-1Q26 |
JPM_ASMPT_Ltd__0522__TCB_2026-07-15_5369386_010.png |
53KB | 真資料圖 | Figure 7:SMT revenue(柱狀)與 YoY%(折線)2017-2028E |
JPM_ASMPT_Ltd__0522__TCB_2026-07-15_5369386_005.png |
49KB | 真資料圖 | Figure 5:ASMPT net profit(柱狀)與 YoY%(折線)2018-2028E,2026E-2028E YoY 161%/54%/23% |
JPM_ASMPT_Ltd__0522__TCB_2026-07-15_5369386_004.png |
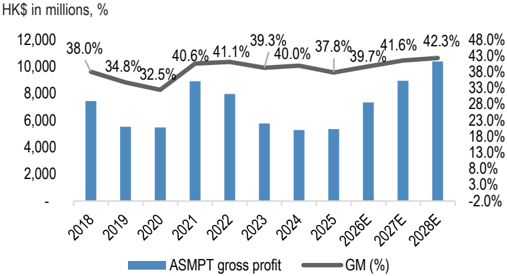
51KB | 真資料圖 | Figure 3:ASMPT gross profit(柱狀)與 GM%(折線)2018-2028E,2026E-2028E GM 39.7%/41.6%/42.3% |
JPM_ASMPT_Ltd__0522__TCB_2026-07-15_5369386_003.png |
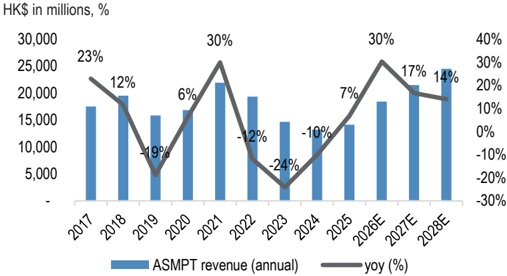
55KB | 真資料圖 | Figure 1:ASMPT annual revenue(柱狀)與 YoY%(折線)2017-2028E,2026E YoY +30% |
分類只有三類:
真資料圖/裝飾·logo·banner/文字卡。<40KB 未 Read 者免列(_002.png26KB 未 Read,其餘 15 張皆 ≥40KB 已逐張 Read)。
原始內容
Quant
Factors
Value
Growth
Momentum
Quality
Low Vol
Current
10
2
Hist %Rank (1=Top)
58
23
85
95
76
66
53
85
77
46
63
85
ASMPT Ltd (0522)
TCB TAM upside from CoWoS/HBM; China OSAT and Intel EMIB as medium-term drivers; raise PT to HK$225
ASMPT's share price has outperformed the HSTech index after the company reported its 1Q26 results in April (ASMPT up 20%+ vs. HSTech down ~5%) reflecting stronger momentum in TCB and photonics with positive sentiment on the back of the mainstream segment's recovery. We see further upside to the TCB TAM, driven by our expectations of (1) stronger CoWoS/HBM buildout in 2027/28; (2) rising OSAT capacity additions for 2.5D packaging; and (3) a delay in HBM stacking migration keeping TCB relevant for longer (12Hi is likely to remain mainstream for longer than expected). ASMPT maintains a dominant position in logic TCB and is increasing its share in memory TCB (we estimate 30-40% overall TCB market share). Meanwhile, mainstream demand is improving as OSAT capacity is increasingly being filled up by AI and AI-adjacent workloads, prompting incremental capacity addition. With strong operating leverage coming through due to disciplined cost control, we see strong earnings growth of 97%/54%/23% YoY in 2026/27/28 for ASMPT. Medium-term upside could stem from: (a) increased EMIB investment by Intel; (b) a pickup in China CoWoS capacity buildout; and (c) potential divestiture of the SMT business and reinvestment into advanced packaging. We maintain Overweight and raise our June 2027 price target to HK$225.
- Upside to TCB TAM likely, given stronger CoWoS, HBM build: We continue to see upside to ASMPT's TCB TAM (ASMPT had originally guided to a $1.6bn TCB TAM by 2028), given we expect strong growth in both CoWoS and HBM packaging buildout. We have already raised our CoWoS capacity estimates four times in 2026 and now expect 92%/39% YoY growth in CoWoS shipments in 2027/28, with the upside coming primarily from OSATs' capacity expansion. ASMPT remains the dominant player in TCB tools for the C2S process step for TSMC and OSATs for CoWoS-L and similar packages. While C2W still remains on flipchip, we have started to see a move towards fluxless TCB for smaller customers such as AMD, who are embracing SoIC for logiclogic integration. As more customers (Trainium, NVDA Feynman, TPU) start migrating to SoIC for logic-logic chiplet integration, the C2W step in CoWoS is also likely to increasingly adopt fluxless TCBs, which should expand the logic TCB TAM considerably. On HBM, we anticipate positive commentary about HBM4 orders from Korean customers, with a faster ramp-up in 2H26 and 2027. In addition, slower stack migration in HBM (12Hi is likely to remain the mainstream for HBM4E) and a potential relaxation of the stack height by the JEDEC both point to stronger growth in TCBs for HBM and a negligible loss of share to hybrid bonding in the next 2-3 years. The HBM TCB market remains highly competitive, but we believe that ASMPT could secure 30-35% market share with key customers in Korea, while also making further inroads at other customers. TCB already accounts for ~50% of the company's advanced packaging portfolio and we thus believe the expanding TCB TAM will translate into a strong growth trajectory for the company's SEMI business (JPMe SEMI revenue to grow 25%/29% YoY in 2026/27).
- China OSAT investment and Intel EMIB activity pickup should create additional upside in 2027 and beyond: Chinese OSATs are also now starting to make strong investments in CoWoS-related capacity to fulfill domestic AI accelerator demand (JCET recently announced capex of Rmb10bn in 2026 vs.
Sources for: Style Exposure - J.P. Morgan Global Markets Strategy; all other tables are company data and J.P. Morgan estimates.
Overweight
0522.HK, 522 HK Price (15 Jul 26):HK$190.40
▲Price Target (Jun-27):HK$225.00
Prior (Dec-26):HK$175.00
Technology and Telecoms
Gokul Hariharan AC
(852) 2800-8564
gokul.hariharan@jpmorgan.com
J.P. Morgan Securities (Asia Pacific) Limited/ J.P. Morgan Broking (Hong Kong) Limited
Jennifer Hsieh
(886-2) 2725-9868
jennifer.hsieh@jpmorgan.com
J.P. Morgan Securities (Taiwan) Limited
David Chou
(886-2) 2725-9618 david.chou@jpmorgan.com J.P. Morgan Securities (Taiwan) Limited
Jason Chen
(886-2) 2725-9864 jason.bh.chen@jpmorgan.com
J.P. Morgan Securities (Taiwan) Limited
Subham Singhania
(91-22) 6157-3801
subham.singhania@jpmorgan.com
J.P. Morgan India Private Limited
| Quarterly Forecasts (FYE Dec) | Quarterly Forecasts (FYE Dec) | Quarterly Forecasts (FYE Dec) | Quarterly Forecasts (FYE Dec) |
|---|---|---|---|
| Adj. EPS (HK$) | 2025A | 2026E | 2027E |
| Q1 | 0.20 | 0.61A | 1.31 |
| Q2 | 0.31 | 0.98 | 1.55 |
| Q3 | (0.65) | 1.31 | 1.95 |
| Q4 | 2.29 | 1.37 | 1.75 |
| FY | 2.16 | 4.27 | 6.56 |
Style Exposure
Flice Ferrormance
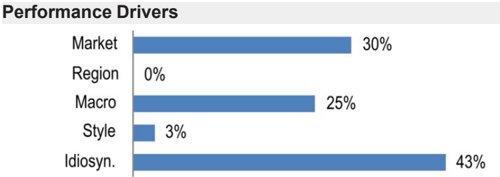
Ferrormance Drivers
300
J.P. Morgan
Market
HK$
Idiosyn.
0
Oct 25
Factors
Market: MSCI Asia Pac ex JP
Macro:
Quant Styles:
DivYld
Value
Jan 26
30%
25%
6M Corr
0.60
Apr 26
-0.30
— HSI (rebased)
43%
1Y Corr
0.55
Jul 26
-0.09
Growth
| Company Data | |
|---|---|
| Shares O/S (mn) | 411 |
| 52-week range (HK$) | 244.40-59.33 |
| Market cap ($ mn) | 9,979 |
| Exchange rate | 7.84 |
| Free float (%) | 75.2% |
| 3M ADV (mn) | 4.85 |
| 3M ADV ($ mn) | 112.0 |
| Volatility (90 Day) | 77 |
| Index | HSI |
| BBG ANR (Buy | Hold | Sell) | 18|4|0 |
Key Metrics (FYE Dec)
| HK$ in millions | FY25A | FY26E | FY27E | FY28E |
|---|---|---|---|---|
| Financial Estimates | ||||
| Revenue | 14,146 | 18,444 | 21,524 | 24,544 |
| Adj. EBIT | 541 | 2,174 | 3,398 | 4,208 |
| Adj. EBITDA | 1,103 | 2,639 | 3,952 | 4,807 |
| Adj. net income | 902 | 1,785 | 2,746 | 3,382 |
| Adj. EPS | 2.16 | 4.27 | 6.56 | 8.09 |
| BBG EPS | 0.78 | 3.97 | 5.97 | 7.51 |
| Cashflow from operations | 121 | 4,279 | 2,428 | 3,000 |
| FCFF | (411) | 3,777 | 1,782 | 2,264 |
| Margins and Growth | ||||
| Revenue Growth Y/Y (%) | 6.9% | 30.4% | 16.7% | 14.0% |
| EBIT margin | 3.8% | 11.8% | 15.8% | 17.1% |
| EBIT Growth Y/Y (%) | (3.1%) | 301.9% | 56.3% | 23.8% |
| EBITDA margin | 7.8% | 14.3% | 18.4% | 19.6% |
| EBITDA Growth Y/Y (%) | (4.7%) | 139.3% | 49.8% | 21.6% |
| Net margin | 6.4% | 9.7% | 12.8% | 13.8% |
| Adj. EPS growth | 160.2% | 97.3% | 53.8% | 23.2% |
| Ratios | ||||
| Adj. tax rate | 10.9% | 24.9% | 25.6% | 25.6% |
| Interest cover | 14.4 | NM | NM | NM |
| Net debt/Equity | NM | NM | NM | NM |
| Net debt/EBITDA | NM | NM | NM | NM |
| ROE | 5.6% | 9.9% | 13.6% | 14.8% |
| Valuation | ||||
| FCFF yield | (0.5%) | 4.7% | 2.2% | 2.8% |
| Dividend yield | 0.3% | 0.5% | 0.9% | 0.0% |
| EV/Revenue | 5.2 | 3.8 | 3.2 | 2.7 |
| EV/EBITDA | 67.1 | 26.5 | 17.4 | 13.9 |
| Adj. P/E | 88.1 | 44.6 | 29.0 | 23.5 |
Summary Investment Thesis and Valuation
Investment Thesis
We are OW on ASMPT, given we expect continued growth in Advanced Packaging and a strong recovery in mainstream SEMI and SMT solutions, driven by AI server boards and PMICs. We see further upside to TCB TAM, as we expect (1) stronger CoWoS/HBM buildout in 2027/28; (2) rising OSAT capacity additions for 2.5D packaging; and (3) a delay in HBM stacking migration keeping TCB relevant for longer. With strong operating leverage coming through due to disciplined cost control, we see strong earnings growth ahead for ASMPT. Medium-term upside could stem from: (a) increased EMIB investment by Intel; (b) a pickup in China CoWoS capacity buildout; and (c) potential divestiture of the SMT business and reinvestment into advanced packaging.
Valuation
Our Jun-27 PT of HK$225 is based on ~30x 12M forward EPS, three notches higher than the previous target multiple to reflect further upside to TCB TAM and medium-term opportunities from (1) increased EMIB adoption, (2) growing China CoWoS capacity investments, and (3) reinvestment in advanced packaging from the potential SMT divestiture.
Rmb8bn in 2025; further investment by SJ Semi; etc.). We believe ASMPT is well positioned to benefit from this investment cycle. In addition, Intel is also finally starting its packaging capacity expansion given increased customer adoption of EMIB-T (primarily for Google TPU v9 Humufish), which should lead to more upside for ASMPT's C2S and C2W TCB solutions, given ASMPT's market leadership position within Intel. ASMPT did announce that it had secured eight TCB tool orders from an IDM for datacenter CPUs (this could be Intel for Clearwater Forest and Diamond Rapids, in our view) but we expect further upside as EMIB-T capacity ramps up in 2027-28.
- Mainstream demand improving, given tight capacity across OSATs and recovery in power/AI adjacent demand: We are seeing selective improvement in mainstream demand, particularly in industrial, auto, and AI peripherals (e.g., power management). While a broad-based recovery in mainstream end-demand has not yet materializedsmartphone and PC demand remain weak, given memory price hikes-OSAT capacity is already running tight, as a significant portion is dedicated to AI and AI-related products, pushing OSATs to start investing in mainstream packaging capacity for the first time in this cycle. Therefore, we expect ASMPT's mainstream packaging business to grow 28%/11% YoY in 2026/27, with upside risk likely to emerge if smartphone/PC demand inflects positively.
- Strategic initiatives for SMT business disposal and reinvestment in advanced packaging a medium-term catalyst: ASMPT continues to make progress in the divestiture of its SMT business. While SMT (40-50% of revenue) has performed well over the past 2-3 quarters on the back of AI server and AI peripheral demand, we view the potential disposal as a positive catalyst, as it would allow ASMPT to reinvest more aggressively in its key earnings driver-advanced packaging. We expect some updates on the SMT business disposal in the next couple of quarters, along with the announcement of a new CEO.
- Operating leverage key to watch given strong opex control: We expect ASMPT to benefit from strong operating leverage, driven by robust revenue growth and tighter opex control. We forecast only high-single-digit YoY opex growth in 2026-27, versus 30%/17% top-line growth, driving OPM expansion of ~8ppts/4ppts YoY. Coupled with a GM improvement on the back of a favorable mix (i.e., a higher TCB contribution), we expect EPS to reach HK$4.3/6.6/8.1 in 2026/27/28 (up 97%/54%/23% YoY).
Key charts and tables
Figure 1: ASMPT annual revenue and yoy trend
Source: Company data, J.P. Morgan estimates.
Figure 3: ASMPT gross profit and GM trend
Source: Company data, J.P. Morgan estimates.
Figure 5: ASMPT net profit and yoy trend
HK$ in millions, %
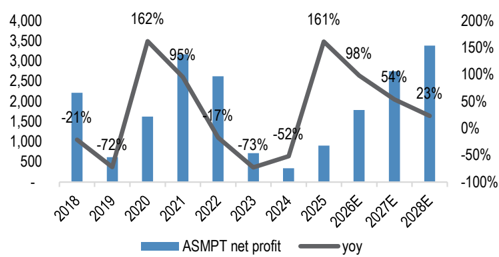
Source: Company data, J.P. Morgan estimates.
Figure 2: ASMPT quarterly revenue and yoy trend
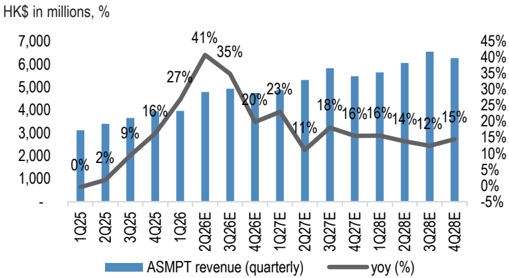
Source: Company data, J.P. Morgan estimates.
Figure 4: ASMPT operating profit and OPM trend
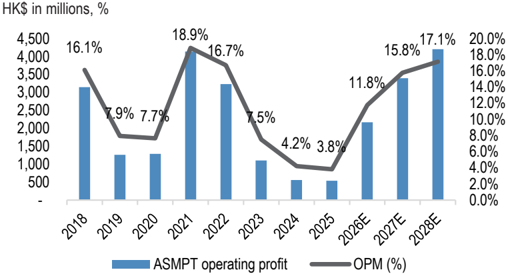
Source: Company data, J.P. Morgan estimates.
Figure 6: Semiconductor revenue and yoy trend
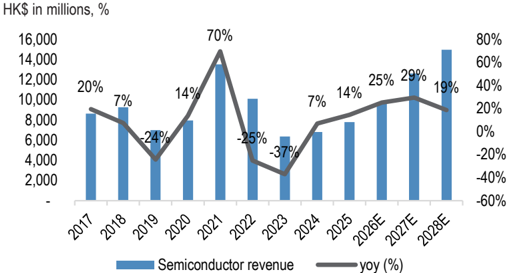
Source: Company data, J.P. Morgan estimates.
Figure 8: Semiconductor bookings and yoy trend
HK$ in millions, %
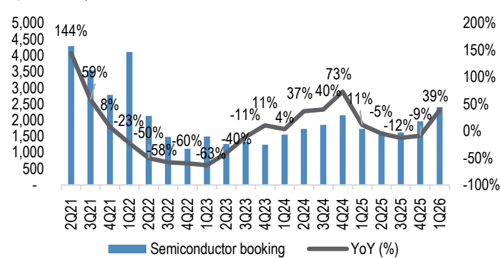
Source: Company data.
Figure 7: SMT revenue and yoy trend
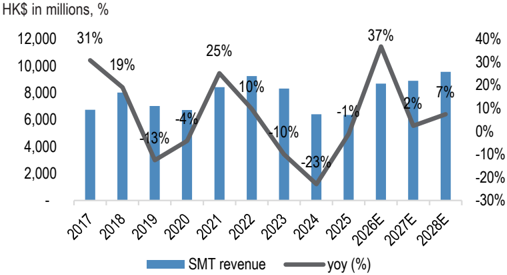
Source: Company data, J.P. Morgan estimates.
Figure 9: SMT bookings and yoy trend
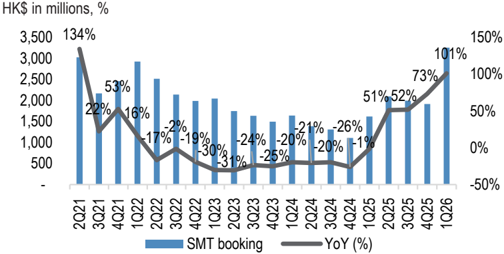
Source: Company data.
Table 1: ASMPT quarterly estimate revisions
| Revised | Revised | Revised | Prior | Prior | Prior | Change (%) | Change (%) | Change (%) | |
|---|---|---|---|---|---|---|---|---|---|
| HK$ million | 2Q26E | 3Q26E | 4Q26E | 2Q26E | 3Q26E | 4Q26E | 2Q26E | 3Q26E | 4Q26E |
| Revenues (HK$ in mn) | 4,790 | 4,939 | 4,748 | 4,476 | 4,826 | 4,846 | 7% | 2% | -2% |
| Gross profit | 1,872 | 1,976 | 1,917 | 1,798 | 1,944 | 1,959 | 4% | 2% | -2% |
| GM (%) | 39.1% | 40.0% | 40.4% | 40.2% | 40.3% | 40.4% | -110bps | -28bps | -4bps |
| Operating profit | 506 | 646 | 636 | 514 | 635 | 678 | -1% | 2% | -6% |
| OPM (%) | 10.6% | 13.1% | 13.4% | 11.5% | 13.2% | 14.0% | -90bps | -8bps | -60bps |
| Pretax profit | 571 | 727 | 715 | 575 | 717 | 761 | -1% | 1% | -6% |
| Net profit | 408 | 548 | 575 | 411 | 541 | 611 | -1% | 1% | -6% |
| EPS (HK$) | 0.98 | 1.31 | 1.37 | 0.98 | 1.29 | 1.46 | -1% | 1% | -6% |
| Operating Assumptions | |||||||||
| Semiconductor sales | 2,420 | 2,569 | 2,615 | 2,471 | 2,620 | 2,684 | -2% | -2% | -3% |
| SMT sales | 2,370 | 2,370 | 2,133 | 2,005 | 2,206 | 2,162 | 18% | 7% | -1% |
| Semiconductor GM (%) | 46.0% | 46.0% | 46.0% | 46.0% | 46.0% | 46.0% | 0bps | 0bps | 0bps |
| SMT GM (%) | 32.0% | 33.5% | 33.5% | 33.0% | 33.5% | 33.5% | -100bps | 0bps | 0bps |
Source: J.P. Morgan estimates.
Table 2: ASMPT annual estimate revisions
| Revised | Revised | Revised | Prior | Prior | Change (%) | Change (%) | |
|---|---|---|---|---|---|---|---|
| HK$ million | 2026E | 2027E | 2028E | 2026E | 2027E | 2026E | 2027E |
| Revenues (HK$ in mn) | 18,444 | 21,524 | 24,544 | 18,115 | 21,735 | 2% | -1% |
| Gross profit | 7,331 | 8,945 | 10,389 | 7,267 | 8,962 | 1% | -0% |
| GM (%) | 39.7% | 41.6% | 42.3% | 40.1% | 41.2% | -37bps | 33bps |
| Operating profit | 2,174 | 3,398 | 4,208 | 2,212 | 3,347 | -2% | 2% |
| OPM (%) | 11.8% | 15.8% | 17.1% | 12.2% | 15.4% | -43bps | 39bps |
| Pretax profit | 2,459 | 3,676 | 4,529 | 2,498 | 3,626 | -2% | 1% |
| Net profit | 1,785 | 2,746 | 3,382 | 1,817 | 2,708 | -2% | 1% |
| EPS (HK$) | 4.27 | 6.56 | 8.09 | 4.34 | 6.47 | -2% | 1% |
| Operating Assumptions | |||||||
| Semiconductor sales | 9,747 | 12,614 | 14,971 | 9,919 | 12,706 | -2% | -1% |
| SMT sales | 8,696 | 8,909 | 9,573 | 8,196 | 9,029 | 6% | -1% |
| Semiconductor GM (%) | 46.1% | 46.5% | 47.0% | 46.1% | 46.0% | 0bps | 53bps |
| SMT GM (%) | 32.6% | 34.5% | 35.0% | 32.9% | 34.5% | -26bps | 0bps |
Source: J.P. Morgan estimates.
Estimate revisions
Figure 10: ASMPT 12M forward P/E bands
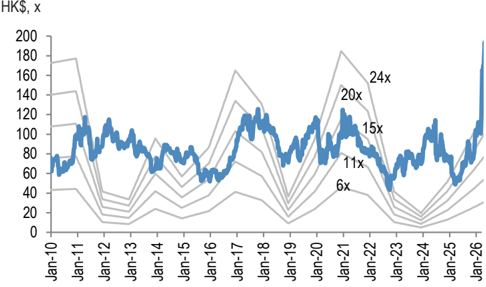
Source: Bloomberg Finance L.P., J.P. Morgan estimates.
Figure 12: ASMPT 12M forward P/BV bands and ROE
HK$, x, %
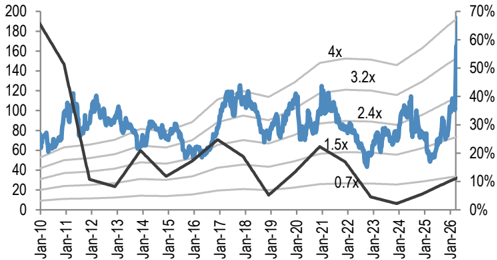
Source: Bloomberg Finance L.P., J.P. Morgan estimates.
P/E and P/B bands
Figure 11: ASMPT trailing P/E bands
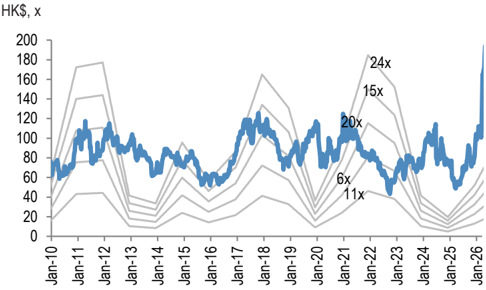
Source: Bloomberg Finance L.P., J.P. Morgan estimates.
Figure 13: ASMPT trailing P/BV bands and ROE HK$, x, %
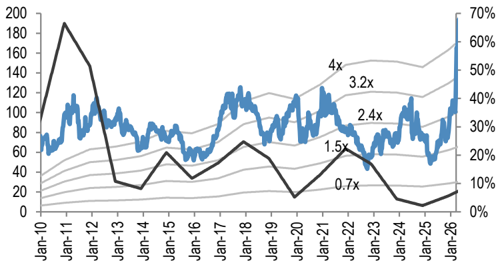
Source: Bloomberg Finance L.P., J.P. Morgan estimates.
Gokul Hariharan AC (852) 2800-8564 gokul.hariharan@jpmorgan.com
Table 3: ASMPT earnings
HK$ in millions, %
| FY25 | FY25 | FY25 | FY26E | FY26E | FY26E | FY26E | FY26E | |||||||||||||||||
|---|---|---|---|---|---|---|---|---|---|---|---|---|---|---|---|---|---|---|---|---|---|---|---|---|
| HK$ in millions, year-end December | 1Q | 2Q | 3Q | 4Q | 1Q | 2QE | 3QE | 4QE | 1QE | 2QE | 3QE | 4QE | 1QE | 2QE | 3QE | 4QE | FY25 | FY26E | FY27E | FY28E | FY28E | FY28E | FY28E | |
| Sales | 3,125 | 3,402 | 3,661 | 3,959 | 3,967 | 4,790 | 4,939 | 4,748 | 4,883 | 5,323 | 5,833 | 5,485 | 5,644 | 6,061 | 6,558 | 6,281 | 14,146 18,444 | 21,524 | 24,544 | 24,544 | 24,544 | 24,544 | ||
| COGS (incl. dep) | -1,846 | -2,051 | -2,355 | -2,540 | -2,401 | -2,918 | -2,963 | -2,830 | -2,880 | -3,137 | -3,380 | -3,181 | -3,269 | -3,506 | -3,768 | -3,612 | 8,793 | 11,113 | 12,579 | 14,155 | 14,155 | 14,155 | 14,155 | |
| Depreciation | -59 | -109 | -99 | -294 | -75 | -128 | -130 | -132 | -135 | -137 | -140 | -143 | -145 | -148 | -151 | -154 | 562 | 465 | 554 | 598 | 598 | 598 | 598 | |
| Gross profit | 1,278 | 1,351 | 1,306 | 1,419 | 1,566 | 1,872 | 1,976 | 1,917 | 2,003 | 2,186 | 2,453 | 2,303 | 2,375 | 2,555 | 2,790 | 2,669 | 5,354 | 7,331 | 8,945 | 10,389 | 10,389 | 10,389 | 10,389 | |
| Operating expense | 1,118 | 1,181 | 1,255 | 1,258 | 1,181 | 1,365 | 1,330 | 1,281 | 1,307 | 1,357 | 1,451 | 1,432 | 1,493 | 1,538 | 1,588 | 1,561 | 4,813 | 5,157 | 5,547 | 6,181 | 6,181 | 6,181 | 6,181 | |
| S&M | 365 | 391 | 411 | 417 | 398 | 451 | 439 | 423 | 431 | 448 | 479 | 472 | 493 | 508 | 524 | 515 | 1,584 | 1,710 | 1,830 | 2,040 | 2,040 | 2,040 | 2,040 | |
| G&A | 262 | 265 | 309 | 338 | 292 | 328 | 319 | 307 | 314 | 326 | 348 | 344 | 358 | 369 | 381 | 375 | 1,173 | 1,246 | 1,331 | 1,483 | 1,483 | 1,483 | 1,483 | |
| R&D | 491 | 526 | 535 | 503 | 491 | 587 | 572 | 551 | 562 | 584 | 624 | 616 | 642 | 661 | 683 | 671 | 2,056 | 2,201 | 2,385 | 2,658 | 2,658 | 2,658 | 2,658 | |
| Operating (EBIT) | 160 | 169 | 50 | 161 | 385 | 506 | 646 | 636 | 696 | 829 | 1,002 | 872 | 882 | 1,016 | 1,202 | 1,107 | 541 | 2,174 | 3,398 | 4,208 | 4,208 | 4,208 | 4,208 | |
| Net interest income (expense) | -24 | -15 | -14 | -23 | -11 | 5 | 21 | 21 | 15 | 15 | 15 | 15 | 18 | 18 | 21 | 21 | -77 | 36 | 59 219 | 78 | 78 | 78 | 78 | |
| Net other income (expense) | -29 | -48 | -258 | 1,058 | 71 | 59 | 61 | 59 | 60 | 64 | 70 | 25 | 68 | 72 | 77 | 27 | 723 | 249 | 243 | 243 | 243 | 243 | ||
| Pre-tax profit | 107 | 107 | -222 | 1,196 | 445 | 571 | 727 | 715 | 770 | 908 | 1,086 | 912 | 968 | 1,107 | 1,299 | 1,155 | 1,187 | 2,459 | 3,676 | 4,529 | 4,529 | 4,529 | 4,529 | |
| Tax credit (expense) | 24 | -28 | 47 | 86 | 121 | 166 | 182 | 143 | 223 | 263 | 271 | 182 | 281 | 321 | 325 | 231 | 129 | 612 | 941 | 1,158 | 1,158 | 1,158 | 1,158 | |
| Net profit | 84 | 131 | -270 | 957 | 254 | 408 | 548 | 575 | 550 | 647 | 817 | 732 | 690 | 788 | 977 | 927 | 902 | 1,785 | 2,746 | 3,382 | 3,382 | 3,382 | 3,382 | |
| Adjusted O/S (mn) | 416 | 417 | 417 | 418 | 418 | 418 | 418 | 418 | 418 | 418 | 418 | 418 | 418 | 418 | 418 | 418 | 417 | 418 | 418 | 418 | 418 | 418 | 418 | |
| FD EPS (HK$) | 0.20 | 0.31 | -0.65 | 2.29 | 0.61 | 0.98 | 1.31 | 1.37 | 1.31 | 1.55 | 1.95 | 1.75 | 1.65 | 1.88 | 2.34 | 2.22 | 2.16 | 4.27 | 6.56 | 8.09 | 8.09 | 8.09 | 8.09 | |
| Segment revenue | ||||||||||||||||||||||||
| Semiconductor | 1,990 | 2,010 | 1,880 | 1,911 | 2,144 | 2,420 | 2,569 | 2,615 | 2,856 | 3,135 | 3,425 | 3,198 | 3,426 | 3,709 | 4,019 | 3,818 7,791 | 9,747 | 12,614 | 14,971 | 14,971 | 14,971 | 14,971 | ||
| SMT | 1,135 | 1,392 | 1,781 | 2,048 | 1,823 | 2,370 | 2,370 | 2,133 | 2,026 | 2,188 | 2,407 | 2,287 | 2,218 | 2,351 | 2,540 | 2,463 | 6,356 | 8,696 | 8,909 | 9,573 | 9,573 | 9,573 | 9,573 | |
| Margins (%) | ||||||||||||||||||||||||
| Gross | 40.9 | 39.7 | 35.7 | 35.8 | 39.5 | 39.1 | 40.0 | 40.4 | 41.0 | 41.1 | 42.0 | 42.0 | 42.1 42.2 | 42.5 | 42.5 | 37.8 | 39.7 | 41.6 | 42.3 | 42.3 | 42.3 | 42.3 | ||
| Operating | 5.1 | 5.0 | 1.4 | 4.1 | 9.7 | 10.6 | 13.1 | 13.4 | 14.2 | 15.6 | 17.2 | 15.9 | 15.6 | 16.8 | 18.3 | 17.6 | 3.8 | 11.8 | 15.8 | 17.1 | 17.1 | 17.1 | 17.1 | |
| Net | 2.7 | 3.9 | -7.4 | 24.2 | 6.4 | 8.5 | 11.1 | 12.1 | 11.3 | 12.2 | 14.0 | 13.3 | 12.2 | 13.0 | 14.9 | 14.8 | 6.4 | 9.7 | 12.8 | 13.8 | 13.8 | 13.8 | 13.8 | |
| Growth (%, Q/Q) | ||||||||||||||||||||||||
| Sales | -8 | 9 | 8 | 8 | 0 | 21 | 3 | -4 | 3 | 9 | 10 | -6 | 3 | 7 | 8 | -4 | ||||||||
| Gross profit | 1 | 6 | -3 | 9 | 10 | 20 | 6 | -3 | 4 | 9 | 12 | -6 | 3 | 8 | 9 -4 | |||||||||
| EBIT | 3,045 | 6 | -70 | 219 | 139 | 31 | 28 | -2 | 9 | 19 | 21 | -13 1 | 15 | 18 | -8 | |||||||||
| Net profit | 1,806 | 57 | -306 | -455 | -73 | 61 | 34 | 5 | -4 | 18 | 26 | -10 | -6 | 14 | 24 | -5 | ||||||||
| EPS | 1,807 | 57 | n.m. | n.m. | -74 | 61 | 34 | 5 | -4 | 18 | 26 | -10 | -6 | 14 | 24 | -5 | ||||||||
| Growth (%, Y/Y) | ||||||||||||||||||||||||
| Sales | (0) | 2 | 9 | 16 | 27 | 41 | 35 | 20 | 23 | 11 | 18 | 16 | 16 | 14 | 12 | 15 | 7 | 30 | 14 | 14 | 14 | |||
| Gross profit | (3) | 1 | (5) | 12 | 23 | 39 | 51 | 35 | 28 | 17 | 24 | 20 | 19 | 17 | 14 | 16 | 1 | 37 | 22 | 16 | 16 | |||
| EBIT | (33) | 25 | (72) | 3,066 | 141 | 199 | 1,180 | 295 | 81 | 64 | 55 | 37 | 27 | 23 | 20 | 27 | (3) | 302 56 | 24 | 24 | 24 | 24 | 24 | |
| Net profit | (54) | (3) | (1,142) | 21,716 | 203 | 211 | (303) | (40) | 117 | 59 | 49 | 27 | 26 | 22 | 20 | 27 161 | 54 | 98 | 23 | 23 | 23 | 23 | 23 | |
| EPS | (54) | (3) | (1,137) | 21,645 | 202 | 210 | (303) | (40) | 117 | 59 | 49 | 27 | 26 | 22 | 20 | 27 160 | 97 | 54 | 23 |
Source: Company data, J.P. Morgan estimates.
ASMPT financials
Investment Thesis, Valuation and Risks
ASMPT Ltd (0522) (Overweight; Price Target: HK$225.00)
Investment Thesis
We are OW on ASMPT, given we expect continued growth in Advanced Packaging and a strong recovery in mainstream SEMI and SMT solutions, driven by AI server boards and PMICs. We see further upside to TCB TAM, as we expect (1) stronger CoWoS/HBM buildout in 2027/28; (2) rising OSAT capacity additions for 2.5D packaging; and (3) a delay in HBM stacking migration keeping TCB relevant for longer. With strong operating leverage coming through due to disciplined cost control, we see strong earnings growth ahead for ASMPT. Medium-term upside could stem from: (a) increased EMIB investment by Intel; (b) a pickup in China CoWoS capacity buildout; and (c) potential divestiture of the SMT business and reinvestment into advanced packaging.
Valuation
Our Jun-27 PT of HK$225 is based on ~30x 12M forward EPS, which is the past 10 years' average level.
Risks to Rating and Price Target
The key downside risk is a weaker macro environment in 2026, impacting the sustainability of the mainstream semis recovery.
The key upside catalyst, in our view, is the failure of some competitors to catch up on technology with the migration to fluxless TCBs in HBM4E, narrowing the playing field considerably.
ASMPT Ltd (0522): Summary of Financials
| Income Statement | FY24A | FY25A | FY26E | FY27E | Cash Flow Statement | FY24A | FY25A | FY26E | FY27E |
|---|---|---|---|---|---|---|---|---|---|
| Revenue | 13,229 | 14,146 | 18,444 | 21,524 | Cash flow from operating activities | 823 | 121 | 4,279 | 2,428 |
| COGS | (7,342) | (8,231) | (10,648) | (12,024) | o/w Depreciation & amortization | 598 | 562 | 465 | 554 |
| Gross profit | 5,289 | 5,354 | 7,331 | 8,945 | o/w Changes in working capital | (117) | (1,187) | 2,113 | (862) |
| SG&A | (2,654) | (2,757) | (2,956) | (3,162) | |||||
| Adj. EBITDA | 1,157 | 1,103 | 2,639 | 3,952 | Cash flow from investing activities | (455) | (638) | (719) | (873) |
| D&A | (598) | (562) | (465) | (554) | o/w Capital expenditure | (526) | (532) | (502) | (646) |
| Adj. EBIT | 558 | 541 | 2,174 | 3,398 | as % of sales | 4.0% | 3.8% | 2.7% | 3.0% |
| Net Interest | (71) | (77) | 36 | 59 | |||||
| Adj. PBT | 502 | 1,187 | 2,459 | 3,676 | Cash flow from financing activities | (385) | 453 | 374 | (604) |
| Tax | (159) | (129) | (612) | (941) | o/w Dividends paid | (278) | (242) | (361) | (714) |
| Minority Interest | 3 | 0 | 10 | 10 | o/w Shares issued/(repurchased) | - | - | - | - |
| Adj. Net Income | 345 | 902 | 1,785 | 2,746 | o/w Net debt issued/(repaid) | 681 | (287) | 0 | 0 |
| Reported EPS | 0.83 | 2.16 | 4.27 | 6.56 | Net change in cash | (16) | (64) | 3,935 | 951 |
| Adj. EPS | 0.83 | 2.16 | 4.27 | 6.56 | |||||
| DPS | 0.67 | 0.58 | 0.86 | 1.71 | Adj. Free cash flow to firm y/y Growth | 297 (75.5%) | (411) (238.2%) | 3,777 (1019.8%) | 1,782 (52.8%) |
| Payout ratio | 38.7% | 69.7% | 39.9% | 40.0% | |||||
| Shares outstanding | 415 | 417 | 418 | 418 | |||||
| Balance Sheet | FY24A | FY25A | FY26E | FY27E | Ratio Analysis | FY24A | FY25A | FY26E | FY27E |
| Cash and cash equivalents | 4,418 | 4,666 | 8,746 | 9,697 | Gross margin | 40.0% | 37.8% | 39.7% | 41.6% |
| Accounts receivable | 3,749 | 4,238 | 4,422 | 5,109 | EBITDA margin | 8.7% | 7.8% | 14.3% | 18.4% |
| Inventories | 5,989 | 6,302 | 5,738 | 6,450 | EBIT margin | 4.2% | 3.8% | 11.8% | 15.8% |
| Other current assets | 939 | 2,302 | 95 | 110 | Net profit margin | 2.6% | 6.4% | 9.7% | 12.8% |
| Current assets | 15,095 | 17,508 | 19,002 | 21,366 | |||||
| PP&E | 2,117 | 2,087 | 2,125 | 2,216 | ROE | 2.2% | 5.6% | 9.9% | 13.6% |
| LT investments | 1,813 | 2,238 | 2,238 | 2,238 | ROA | 1.4% | 3.6% | 6.6% | 9.4% |
| Other non current assets | 4,648 | 4,330 | 4,546 | 4,773 | ROCE | 2.1% | 2.6% | 8.0% | 11.2% |
| Total assets | 23,673 | 26,163 | 27,910 | 30,593 | SG&A/Sales | 20.1% | 19.5% | 16.0% | 14.7% |
| Short term borrowings | 306 | 144 | 144 | 144 | Net debt/Equity Net debt/EBITDA | NM NM | NM NM | NM NM | NM NM |
| Payables | 2,967 | 3,953 | 3,567 | 4,009 | |||||
| Other short term liabilities | 799 | 791 | 703 | 813 | Sales/Assets (x) | 0.6 | 0.6 | 0.7 | 0.7 |
| Current liabilities | 4,072 | 4,888 | 4,414 | 4,966 | Assets/Equity (x) | 1.5 | 1.5 | 1.5 | 1.5 |
| Long-term debt | 2,375 | 2,250 | 2,250 | 2,250 | Interest cover (x) | 16.4 | 14.4 | NM | NM |
| Other long term liabilities | 1,935 | 1,892 | 1,987 | 2,086 | Operating leverage | 495.0% | (45.1%) | 994.0% | 337.3% |
| Total liabilities | 8,382 | 9,031 | 8,651 | 9,302 | Tax rate | 31.8% | 10.9% | 24.9% | 25.6% |
| Shareholders' equity | 15,188 | 17,026 | 19,153 | 21,185 | Revenue y/y Growth | (10.0%) | 6.9% | 30.4% | 16.7% |
| Minority interests | 103 | 107 | 107 | 107 | EBITDA y/y Growth | (32.0%) | (4.7%) | 139.3% | 49.8% |
| Total liabilities & equity | 23,673 | 26,163 | 27,910 | 30,593 | EPS y/y Growth | (52.0%) | 160.2% | 97.3% | 53.8% |
| Valuation | FY24A | FY25A | FY26E | FY27E | |||||
| BVPS | 36.47 | 40.75 | 46.41 | 51.33 | P/E (x) | 229.1 | 88.1 | 44.6 | 29.0 |
| y/y Growth | (3.7%) | 11.7% | 13.9% | 10.6% | P/BV (x) | 5.2 | 4.7 | 4.1 | 3.7 |
| Net debt/(cash) | (2,272) | (6,352) | (7,303) | EV/EBITDA (x) | 64.4 | 67.1 | 26.5 | 17.4 | |
| (1,737) | Dividend Yield | 0.4% | 0.3% | 0.5% | 0.9% |
Source: Company reports and J.P. Morgan estimates.
Note: HK$ in millions (except per-share data).Fiscal year ends Dec. o/w - out of which
request.
ASMPT Ltd (0522) (0522.HK, 522 HK) Price Chart
OW HK$90
N HK$76
OW HK$175
Asia Pacific Equity Research 15 July 2026
N HK$58
OW HKS125
J.P. Morgan
OW HK$115
Gokul Hariharan AC (852) 2800-8564 gokul.hariharan@jpmorgan.com
250
Price(HK$)
200
150
Da
26
26-
08
24.
25
27
01
23
30
Analyst Certification: The Research Analyst(s) denoted by an 'AC' on the cover of this report certifies (or, where multiple Research Analysts are primarily responsible for this report, the Research Analyst denoted by an 'AC' on the cover or within the document individually certifies, with respect to each security or issuer that the Research Analyst covers in this research) that: (1) all of the views expressed in this report accurately reflect the Research Analyst's personal views about any and all of the subject securities or issuers; and (2) no part of any of the Research Analyst's compensation was, is, or will be directly or indirectly related to the specific recommendations or views expressed by the Research Analyst(s) in this report. For all Korea-based Research Analysts listed on the front cover, if applicable, they also certify, as per KOFIA requirements, that the Research Analyst's analysis was made in good faith and that the views reflect the Research Analyst's own opinion, without undue influence or intervention.
All authors named within this report are Research Analysts who produce independent research unless otherwise specified. In Europe, Sector Specialists (Sales and Trading) may be shown on this report as contacts but are not authors of the report or part of the Research Department.