PDF 原檔:報告_HSBC_緯穎6669_20260721_original.pdf
圖片清單(已驗證 2026-07-22)
| 檔名 | size | 分類 | 親眼所見內容 |
|---|---|---|---|
報告_HSBC_緯穎6669_20260721_003.png |
42KB | 真資料圖 | Exhibit 2. Wiwynn Forward PE band 圖:股價(紅線)與 6x/9x/12x/15x/18x 本益比帶,Mar-19 至 Mar-25+ |
001(22KB)、002(36KB)、004(31KB)、005(33KB)均 <40KB 未 Read,預設 logo/裝飾(52-week price 小圖、price relative 小圖等)。
原始內容
Wiwynn Corporation (6669 TT)
Buy: Better growth visibility into 2027
- ◆ 2Q26 preview: we expect margin to improve thanks to a more favorable mix and procurement agency measures
- ◆ 2H26 momentum accelerating with multiple new AI projects in the pipeline in 2027 driving earnings
- ◆ TP to TWD8,400 from TWD6,400 implies c68% upside; Buy
2Q26 results preview: Wiwynn's 2Q26 reported revenue was TWD 278bn, +1% q-o-q and +26% y-o-y, in line with HSBCe and consensus. In 2Q26, we observed a favorable product mix toward both general servers as well as the procurement agency (also dedicated for general server projects) adopted since April (highlighted in our previous note, AI and general server growth outlook still intact , 8 May 2026). Hence, we now expect margins to see an improvement q-o-q. We estimate its 2Q26 OPM to be c6.5% (q-o-q+22bps), vs. Bloomberg estimates of c6.8%.
Stronger momentum in 2H26-2027 driven by AI revenue: Amazon remains the key driver in 2H26-2027e. We see the Amazon Web Services (AWS) Trainium 3 volume start a meaningful increase in 3Q26 followed by an initial volume of liquid cooling racks in late 2026. We think the AWS liquid-cooled rack shipment will pick up in 2027. There is also next generation Trainium 4 server architecture currently being developed, which we expect to adopt a more complex liquid-cooling and higher chip density architecture vs. current 72-chip/rack design. Nonetheless, we expect limited margin dilution from the highdensity rack projects given the increasing design complexity. Beyond AWS, AMD's Helios platform provides another growth pillar beginning 4Q26 with increasing contribution from two major customers in 2027. W e now forecast Wiwynn's ASIC/GPU server revenue to account for c54%/c25% in 2027, respectively, driving total sales to grow by c102% y-o-y.
General server softness in 3Q26 but stronger growth visibility in 2027: We expect a temporary deceleration in general server shipment due to CPU migration to AMD Venice in 3Q26; this should be offset by the strength of AWS ramp up. Thus, we still expect 3Q26 revenue to increase by 21% q-o-q. We reiterate our view that general server demand will pick up significantly (see Agentic AI is reshaping the server market , 5 Mar 2026), and we continue to observe longer growth visibility for both Intel and AMD x86 servers. We estimate general server shipment to grow by c48%/c20% in 2026/2027, respectively.
Maintain Buy and raise TP to TWD8,400: We raise 2027e EPS by c23% to reflect the strong demand outlook. Our 2027e EPS is c28% above Bloomberg consensus. We roll over the valuation base to 2027e given that we are in July. We apply a target PE multiple of 14x, based on 0.5SD above 2019-2025 average PE, to our 2027e EPS of TWD600.08 (from 2026e of TWD353.17), deriving a rounded TP of TWD8,400 (from TWD6,400). We think the target PE multiple is justified as we estimate a 2026-28 EPS CAGR of 48%, higher than the 2019-25 EPS CAGR of 41%. Our TP implies c68% upside, and therefore we maintain our Buy rating.
Disclosures & Disclaimer
This report must be read with the disclosures and the analyst certifications in the Disclosure appendix, and with the Disclaimer, which forms part of it.
Equities Computers & Peripherals
Taiwan
MAINTAIN BUY
TARGET PRICE (TWD)
PREVIOUS TARGET (TWD)
8400.00
6400.00
SHARE PRICE (TWD)
UPSIDE/DOWNSIDE
5000.00
+68.0%
(as of 21 Jul 2026)
MARKET DATA
| Market cap (TWDm) | 929,204 | Free float | 40% |
|---|---|---|---|
| Market cap (USDm) | 28,772 | BBG | 6669 TT |
| 3m ADTV (USDm) | 346 | RIC | 6669.TW |
FINANCIALS AND RATIOS (TWD)
| Year to | 12/2025a | 12/2026e | 12/2027e | 12/2028e |
|---|---|---|---|---|
| HSBC EPS | 275.06 | 348.39 | 600.08 | 763.97 |
| HSBC EPS (prev) | 275.06 | 353.17 | 488.41 | 648.01 |
| Change (%) | 0 | -1.4 | 22.9 | 17.9 |
| Consensus EPS | 273.61 | 345.76 | 469.63 | 563.82 |
| PE (x) | 18.2 | 14.4 | 8.3 | 6.5 |
| Dividend yield (%) | 2.9 | 3.7 | 6.3 | 8.1 |
| EV/EBITDA (x) | 14.1 | 10.4 | 6.5 | 5.2 |
| ROE (%) | 48 | 45.1 | 55.4 | 50.4 |
52-WEEK PRICE (TWD)
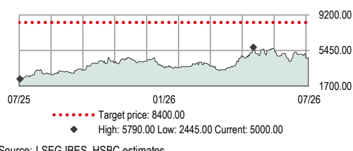
Source: LSEG IBES, HSBC estimates
Carol Juan*
Analyst, Technology
HSBC Securities (Taiwan) Corporation Limited carol.cc.juan@hsbc.com.tw +886 2 6631 2862
Lorraine Ou*
Research Associate
HSBC Securities (Taiwan) Corporation Limited lorraine.yt.ou@hsbc.com.tw +886 2 6631 2867
- Employed by a non-US affiliate of HSBC Securities (USA) Inc, and is not registered/ qualified pursuant to FINRA regulations
No country for bears
The 24 th edition of the EM Sentiment Survey
Click to view
Issuer of report: HSBC Securities (Taiwan) Corporation Limited
View HSBC Global Investment Research at:
Financials & valuation: Wiwynn Corporation
Financial statements
| Year to | 12/2025a | 12/2026e | 12/2027e | 12/2028e |
|---|---|---|---|---|
| Profit & loss summary (TWDm) | ||||
| Revenue | 950,663 | 1,305,949 | 2,633,098 | 3,402,845 |
| EBITDA | 66,610 | 88,995 | 153,259 | 194,374 |
| Depreciation & amortisation | -2,692 | -3,957 | -5,894 | -7,453 |
| Operating profit/EBIT | 63,918 | 85,038 | 147,365 | 186,921 |
| Net interest | -2,113 | -2,883 | -2,635 | -2,635 |
| PBT | 66,052 | 83,688 | 144,831 | 184,386 |
| HSBC PBT | 66,052 | 83,688 | 144,831 | 184,386 |
| Taxation | -14,934 | -18,943 | -33,311 | -42,409 |
| Net profit | 51,118 | 64,744 | 111,520 | 141,977 |
| HSBC net profit | 51,118 | 64,744 | 111,520 | 141,977 |
| Cash flow summary (TWDm) | ||||
| Cash flow from operations | -624 | 48,816 | -29,042 | 52,160 |
| Capex | -13,674 | -10,000 | -10,000 | -10,000 |
| Cash flow from investment | -13,766 | -10,038 | -10,038 | -10,038 |
| Dividends | -13,752 | -26,947 | -34,130 | -58,788 |
| Change in net debt | 30,448 | -11,869 | 73,172 | 16,628 |
| FCF equity | -14,299 | 38,816 | -39,042 | 42,160 |
| Balance sheet summary (TWDm) | ||||
| Intangible fixed assets | 174 | 229 | 229 | 229 |
| Tangible fixed assets | 20,848 | 26,893 | 31,002 | 33,551 |
| Current assets | 306,977 | 373,881 | 543,117 | 700,609 |
| Cash & others | 89,934 | 101,803 | 28,631 | 12,003 |
| Total assets | 337,467 | 411,138 | 584,483 | 744,525 |
| Operating liabilities | 113,355 | 148,506 | 244,462 | 321,313 |
| Gross debt | 100,182 | 100,182 | 100,182 | 100,182 |
| Net debt | 10,248 | -1,621 | 71,551 | 88,179 |
| Shareholders' funds | 124,653 | 162,450 | 239,840 | 323,030 |
| Invested capital | 124,711 | 150,694 | 301,256 | 401,074 |
Ratio, growth and per share analysis
| Year to | 12/2025a | 12/2026e | 12/2027e | 12/2028e |
|---|---|---|---|---|
| Y-o-y %change | ||||
| Revenue | 163.7 | 37.4 | 101.6 | 29.2 |
| EBITDA | 121.3 | 33.6 | 72.2 | 26.8 |
| Operating profit | 127.5 | 33.0 | 73.3 | 26.8 |
| PBT | 129.1 | 26.7 | 73.1 | 27.3 |
| HSBC EPS | 117.3 | 26.7 | 72.2 | 27.3 |
| Ratios (%) | ||||
| Revenue/IC (x) | 10.3 | 9.5 | 11.7 | 9.7 |
| ROIC | 53.5 | 47.8 | 50.2 | 41.0 |
| ROE | 48.0 | 45.1 | 55.4 | 50.4 |
| ROA | 20.3 | 18.1 | 23.0 | 21.8 |
| EBITDA margin | 7.0 | 6.8 | 5.8 | 5.7 |
| Operating profit margin | 6.7 | 6.5 | 5.6 | 5.5 |
| EBITDA/net interest (x) | 31.5 | 30.9 | 58.2 | 73.8 |
| Net debt/equity | 8.2 | -1.0 | 29.8 | 27.3 |
| Net debt/EBITDA (x) | 0.2 | -0.0 | 0.5 | 0.5 |
| Per share data (TWD) | ||||
| EPS Rep (diluted) | 275.06 | 348.39 | 600.08 | 763.97 |
| HSBC EPS (diluted) | 275.06 | 348.39 | 600.08 | 763.97 |
| DPS | 145.00 | 183.65 | 316.33 | 402.73 |
| Book value | 670.75 | 874.14 | 1290.56 | 1738.20 |
Valuation data
| Year to | 12/2025a | 12/2026e | 12/2027e | 12/2028e |
|---|---|---|---|---|
| EV/sales | 1 | 0.7 | 0.4 | 0.3 |
| EV/EBITDA | 14.1 | 10.4 | 6.5 | 5.2 |
| EV/IC | 7.5 | 6.1 | 3.3 | 2.5 |
| PE* | 18.2 | 14.4 | 8.3 | 6.5 |
| PB | 7.5 | 5.7 | 3.9 | 2.9 |
| FCF yield (%) | -1.5 | 4.2 | -4.2 | 4.5 |
| Dividend yield (%) | 2.9 | 3.7 | 6.3 | 8.1 |
ESG metrics
1.1
2.2
n/a n/a
No
| Environmental Indicators | 12/2025a |
|---|---|
| GHG emission intensity* | 1.1 |
| Energy intensity* | 2.2 |
| CO 2 reduction policy | Yes |
| Social Indicators | 12/2025a |
| Employee costs as %of revenues | n/a |
| Employee turnover (%) | n/a |
| Diversity policy | No |
Source: Company data, HSBC
- GHG intensity and energy intensity are measured in kg and kWh respectively against revenue in USD '000s
Issuer information
| Share price (TWD) | 5000.00 |
|---|---|
| Target price (TWD) | 8400.00 |
| RIC (Equity) | 6669.TW |
| Bloomberg (Equity) | 6669 TT |
| Market cap (USDm) | 28,772 |
Price relative
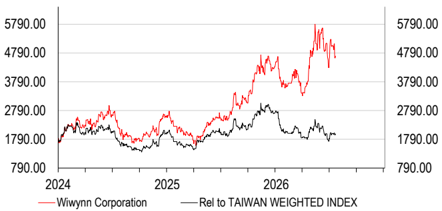
Source: HSBC
Note: Priced at close of 21 Jul 2026
Buy
9
| Governance Indicators | 12/2025a |
|---|---|
| No. of board members | 9 |
| Average board tenure (years) | n/a |
| Female board members (%) | 22.2 |
| Board members independence (%) | 44.4 |
| Free float | 40% |
|---|---|
| Sector | Computers & Peripherals |
| Country/Region | Taiwan |
| Analyst | Carol Juan |
| Contact | +886 2 6631 2862 |
Exhibit 1. Wiwynn -Estimate changes
| _ | New ___ | New ___ | __ Old ___ | __ Old ___ | __ Old ___ | __ Change __ | __ Change __ | __ Change __ | HSBC vs Consensus | HSBC vs Consensus | HSBC vs Consensus | __Bloomberg ____ | __Bloomberg ____ | __Bloomberg ____ | |
|---|---|---|---|---|---|---|---|---|---|---|---|---|---|---|---|
| (TWDm) | 2026e | 2027e | 2028e | 2026e | 2027e | 2028e | 2026e | 2027e | 2028e | 2026e | 2027e | 2028e | 2026e | 2027e | 2028e |
| Sales | 1,305,949 | 2,633,098 | 3,402,845 | 1,265,342 | 1,933,177 | 2,723,538 | 3% | 36% | 25% | 2% | 31% | 42% 1,285,113 2,015,632 2,398,760 | 42% 1,285,113 2,015,632 2,398,760 | 42% 1,285,113 2,015,632 2,398,760 | 42% 1,285,113 2,015,632 2,398,760 |
| - y-o-y chg. | 37.4% | 101.6% | 29.2% | 33.1% | 52.8% | 40.9% | 35.2% | 56.8% | 19.0% | ||||||
| Gross profits | 102,637 | 176,942 | 225,544 | 103,311 | 149,560 | 200,357 | -1% | 18% | 13% | 0% | 26% | 35% | 102,655 | 140,852 | 167,457 |
| - GM | 7.9% | 6.7% | 6.6% | 8.2% | 7.7% | 7.4% | 8.0% | 7.0% | 7.0% | ||||||
| Operating profits | 85,038 | 147,365 | 186,921 | 86,219 | 120,449 | 158,970 | -1% | 22% | 18% | 1% | 27% | 35% | 84,043 | 116,064 | 138,336 |
| - OPM | 6.5% | 5.6% | 5.5% | 6.8% | 6.2% | 5.8% | 6.5% | 5.8% | 5.8% | ||||||
| Net income | 64,744 | 111,520 | 141,977 | 65,634 | 90,767 | 120,428 | -1% | 23% | 18% | -2% | 25% | 31% | 66,064 | 89,512 | 108,345 |
| EPS (TWD) | 348.39 | 600.08 | 763.97 | 353.17 | 488.41 | 648.01 | -1% | 23% | 18% | 0% | 28% | 35% | 349.72 | 469.02 | 567.96 |
| - y-o-y chg. | 26.7% | 72.2% | 27.3% | 28.4% | 38.3% | 32.7% | 27.1% | 34.1% | 21.1% |
Source: Bloomberg, HSBC estimates
Exhibit 2. Wiwynn -Forward PE band
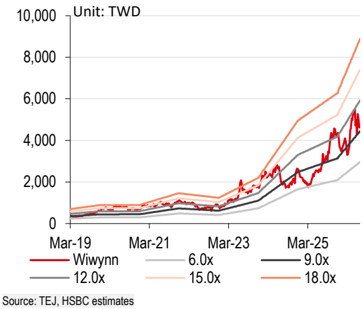
Exhibit 4. Wiwynn -Quarterly earnings estimates
| TWDm | 2025 | 1Q26 | 2Q26e | 3Q26e | 4Q26e | 2026e | 1Q27e | 2Q27e | 3Q27e | 4Q27e | 2027e | 2028e |
|---|---|---|---|---|---|---|---|---|---|---|---|---|
| Revenue | 950,663 | 276,508 | 278,152 | 336,501 | 414,789 | 1,305,949 | 447,364 | 625,426 | 737,414 | 822,893 | 2,633,098 | 3,402,845 |
| Gross profits | 78,454 | 20,881 | 22,766 | 27,714 | 31,275 | 102,637 | 31,860 | 40,839 | 48,648 | 55,596 | 176,942 | 225,544 |
| Operating profits | 63,918 | 17,458 | 18,177 | 23,104 | 26,298 | 85,038 | 26,514 | 33,771 | 40,536 | 46,544 | 147,365 | 186,921 |
| Non-op income | 2,135 | 476 | -559 | -609 | -659 | -1,350 | -659 | -659 | -559 | -659 | -2,535 | -2,535 |
| Pre-tax income | 66,052 | 17,934 | 17,618 | 22,496 | 25,639 | 83,688 | 25,855 | 33,113 | 39,978 | 45,885 | 144,831 | 184,386 |
| Net income | 51,118 | 14,114 | 13,566 | 17,322 | 19,742 | 64,744 | 19,908 | 25,497 | 30,783 | 35,332 | 111,520 | 141,977 |
| EPS (TWD) | 275.06 | 75.95 | 73.00 | 93.21 | 106.23 | 348.39 | 107.13 | 137.20 | 165.64 | 190.12 | 600.08 | 763.97 |
| Ratios | ||||||||||||
| GPM | 8.3% | 7.6% | 8.2% | 8.2% | 7.5% | 7.9% | 7.1% | 6.5% | 6.6% | 6.8% | 6.7% | 6.6% |
| OPM | 6.7% | 6.3% | 6.5% | 6.9% | 6.3% | 6.5% | 5.9% | 5.4% | 5.5% | 5.7% | 5.6% | 5.5% |
| NM | 5.4% | 5.1% | 4.9% | 5.1% | 4.8% | 5.0% | 4.5% | 4.1% | 4.2% | 4.3% | 4.2% | 4.2% |
| QoQ | ||||||||||||
| Revenue | -5% | 1% | 21% | 23% | 8% | 40% | 18% | 12% | ||||
| Gross profits | -1% | 9% | 22% | 13% | 2% | -60% | 53% | 36% | ||||
| Operating profits | 6% | 4% | 27% | 14% | 1% | -60% | 53% | 38% | ||||
| Net income | 2% | -4% | 28% | 14% | 1% | -61% | 55% | 39% | ||||
| YoY | ||||||||||||
| Revenue | 164% | 62% | 26% | 26% | 42% | 37% | 62% | 125% | 119% | 98% | 102% | 29% |
| Gross profits | 110% | 41% | 20% | 18% | 48% | 31% | 53% | 79% | 76% | 78% | 72% | 27% |
| Operating profits | 127% | 46% | 14% | 18% | 60% | 33% | 52% | 86% | 75% | 77% | 73% | 27% |
| Net income | 124% | 44% | 12% | 12% | 43% | 27% | 41% | 88% | 78% | 79% | 72% | 27% |
Source: Company data. HSBC estimates
Exhibit 3. Wiwynn -Forward PE trend
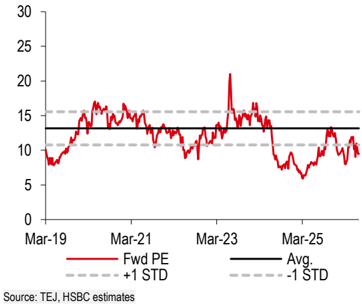
Exhibit 5. US cloud service provider (CSP) capex outlook
| CSP | Capex and datacentre expansion plan highlights |
|---|---|
| Microsoft | - CY26 capex guidance is USD190bn, implying 61% y-o-y, including an additional spending of USD25bn from component price hikes to get the capacity ready as soon as possible. |
| Amazon | - 2026 capex guidance was largely unchanged. The expected spending is USD200bn, up 52% y-o-y. - The company expects to invest a significant amount of money over the next few years. |
| Alphabet | - 2026 capex guidance raised to USD180-190bn, from USD175-185bn previously. - The company expects 2027 capex to significantly increase. |
| Meta Platforms | - 2026 capex guidance was raised to USD125-145bn, from USD115-135bn previously. - The increase is primarily attributed to expectation for higher component pricing, particularly memory pricing, and to a lesser extent, additional data centre costs to support future year capacity. |
Source: Company data, HSBC. Share prices below are at close on 7 May 2026
1 Microsoft (MSFT US, USD402.29, Buy) is covered by Stephen Bersey | HSBC Securities (USA) Inc | Analyst | Stephen.bersey@us.hsbc.com | +1 212 525 4153
2 Amazon (AMZN US, USD249.99, Buy) is covered by Paul Rossington*| HSBC Bank plc | Analyst | paul.rossington@hsbcib.com| +44 20 7991 6734
3 Alphabet (GOOGL US, USD351.99, Buy) is covered by Paul Rossington*| HSBC Bank plc | Analyst | paul.rossington@hsbcib.com| +44 20 7991 6734
4 Meta Platforms (META US, USD645.85, Buy) is covered by Nicolas Cote-Colisson* | HSBC Bank plc | Analyst | nicolas.cote-colisson@hsbcib.com | +44 20 7991 6826
- Employed by a non-US affiliate of HSBC Securities (USA) Inc, and is not registered/ qualified pursuant to FINRA regulations
Exhibit 6. US CSP capex guidance revision
| Capex USD bn | CY2023 Actual | CY2024 Actual | CY2025 Actual | CY2026 Guidance | Change*% |
|---|---|---|---|---|---|
| 15.66 | 52.54 | 91.45 | 185.00 | 0% | |
| YoY | 235.5% | 74.1% | 102.3% | ||
| Microsoft | 41.20 | 75.60 | 118.00 | 190.00 | 0% |
| YoY | 83.5% | 56.1% | 61.0% | ||
| Amazon | 52.73 | 83.00 | 131.82 | 200.00 | 0% |
| YoY | 57.4% | 58.8% | 51.7% | ||
| Meta | 27.27 | 37.26 | 69.69 | 135.00 | 0% |
| YoY | 36.6% | 87.1% | 93.7% | ||
| Total | 136.85 | 248.39 | 410.96 | 710.00 | 0% |
| YoY | 81.5% | 65.4% | 72.8% |
Source: Bloomberg, HSBC; *Note: percentage of guidance revision vs. last quarter Capex guidance range
| Valuation | Risks to our view | |
|---|---|---|
| Wiwynn 6669 TT Buy | We raise 2027e EPS by c23% to reflect the strong demand outlook. Our 2027e EPS is c28% above Bloomberg consensus. We roll over the valuation base to 2027e (from 2026e) given that we are now halfway through 2026.We apply a target PE multiple of 14x, based on 0.5SD above 2019-2025 average PE (previously 18x (based on the 1SD above 2019-23 average)), to our 2027e EPS of TWD600.08 (from 2026e of TWD353.17), deriving a rounded TP of TWD8,400 (from TWD6,400). Weapply a 0.5SD | Downside risks: (1) Weaker-than-expected demand for global servers; (2) lower NRE contribution from fewer design wins for new server projects; and (3) longer transition period of ASIC servers. |
Valuation and risks
Priced at 21 Jul 2026 Source: HSBC estimates