PDF 原檔:報告_GS_雙鴻3324_20260815_original.pdf
圖片清單(已驗證 2026-08-17)
| 檔名 | size | 分類 | 親眼所見內容 |
|---|---|---|---|
260815_gs_auras_001.png |
27KB | 真資料圖 | Exhibit 4:散熱同業 2027E PE vs. 2027-28E NI YoY 散佈圖(Vertiv、Envicool、AVC、FII、Hon Hai),含迴歸線 y=38.532x+8.141、R²=0.5788 |
260815_gs_auras_002.png |
45KB | 真資料圖 | Exhibit 6:雙鴻淨利(深藍柱狀,NT$mn,2017–2028E)與 OPM(淺藍折線,右軸)趨勢圖,標註 2025-28E CAGR 48% |
260815_gs_auras_003.png |
75KB | 真資料圖 | Exhibit 5:雙鴻 12 個月前瞻本益比走勢圖(2013–2026),標示 +1stv 29x/avg 18x/-1stv 8x 區間,最新落點約 29x |
260815_gs_auras_004.png |
50KB | 真資料圖 | Exhibit 7:雙鴻 QFII 持股比例走勢圖(2013 年初至 2026 年中),近期兩次觸及 29%(起點約 0.2%) |
260815_gs_auras_005.png |
97KB | 真資料圖 | GS Forecast 資料卡:Buy 評等、12m 目標價 NT$1,353、現價 NT$1,010(+34.0% upside)、市值/EV/ADTV,及 2025-28E 營收/EBITDA/EPS/P/E/P/B/殖利率/CROCI 預估表 |
260815_gs_auras_006.png |
80KB | 真資料圖 | 雙鴻股價(灰線,右軸台灣加權指數)疊加 GS 評等與歷次目標價沿革圖(藍點標示 1146/1005/975/962/894/791/893/727/825/1177/1158/784/1118/1283 等歷史目標價),2023–2026 |
原始內容
For the exclusive use of KEVINLU@LENOVO.COM
Auras (3324.TWO): Liquid cooling components ride on AI server ramp up and dollar content increase; New products ramping up in 2H26E; Buy
Auras' Jul revenue was up 117% YoY / 39% MoM, driven by AI server liquid and air cooling components. We expect revenues in 3Q26 / 4Q26 to grow at +19% / 6% QoQ, driven by next-generation GPU and ASIC AI servers, higher liquid cooling component dollar content, growing AI infrastructure trend, rising penetration of liquid-cooled AI servers as computing density increases, and Auras' capacity expansion, supporting the company to better capture rising demand. Maintain Buy.
Exhibit 1: Auras monthly revenue preview
| Jul-26 | Aug-26 (E) | Sep-26 (E) | Oct-26 (E) | Nov-26 (E) | Dec-26 (E) | 3Q26E | 4Q26E | |
|---|---|---|---|---|---|---|---|---|
| Rev (NT$m) | 3,765 | 3,257 | 3,310 | 3,409 | 3,614 | 3,947 | 10,332 | 10,970 |
| YoY | 117% | 73% | 41% | 46% | 48% | 40% | 73% | 44% |
| MoM/QoQ | 39% | -14% | 2% | 3% | 6% | 9% | 19% | 6% |
| GS (NT$m) vs. | ||||||||
| Actual GS |
Source: Company data, Goldman Sachs Global Investment Research
2Q26 miss: Auras' 2Q26 revenue was largely in line with our estimate and Bloomberg consensus, while GM was QoQ down, which we attribute to the trial production of new liquid cooling components for next-generation ASIC and GPU AI servers. Despite the GM miss in 2Q26, we expect GM to improve in 2H26 driven by better product mix toward liquid cooling components. 2Q26 opex ratio was lower than our estimate, re fl ecting operational e ffi ciency improvement; along with higher than expected tax expense, this led 2Q26 net income to come in 23% / 21% below our estimate / Bloomberg consensus.
Exhibit 2: 2Q26 result snapshot
| NT$m | 2Q25 | 1Q26 | 2Q26 | QoQ | YoY | GS | Act / GS | Cons. | Act / Cons. |
|---|---|---|---|---|---|---|---|---|---|
| Revenues | 5,306 | 8,552 | 8,700 | 2% | 64% | 9,108 | -4% | 8,815 | -1% |
| GP | 1,387 | 2,537 | 2,472 | -3% | 78% | 2,800 | -12% | 2,585 | -4% |
| OP | 633 | 1,521 | 1,390 | -9% | 120% | 1,580 | -12% | 1,588 | -12% |
| Net income | 158 | 1,164 | 969 | -17% | 513% | 1,257 | -23% | 1,232 | -21% |
| Margins | |||||||||
| GM | 26.1% | 29.7% | 28.4% | 30.7% | 29.3% | ||||
| OPM | 11.9% | 17.8% | 16.0% | 17.3% | 18.0% | ||||
| NM | 3.0% | 13.6% | 11.1% | 13.8% | 14.0% |
Source: Company data, Goldman Sachs Global Investment Research, Bloomberg
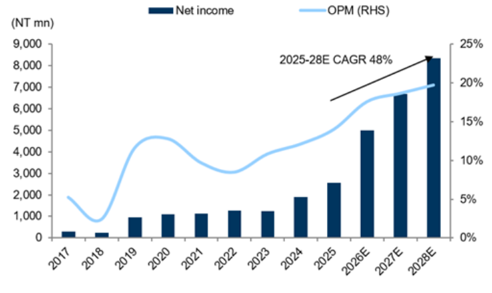
Earnings revision: We factor in Auras' Jul revenue and 2Q26 result and raise our 2026-28E revenues by 5% / 7% / 11%, mainly on higher AI server liquid cooling component shipments, bene fi ting from the rising liquid cooling solution penetration rate and dollar content increase in AI servers. We slightly cut our 2026E GM to re fl ect the impact of trail production in 2Q26 and keep our 2027-28E GMs largely unchanged. Our estimates still show a GM uptrend in coming years, re fl ecting our
Goldman Sachs does and seeks to do business with companies covered in its research reports. As a result, investors should be aware that the fi rm may have a con fl ict of interest that could a ff ect the objectivity of this report. Investors should consider this report as only a single factor in making their investment decision. For Reg AC certi fi cation and other important disclosures, see the Disclosure Appendix, or go to ed as research www.gs.com/research/hedge.html. Analysts employed by non-US a ffi liates are not registered/quali fi analysts with FINRA in the U.S.
Verena Jeng
+852-2978-1681 | verena.jeng@gs.com Goldman Sachs (Asia) L.L.C.
Allen Chang
+852-2978-2930 | allen.k.chang@gs.com Goldman Sachs (Asia) L.L.C.
Yifan Hu
+852-2978-0996 | yifan.hu@gs.com Goldman Sachs (Asia) L.L.C.
e92c7a75ab8b4efbba794e6b187208c8
40
(NT mn)
35
9,000
8,000
30
7,000
6,000
- 25
$ 20
5,000
4,000
3,000
10
2,000
1,000
5
0
0%
For the exclusive use of KEVINLU@LENOVO.COM
x
10%
2018
• Hon Hai|
20%
• Vertiv
• FII
30%
40%
2027-28E NI YoY
2024
-OPM (RHS)
• Envicool
25%
Exmoll o. Aulas lem lorwarurciauu
Camor lo hulas Criteramo
35
60 x
%61
30
50
positive view that Auras' product mix upgrade toward AI server liquid cooling will drive margin expansion. Our 2026-28E opex ratios are slightly revised down, mainly on higher revenue scale, along with higher tax rates, leading our 2026-28E net income estimates to -3% / +1% / +7%. 20 10
10
Exhibit 3: Earnings revision
50%
| 2026E | 2026E | 2026E | 2027E | 2027E | 2027E | 2028E | 2028E | 2028E | |
|---|---|---|---|---|---|---|---|---|---|
| NT$m | Old | New | Diff% | Old | New | Diff% | Old | New | Diff% |
| Revenues | 36,706 | 38,554 | 5% | 44,329 | 47,531 | 7% | 50,121 | 55,499 | 11% |
| GP | 11,410 | 11,459 | 0% | 13,939 | 14,809 | 6% | 15,937 | 17,695 | 11% |
| OP | 6,511 | 6,781 | 4% | 8,289 | 8,868 | 7% | 9,772 | 10,952 | 12% |
| Net income | 5,180 | 4,999 | -3% | 6,603 | 6,678 | 1% | 7,790 | 8,332 | 7% |
| Margins | |||||||||
| GM | 31.1% | 29.7% | 31.4% | 31.2% | 31.8% | 31.9% | |||
| OPM | 17.7% | 17.6% | 18.7% | 18.7% | 19.5% | 19.7% | |||
| NM | 14.1% | 13.0% | 14.9% | 14.0% | 15.5% | 15.0% |
Source: Goldman Sachs Global Investment Research
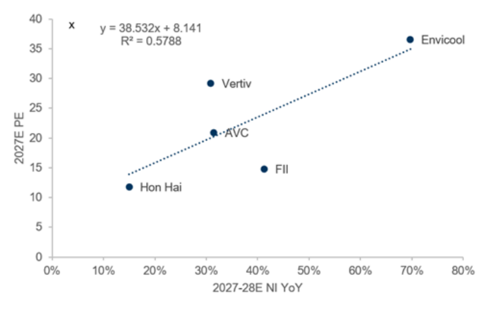
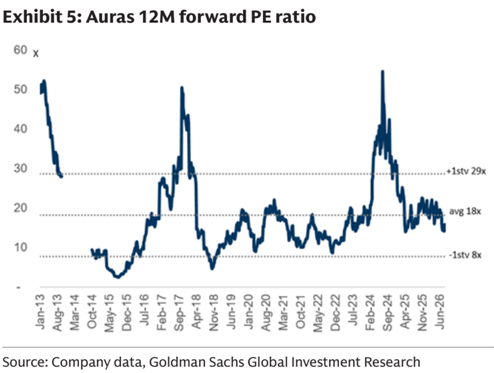
Valuation: We continue to use near-term P/E to derive target price and update our 2027E target P/E to 19.4x (vs. 17.9x previously), mainly on higher 2027-28E net income growth. Our target P/E is still derived from peers' correlation between trading P/E vs. forward year NI YoY. With the updated target P/E and earnings estimates, our 12M TP is raised to NT$1,353 (vs. NT$1,283 previously). Our new TP implied P/E is at 19.4x, still in line with the company's trading P/E avg. Maintain Buy.
Exhibit 4: Peers 2027E PE vs. 2027-28E NI YoY
Source: Company data, Goldman Sachs Global Investment Research
Exhibit 6: Auras net income and OPM trend
Source: Company data, Goldman Sachs Global Investment Research
Source: Company data, Goldman Sachs Global Investment Research
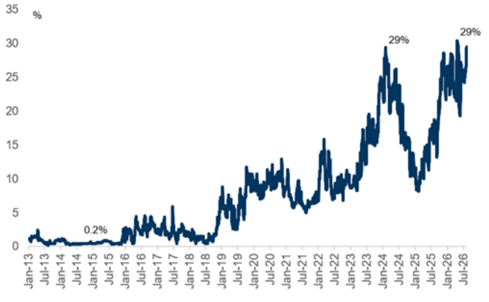
Exhibit 7: Auras QFII holdings
Source: TEJ
29%
e92c7a75ab8b4efbba794e6b187208c8
For the exclusive use of KEVINLU@LENOVO.COM
Exhibit 8: Auras P&L summary
| NT$m | 2022 | 2023 | 2024 | 2025 | 2026E | 2027E | 2028E | 1Q25 | 2Q25 | 3Q25 | 4Q25 | 1Q26 | 2Q26 | 3Q26E | 4Q26E |
|---|---|---|---|---|---|---|---|---|---|---|---|---|---|---|---|
| Income statement | |||||||||||||||
| Revenue | 13,857 | 12,713 | 15,779 | 23,276 | 38,554 | 47,531 | 55,499 | 4,415 | 5,306 | 5,958 | 7,597 | 8,552 | 8,700 | 10,332 | 10,970 |
| Gross profit | 2,722 | 3,005 | 4,026 | 6,372 | 11,459 | 14,809 | 17,695 | 1,208 | 1,387 | 1,773 | 2,004 | 2,537 | 2,472 | 3,114 | 3,336 |
| OP income | 1,174 | 1,376 | 1,911 | 3,261 | 6,781 | 8,868 | 10,952 | 564 | 633 | 994 | 1,069 | 1,521 | 1,390 | 1,863 | 2,007 |
| Net income | 1,264 | 1,232 | 1,893 | 2,572 | 4,999 | 6,678 | 8,332 | 511 | 158 | 974 | 929 | 1,164 | 969 | 1,381 | 1,485 |
| EPS, diluted (NT$) | 13.90 | 13.53 | 20.54 | 27.33 | 52.19 | 69.72 | 86.98 | 5.45 | 1.73 | 10.33 | 9.82 | 12.15 | 10.12 | 14.41 | 15.51 |
| Margins | |||||||||||||||
| Gross margin | 19.6% | 23.6% | 25.5% | 27.4% | 29.7% | 31.2% | 31.9% | 27.4% | 26.1% | 29.8% | 26.4% | 29.7% | 28.4% | 30.1% | 30.4% |
| Operating margin | 8.5% | 10.8% | 12.1% | 14.0% | 17.6% | 18.7% | 19.7% | 12.8% | 11.9% | 16.7% | 14.1% | 17.8% | 16.0% | 18.0% | 18.3% |
| Net margin | 9.1% | 9.7% | 12.0% | 11.1% | 13.0% | 14.0% | 15.0% | 11.6% | 3.0% | 16.3% | 12.2% | 13.6% | 11.1% | 13.4% | 13.5% |
| Ratios | |||||||||||||||
| Opex ratio | -11% | -13% | -13% | -13% | -12% | -13% | -12% | -15% | -14% | -13% | -12% | -12% | -12% | -12% | -12% |
| Tax rate | 21% | 21% | 18% | 18% | 21% | 21% | 21% | 21% | 22% | 15% | 18% | 19% | 21% | 21% | 21% |
| YoY | |||||||||||||||
| Revenue | -3% | -8% | 24% | 48% | 66% | 23% | 17% | 40% | 24% | 41% | 84% | 94% | 64% | 73% | 44% |
| Gross profit | 2% | 10% | 34% | 58% | 80% | 29% | 19% | 57% | 14% | 60% | 116% | 110% | 78% | 76% | 66% |
| OP income | -15% | 17% | 39% | 71% | 108% | 31% | 23% | 71% | -8% | 83% | 205% | 170% | 120% | 87% | 88% |
| Net income | 12% | -3% | 54% | 36% | 94% | 34% | 25% | 29% | -75% | 145% | 99% | 128% | 513% | 42% | 60% |
| QoQ | |||||||||||||||
| Revenue | 7% | 20% | 12% | 28% | 13% | 2% | 19% | 6% | |||||||
| Gross profit | 30% | 15% | 28% | 13% | 27% | -3% | 26% | 7% | |||||||
| OP income | 61% | 12% | 57% | 8% | 42% | -9% | 34% | 8% | |||||||
| Net income | 9% | -69% | 516% | -5% | 25% | -17% | 42% | 8% |
Source: Company data, Goldman Sachs Global Investment Research
Price Target Risks and Methodology - Auras
Our 12m target price for Auras is based on a near-term P/E, consistent with our Taiwan Technology coverage. We base our 12-m TP of NT$1,353 on a target P/E multiple of 19.4x forward year EPS (2027E). Our target P/E is derived from the correlation between P/E and EPS growth of its peers in technology hardware, based on the company's 2027E-28E EPS YoY growth at 23%. Key downside risks: 1) Slower-than-expected liquid cooling penetration; (2) Soft AI server demand; (3) Weaker-than-expected PC market; and (4) Potential competition from existing and new suppliers.
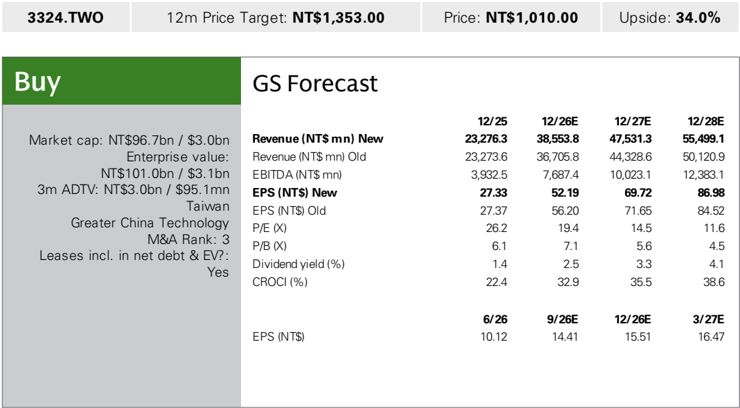
| 3324.TWO | 12m Price Target: NT$1,353.00 | Price: NT$1,010.00 | Upside: 34.0% | Upside: 34.0% |
|---|---|---|---|---|
| Buy | Buy | |||
| Market c ap: NT$96.7b n / $ 3 . 0 b n En terpr is e v a lu e: NT$ 101 . 0 b n / $ 3 . 1 b n 3m AD T V : NT$ 3 . 0 b n / $9 5 . 1mn Ta iw a n G reater Chin a Te chnology M &A R a n k: 3 L ea s e s incl . in n et d ebt & EV? : Y e s | Revenue (NT$m n ) N e w Revenue (NT$ mn) Old EBITDA (NT$ mn) E PS(NT$) N e w EPS (NT$) Old P/E (X) P/B (X) Dividend yield (%) CROCI (%) | 1 2 / 2 5 23,2 76 .3 23,273.6 3,932.5 2 7 .33 27.37 26.2 6.1 1.4 22.4 6/ 2 6 | 1 2 / 2 7E 4 7 , 5 3 1 .3 44,328.6 1 0 , 0 23.1 6 9. 7 2 71.65 14.5 5.6 3.3 35.5 1 2 / 2 6E | 1 2 / 2 8E 55 ,499. 1 5 0 ,12 0 .9 12,383.1 86 .9 8 84.52 11.6 4.5 4.1 38.6 3 / 2 7E |
Source: Company data, Goldman Sachs Research estimates, FactSet. Price as of 14 Aug 2026 close.
e92c7a75ab8b4efbba794e6b187208c8
For the exclusive use of KEVINLU@LENOVO.COM