PDF 原檔:報告_GS_臻鼎4958_20260812_original.pdf
圖片清單(已驗證 2026-08-13)
| 檔名 | size | 分類 | 親眼所見內容 |
|---|---|---|---|
260812_gs_ZDT_003.png |
81KB | 真資料圖 | Zhen Ding Technology Holding(4958.TW)Goldman Sachs 評等與目標價沿革圖(2023-2026,股價/指數雙軸),標示歷次目標價 130/140/160/…/295/338/388 等數字節點 |
260812_gs_ZDT_001.png(22KB)、260812_gs_ZDT_002.png(39.5KB)未達 40KB 門檻,預設 logo/裝飾,未 Read。分類只有三類:真資料圖/裝飾·logo·banner/文字卡。
原始內容
For the exclusive use of KEVINLU@LENOVO.COM
Zhen Ding Technology Holding (4958.TW)
AI PCB to ramp up from 2H26, capacity expansion extended to 2030; Buy
4958.TW
12m Pri c e Target:
NT$925.00
Pri c e:
NT$490.00
Upside:
88.8%
ZDT held its 2Q26 results call on Aug 11th. Key takeaways from management include:
(1) For AI PCB business, the company's HDI & multi-layer PCB products for both GPU & ASIC clients have entered mass production and are expected to continue to gain market share (we expect mainstream AI projects to start ramping up in 2H26). The company is currently working with customers on the next second and third generation products (the company previously mentioned that it is developing 30-50/70-80 layers PCB vs. the current mainstream AI PCB with 20-30 layers).
(2) The company remains proactive with its capacity expansion plan and reiterated its 2026 CAPEX guidance of ~NT80bn, and is likely to sustain this at a similar level through 2027/28. The company currently has 13 facilities under construction and 16 facilities in planning, additional capacity is expected to come online throughout 2026-2030. The expansion is driven by demand from major CSP clients, with a portion of the capacity booked and order visibility extending into 2029. The company intends to focus the capacity expansion on high margin products, which should help o ff set the negative impact from rising depreciation.
(3) The company has revised up its guidance on IC substrate/AI server/optical business to reach 45-50% of total revenue by 2030 (previous guidance was 40-45%), and expects these businesses to grow twofold in 2026 (these businesses accounted for ~12% in 2025).
(4) For the optical-related business, the company mentioned that orders are primarily driven by 1.6T with strong order visibility with some clients that are already booking 2027 capacity. The company has industry leading production yields at 90%+ in its Thailand facility and even higher yields in its Huai'an facility, and expects optical-related revenue/capacity to see multiple-fold growth in
BUY
Chao Wang
+886(2)2730-4195 | kuan-chao.wang@gs.com Goldman Sachs (Asia) L.L.C., Taipei Branch
Allen Chang
+852-2978-2930 | allen.k.chang@gs.com Goldman Sachs (Asia) L.L.C.
Al Wang
+886(2)2730-4081 | al.wang@gs.com Goldman Sachs (Asia) L.L.C., Taipei Branch
Key Data _____________________________________
Market cap: NT$524.6bn / $16.3bn
Enterprise value: NT$602.8bn / $18.7bn
3m ADTV: NT$19.5bn / $612.5mn
Taiwan
Taiwan Electronic Components
M&A Rank: 3
Leases incl. in net debt & EV?: Yes
| GS Forecast | 12/25 | __________ 12/26E | 12/27E | 12/28E |
|---|---|---|---|---|
| Revenue(NT$mn) New | 182,521.6 | 222,195.1 | 354,197.5 | 556,512.9 |
| Revenue (NT$ mn) Old | 182,521.6 | 224,679.6 | 327,763.9 | 454,047.2 |
| EBITDA (NT$ mn) | 32,484.0 | 44,182.9 | 78,605.4 | 137,299.1 |
| EPS(NT$) New | 6.91 | 13.52 | 31.70 | 61.60 |
| EPS (NT$) Old | 6.91 | 15.27 | 31.09 | 50.84 |
| P/E (X) | 18.6 | 36.2 | 15.5 | 8.0 |
| P/B (X) | 0.8 | 2.9 | 2.5 | 1.9 |
| Dividend yield (%) | 2.7 | 1.4 | 3.2 | 6.3 |
| C RO C I (%) | 12.0 | 14.4 | 19.8 | 27.9 |
| 6/26 | 9/26E | 12/26E | 3/27E | |
| EPS (NT$) | 2.19 | 4.09 | 5.90 | 4.38 |
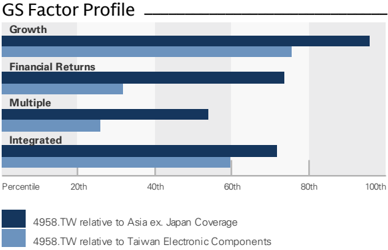
Source: Company data, Goldman Sachs Research estimates. See disclosures for details.
Goldman Sachs does and seeks to do business with companies covered in its research reports. As a result, investors should be aware that the fi rm may have a con fl ict of interest that could a ff ect the objectivity of this report. Investors should consider this report as only a single factor in making their investment decision. For Reg AC certi fi cation and other important disclosures, see the Disclosure Appendix, or go to www.gs.com/research/hedge.html. Analysts employed by non-US a ffi liates are not registered/quali fi ed as research analysts with FINRA in the U.S.
e92c7a75ab8b4efbba794e6b187208c8
For the exclusive use of KEVINLU@LENOVO.COM
Zhen Ding Technology Holding (4958.TW)
Rating since Apr 29, 2025
Ratios & Valuation __________________________________________
| 12/25 | 12/26E | 12/27E | 12/28E | |
|---|---|---|---|---|
| P/E (X) | 18.6 | 36.2 | 1 5 . 5 | 8.0 |
| P/B (X) | 0.8 | 2.9 | 2. 5 | 1.9 |
| FCF yield (%) | (3.2) | (7.0) | (1. 5 ) | 6.6 |
| EV/EBITDAR (X) | 4.7 | 13.8 | 8.2 | 4.7 |
| EV/EBITDA (excl. leases) (X) | 4.7 | 13.8 | 8.2 | 4.7 |
| CROCI (%) | 12.0 | 14.4 | 19.8 | 27.9 |
| ROE (%) | 5 .8 | 11. 5 | 24.7 | 40.6 |
| Net debt/equity (%) | (11.6) | 13. 5 | 19.0 | 6.1 |
| Net debt/equity (excl. leases) (%) | (12.2) | 12.9 | 18. 5 | 5 .7 |
| Interest co v er (X) | 6.7 | 11.6 | 28.0 | 5 6.6 |
| Days in v entory outst , sales | 37.6 | 33. 5 | 26.3 | 24.4 |
| Recei v able days | 63.6 | 5 8.1 | 5 0.4 | 49.9 |
| Days p ayable outstandin g | 5 6.4 | 5 4. 5 | 47.8 | 48. 5 |
| DuPont ROE (%) | 4.0 | 8.0 | 16.0 | 24.2 |
| Turno v er (X) | 0.7 | 0.7 | 1.0 | 1.2 |
| L e v era g e (X) | 1.6 | 1.6 | 1.7 | 1.6 |
| G ross cas h in v ested (ex cas h ) (NT $ ) | 2 5 4 , 306.9 | 334 , 107.3 | 40 5, 061.8 | 467 , 799.6 |
| A v era g e ca p ital e mp loyed (NT $ ) | 139 , 0 5 2.4 | 179 , 134.6 | 232 , 212.0 | 274 ,5 77.3 |
| BVP S (NT $ ) | 1 5 9.46 | 169.60 | 198.2 5 | 2 5 4.47 |
Growth & Margins (%) ______________________________________
| 12/25 | 12/26E | 12/27E | 12/28E | |
|---|---|---|---|---|
| Total revenue growth | 6.3 | 21.7 | 59.4 | 57.1 |
| E BITDA growth | 10.7 | 36 | 77.9 | 74.7 |
| E PS growth | (28.6) | 95.7 | 134.5 | 94.4 |
| DPS growth | (28.1) | 95.9 | 134.5 | 94.4 |
| E BIT margin | 7.6 | 10.3 | 15.6 | 20.1 |
| E BITDA margin | 17.8 | 19.9 | 22.2 | 24.7 |
| Net income margin | 3.7 | 6.6 | 9.8 | 12.1 |
Price Performance __________________________________________
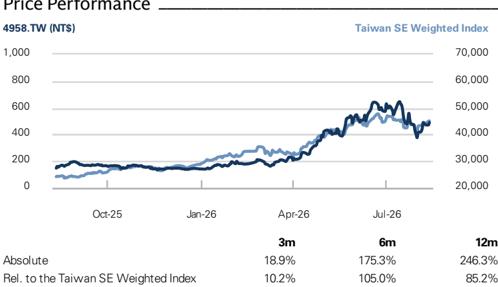
Source: FactSet. Price as of 11 Aug 2026 close.
Income Statement (NT$ mn) ________________________________
| 12/25 | 12/26E | 12/27E | 12/28E | |
|---|---|---|---|---|
| To t a l r e v e nu e | 182,521 .6 | 222,195 . 1 | 354,197 . 5 | 55 6 ,512 . 9 |
| Cost of goods sold | (14 6 ,385 . 2) | (1 6 8,449 . 5) | (259,5 0 3 . 1) | (38 6 ,445 . 7) |
| SG& A | (1 0 ,397 . 7) | (12,8 0 5 .0 ) | (14,454 .6 ) | (22,317 .0 ) |
| R&D | (11,8 0 7 . 1) | (18, 0 19 . 3) | (24,972 . 9) | (3 6 , 0 74 . 3) |
| Other operating inc . /(exp . ) | -- | -- | -- | -- |
| E BITDA | 3 2 ,4 8 4.0 | 44, 182 .9 | 78 , 6 0 5 .4 | 1 3 7 , 2 99. 1 |
| Depreciation& amortization | (18,552 . 5) | (21,2 6 1 .6 ) | (23,338 . 5) | (25, 6 23 . 2) |
| E BIT | 1 3,93 1 . 6 | 22 ,9 21 .3 | 55 , 266 . 8 | 111 , 675 .9 |
| Net interest inc . /(exp . ) associates | 374 . 4 | 222 . 5 | (1,15 6. 4) | (1, 6 52 .6 ) -- |
| Income/(loss) from Pre-tax pro fi t | (1 6. 7) 1 4,0 62 . 7 | -- 25 ,4 88 .3 | -- 57 , 866 . 8 | 112 ,4 75 .9 |
| Provision for taxes | (3,457 .6 ) | (4,28 0. 8) | (9, 0 58 . 4) | (17, 6 23 . 1) |
| Minority interest | (3,814 .6 ) | ( 6 ,49 6. 3) | (14,259 . 2) | (27,7 0 5 . 2) |
| Preferred dividends | -- 5 | -- | -- | -- 6 |
| N et inc . ( pre-ex c ept i o n a ls) | 6 , 7 90. | 1 4, 711 . 2 | 34, 5 49.3 | 67 , 1 4 7 . |
| Post-tax exceptionals | -- | -- | -- | -- |
| N et inc . ( po s t-ex c ept i o n a ls) | 6 , 7 90. 5 | 1 4, 711 . 2 | 34, 5 49.3 | 67 , 1 4 7 . 6 |
| E P S(b a sic , pre-ex c ept ) (N T $) | 6 .9 1 | 1 3. 52 | 3 1 . 7 0 | 61 . 6 0 |
| E P S(dilu te d , pre-ex c ept ) (N T $) | 6 .9 1 | 1 3. 52 | 3 1 . 7 0 | 61 . 6 0 |
| E P S(b a sic , po s t-ex c ept ) (N T $) | 6 .9 1 | 1 3. 52 | 3 1 . 7 0 | 61 . 6 0 |
| E P S(dilu te d , po s t-ex c ept ) (N T $) | 6 .9 1 | 1 3. 52 | 3 1 . 7 0 | 61 . 6 0 |
| DPS (NT$) | 3 . 45 | 6. 7 6 | 15 . 85 | 3 0. 8 0 |
| Div . payout ratio (%) | 49 . 9 | 5 0.0 | 5 0.0 | 5 0.0 |
| Balance Sheet (NT$ mn) | ______ | |||
| 12/25 | 12/26E | 12/27E | 12/28E | |
| C a sh& c a sh equiv a lents | 71,116.4 | 26,429.4 | 10,347.3 | 34,511.6 |
| Accounts receiv a ble | 32,616.6 | 3 8 ,0 88 .3 | 59,745.5 | 92,347.1 44,467.7 |
| Inventory Other | 19,616.3 | 21,175.6 | 29, 8 60.6 4,291.9 | 4,291.9 |
| current a ssets | 4,291.9 | 4,291.9 | ||
| Total current assets | 127 , 6 4 1.1 | 89 , 985.1 | 1 04, 2 4 5. 3 | 175 , 618. 3 |
| Net PP&E | 123,736. 8 | 1 8 2,967.2 | 225,120.5 | 251,9 8 9.3 |
| Net int a ngibles Tot a l | 2,709.7 | 2,217. 8 9, 8 | 1,725.9 9, 8 65.7 | 1,234.0 9, 8 65.7 |
| investments Other long-term a | 9, 8 65.7 | 65.7 16,0 8 9.7 | 16,0 8 9.7 | |
| ssets | 16,0 8 9.7 | 16,0 8 9.7 5 4, 796.9 | ||
| Total assets | 28 0,043 . 0 | 30 1 , 125. 4 | 3 57 ,04 7.1 | 4 |
| Accounts p a y a ble | 23,501.3 | 26,767.3 | 41,236.1 | 61,407. 8 23, 8 39.0 |
| Short-term d ebt | 23, 8 39.0 | 23, 8 39.0 | 23, 8 39.0 | |
| Short-term le a se li a bilities | 246.9 | 246.9 | 246.9 | 246.9 |
| Other current li a bilities | 25,234.0 | 29,19 8 .5 | 39,117.5 | 55,416.7 |
| Total current liabilities | 72 , 821.2 | 8 0,0 51.7 | 1 04,43 9.5 | 1 40, 91 0 . 4 |
| Long-term d ebt | 26,429. 8 | 26,429. 8 | 26,429. 8 | 26,429. 8 |
| Long-term le a se li a bilities | 8 72.6 | 8 72.6 | 8 72.6 | 8 72.6 |
| bilities liabilities | 9,206. | 9,206. 8 | 9,206. | 9,206. 8 |
| Other long-term li a Total long-term | 8 | 3 6 , 5 0 9.2 | 8 3 6 , 5 0 9.2 | 3 6 , 5 0 9.2 |
| Total liabilities | 3 6 , 5 0 9.2 1 0 9 ,330 . 4 | 116 , 56 0 .9 | 1 40, 9 4 8.7 | 177 ,4 19.6 |
| -- | -- | -- | -- | |
| Preferre d sh a res Tot a l commonequity | 131,337.2 | 14 8 ,611. 8 | 1 8 2,1 8 5.6 | |
| Minority interest | 123,9 8 1.6 4 6 , 7 3 1.1 | 5 3, 227. 4 | 67 ,4 86.6 | 95 , 191.7 |
| Total liabilities &equity | 28 0,043 . 0 | 30 1 , 125. 4 | 3 57 ,04 7.1 | 4 5 4, 796.9 |
| Net d ebt, ad juste d | (20, 8 47.5) | 23, 8 39.4 | 39,921.6 | 15,757.2 |
| Cash Flow (NT$ mn) | __________ | |||
| 12/25 | 12/26E | 12/27E | 12/28E | |
| Net income | 6,790.5 | 14,711.2 | 34,549.3 | 67,147.6 |
| D&Aadd-back | 18,552.5 | 21,261.6 | 23,338.5 | 25,623.2 |
| Minority interest add-back | 3,814.6 | 6,496.3 | 14,259.2 | 27,705.2 |
| Net (inc)/dec working capital | (1,212.1) | (3,764.9) | (15,873.5) | (27,037.0) |
| Other operating cash flow | (329.0) | -- | -- | -- |
| Cash flow fro m operations | 27 , 616 . 5 | 3 8 , 7 04. 2 | 56 , 27 3. 5 | 93,439.0 |
| Capital expenditures | (33,083.4) | (80,000.0) | (65,000.0) | (52,000.0) |
| Acquisitions | -- | -- | -- | -- |
| Divestitures | -- | -- | -- | -- |
| Others Cash flow fro m investing | 1,123.4 (3 1 ,9 6 0.0) | -- ( 8 0,000.0) | -- ( 65 ,000.0) | -- ( 52 ,000.0) |
| Repayment of lease liabilities | -- | -- | -- (7,355.6) | -- |
| Dividends paid(common& pref) | (7,221.4) | (3,391.2) | (17,274.6) | |
| Inc/(dec) in debt Other | 5,509.8 (2,330.6) | -- 0.0 | -- 0.0 | -- 0.0 |
| financing cash flows Cash flow fro m financing | (4,04 2 . 2 ) | (3,39 1 . 2 ) | ( 7 ,3 55 . 6 ) | ( 17 , 27 4. 6 ) |
| Total cash flow Free cash flow | ( 8 ,3 85 . 6 ) (5,466.9) | (44, 687 .0) (41,295.8) | ( 16 ,0 82 . 2 ) (8,726.5) | 2 4, 16 4.4 41,439.0 |
Source: Company data, Goldman Sachs Research estimates.
e92c7a75ab8b4efbba794e6b187208c8
For the exclusive use of KEVINLU@LENOVO.COM
- ZDT aims to become the biggest optical module PCB supplier in 2027.
(5) In terms of potential material shortages, especially T-glass, the company continues to secure stable supply through agreements with key suppliers and is currently developing a second source.
(6) Demand for FPC is increasing, driven by AI glasses and new foldable phones. Per ZDT, the key smartphone customer is expecting to release foldable phone this year with higher FPC content value (foldable phone will have 30-50% more FPC dollar content vs. standard smartphone per GSe).
ZDT 2Q26 core business (OPI) was 6%/9% lower than GSe/BBG consensus, while GM was higher than GSe/consensus by 1.6/0.7ppt in 2Q25 mainly due to the improved product mix. The company spent NT$7,425mn OPEX in 2Q26, which was higher than GSe/BBG consensus of NT$6,417mn/NT$6,193mn. Earnings were 1%/2% lower than GSe/BBG consensus.
Going into 3Q26 , we expect ZDT revenue to increase by 30% QoQ, mainly due the mobile communication business entering its peak seasons as well as from increasing AI contribution. For GM, we expect ZDT's 3Q26 GM to further expand by 1.8ppt QoQ to 24.9%, after factoring in the improved product mix. Overall, we believe ZDT's 3Q26 EPS should rise to NT$4.09 vs. NT$2.19 in 2Q26, with ongoing margin improvement.
Investment view
We remain positive on ZDT's AI-related business outlook given (1) the company's leading technology position in all key AI-related businesses, including HDI & HLC PCB, mSAP solution for optical transceivers, and ABF substrates, and (2) its proactive expansion plans to meet continued demand strength.
Based on our latest update on AI PCB/CCL TAM (see here), we expect overall PCB TAM to see a ~148% 2026-28E CAGR and expect ZDT's AI PCB business to outperform the market on a 300%+ 2026-28E CAGR. We believe the company is well positioned to gain market share as AI servers increasingly adopt HDI PCBs, where ZDT is able to leverage its over a decade of HDI expertise in consumer electronics to further expand share in the market. Furthermore, per management the company has already passed veri fi cation for PCB supply in Vera Rubin's compute tray, and we expect the contribution to become more meaningful starting from 2H26, with good pro fi tability (average OPM of 20-30% for AI computing tray vs. company overall OPM of 10-15%), which should further drive margin expansion in coming quarters/years.
For the optical transceiver business, we expect ZDT to see strong growth with a 200%+ revenue CAGR over 2026-28E, mainly driven by its (1) technology leadership in mSAP technology, supported by nearly a decade of experience in mSAP solution for SLP used in smartphones, and (2) the most proactive expansion plans we see among a limited supplier base. We believe ZDT could become the leading optical transceiver PCB supplier by 2027 (reaching 35-40% market share per GSe), and that it will also see margin expansion (optical transceiver PCBs with GM at 35-40% vs. below 30% for SLPs) along with the ramp up of the business.
For its ABF substrate business, we believe the company will continue to have the ability to increase ABF price, supported by full UTR and strong demand, while the industry in our view remains conservative on its capacity expansion plans over the next 1-2 years e92c7a75ab8b4efbba794e6b187208c8
camell 1.401 94240 earls comp lavie
ZDT (4958. TW)
Sales
EBIT
Revenue
Gross profits
Operating profits
Pre-tax income
Net earnings
EPS, NT$
Gross margin (%)
EBIT margin (%)
Net margin (%)
2Q26
GS est.
48,431
QoQ
1Q26
40,728
YoY
2Q25
38,203
Bloomberg consensus
46,076
5%
............
8%
QoQ
4%
4%
relative to our forecasts. We expect ABF substrate LTA/Spot prices to increase by 10-15%/20%+ QoQ per quarter from 3Q26 through at least the end of 2027, with shortages likely extending into 2028 (see here). Overall, the business condition for ABF substrate is improving with price increase and we expect the business, which was loss making in 2025, to turn pro fi table this year. 4.7ppt 22.4% 0.7ppt
Overall, we reiterate our Buy-rating on ZDT, with a new 12m TP of NT$925 (from NT$824). -0.1ppt 1.4ppt 3.4ppt -0.5ppt
48,431
11,186
3,761
4,931
2,392
2.22
23.1%
7.8%
4.9%
Exhibit 1: ZDT's 2Q26 earnings comp table
Source: Company data, Goldman Sachs Global Investment Research, Bloomberg
Earnings revisions
We revise down our 2026E net income estimate by 10% to factor in 2Q26 results and higher opex assumptions. We revise up our 2027/28/29E net income by 2/21/22% to factor in higher AI-related contribution including AI PCB and optical transceivers. We revise up our 2026/27/28/29E GPM by 0.5/0.8/1.2/0.6ppt due to the higher contribution from AI-related business.
Exhibit 2: Earnings revision table
Source: Company data, Goldman Sachs Global Investment Research
Valuation
We are Buy rated with a new 12-month TP NT$925 (from NT$824), still based on our SOTP based valuation methodology of (1) 3.5x blended P/B (was 3.0x blended P/B) for ABF & BT substrate, which is 1 STDV above early upcycle industry average, (2) 20x P/E for high-growth AI server/switch related PCB (in line with industry average), and (3) 8x P/E for low-growth consumer electronics PCB (in-line with industry downcycle average valuation), and maintain our valuation period from at 2028E, and factor in our latest earnings revision.
19%
For the exclusive use of KEVINLU@LENOVO.COM
Diff (%)
0%
27%
e92c7a75ab8b4efbba794e6b187208c8
NTSmn
Revenue
Gross profit
Operating expense
Operating income
Pretax income
Taxes expense
Net income
2Q26
(7,425)
3,761
1Q26
(6,308)
2,503
3Q26E
61,474
15,298
(8,361)
6,937
2,400
4,931
7.437
Exhibit 3: P&L table
EPS, NT$
Ratio analysis and assumption
As % of sales
Gross margin
Operating expense ratio
Operating margin
Net margin
QoQ growth (%)
Revenue
Gross profit
Operating income
Net income
YoY growth (%)
Revenue
Gross profit
Operating income
Net income
1027E
67,839
15,314
(8,086)
7,228
8.028
(1,365)
4,777
2Q27E
76.528
18,896
(8,705)
10,190
10.890|
(1,851)
6,404
4Q27E
112,786
32,607
(12,067)
20,540
21.540
(3,231)
12,924
1Q28E
101,662
26,837
(10,777)
16,060
16,160
(2,747)
9,615
3Q27E
97,045
27,878
(10,570)
17,308
17.408
(2,611)
10,445
4Q26E
71,562
18.450
(8,731)
9,719
10.719
(1,608)
6,432
2Q28E
119.418
34,636
(13,310)
21,326
21,426
(3,642)
12,599
3Q28E
154,208
49,545
(16,041)
33,504
33.604
(5,041)
20,163
4Q28E
181,225
59,048
(18,263)
40,785
41.285
(6,193)
24,771
2025
182,522
(22,205)
13,932
14.063
(3,458)
6,791
2026E
222,195
(30,824)
22,921
25,488
(4,281)
14,711
2027E
354,197
(39,428)
55,267
57,867
(9,058)
34,549
2028E
556,513
(58,391)
111,676
112,476
(17,623)
67,148
2029E
739,278
(73,011)
173,010
174,310
(27,723)
103,908
| 1.33 | 2.19 4.09 | 5.90 | 4.38 5.87 | 9.58 | 11.86 | 8.82 | 11.56 | 18.50 | 22.73 | 6.91 | 13.52 31.70 | 61.60 | 95.33 | ||
|---|---|---|---|---|---|---|---|---|---|---|---|---|---|---|---|
| 21.6% | 23.1% 24.9% | 25.8% | 22.6% | 24.7% | 28.7% | 28.9% | 26.4% | 29.0% | 32.1% | 32.6% | 19.8% | 24.2% 26.7% | 30.6% | 33.3% | |
| 15.5% | 15.3% 13.6% | 12.2% | 11.9% 11.4% | 10.9% | 10.7% 10.6% | 11.1% | 10.4% | 10.1% | 12.2% | 13.9% 11.1% | 10.5% | 9.9% | |||
| 6.1% | 7.8% 11.3% | 13.6% | 10.7% | 13.3% | 17.8% 18.2% | 15.8% | 17.9% | 21.7% | 22.5% | 7.6% | 10.3% 15.6% | 20.1% | 23.4% | ||
| 3.5% | 4.9% 7.3% | 9.0% | 7.0% | 8.4% 10.8% | 11.5% | 9.5% | 10.5% | 13.1% | 13.7% | 3.7% | 6.6% | 9.8% 12.1% | 14.1% | ||
| -31.3% 26.9% 36.8% 20.6% -17.0% 23.4% 47.5% 17.0% -17.7% 29.1% 43.0% 19.2% | -31.3% 26.9% 36.8% 20.6% -17.0% 23.4% 47.5% 17.0% -17.7% 29.1% 43.0% 19.2% | -31.3% 26.9% 36.8% 20.6% -17.0% 23.4% 47.5% 17.0% -17.7% 29.1% 43.0% 19.2% | -31.3% 26.9% 36.8% 20.6% -17.0% 23.4% 47.5% 17.0% -17.7% 29.1% 43.0% 19.2% | -31.3% 26.9% 36.8% 20.6% -17.0% 23.4% 47.5% 17.0% -17.7% 29.1% 43.0% 19.2% | -31.3% 26.9% 36.8% 20.6% -17.0% 23.4% 47.5% 17.0% -17.7% 29.1% 43.0% 19.2% | -31.3% 26.9% 36.8% 20.6% -17.0% 23.4% 47.5% 17.0% -17.7% 29.1% 43.0% 19.2% | -31.3% 26.9% 36.8% 20.6% -17.0% 23.4% 47.5% 17.0% -17.7% 29.1% 43.0% 19.2% | -31.3% 26.9% 36.8% 20.6% -17.0% 23.4% 47.5% 17.0% -17.7% 29.1% 43.0% 19.2% | -31.3% 26.9% 36.8% 20.6% -17.0% 23.4% 47.5% 17.0% -17.7% 29.1% 43.0% 19.2% | -31.3% 26.9% 36.8% 20.6% -17.0% 23.4% 47.5% 17.0% -17.7% 29.1% 43.0% 19.2% | -31.3% 26.9% 36.8% 20.6% -17.0% 23.4% 47.5% 17.0% -17.7% 29.1% 43.0% 19.2% | -31.3% 26.9% 36.8% 20.6% -17.0% 23.4% 47.5% 17.0% -17.7% 29.1% 43.0% 19.2% | |||
| -57.7% 50.2% 84.4% 40.1% -25.6% 41 0% 69.8% 18.7% -21.8% 32.8% 57.1% 21.7% | -57.7% 50.2% 84.4% 40.1% -25.6% 41 0% 69.8% 18.7% -21.8% 32.8% 57.1% 21.7% | -57.7% 50.2% 84.4% 40.1% -25.6% 41 0% 69.8% 18.7% -21.8% 32.8% 57.1% 21.7% | -57.7% 50.2% 84.4% 40.1% -25.6% 41 0% 69.8% 18.7% -21.8% 32.8% 57.1% 21.7% | -57.7% 50.2% 84.4% 40.1% -25.6% 41 0% 69.8% 18.7% -21.8% 32.8% 57.1% 21.7% | -57.7% 50.2% 84.4% 40.1% -25.6% 41 0% 69.8% 18.7% -21.8% 32.8% 57.1% 21.7% | -57.7% 50.2% 84.4% 40.1% -25.6% 41 0% 69.8% 18.7% -21.8% 32.8% 57.1% 21.7% | -57.7% 50.2% 84.4% 40.1% -25.6% 41 0% 69.8% 18.7% -21.8% 32.8% 57.1% 21.7% | -57.7% 50.2% 84.4% 40.1% -25.6% 41 0% 69.8% 18.7% -21.8% 32.8% 57.1% 21.7% | -57.7% 50.2% 84.4% 40.1% -25.6% 41 0% 69.8% 18.7% -21.8% 32.8% 57.1% 21.7% | -57.7% 50.2% 84.4% 40.1% -25.6% 41 0% 69.8% 18.7% -21.8% 32.8% 57.1% 21.7% | -57.7% 50.2% 84.4% 40.1% -25.6% 41 0% 69.8% 18.7% -21.8% 32.8% 57.1% 21.7% | -57.7% 50.2% 84.4% 40.1% -25.6% 41 0% 69.8% 18.7% -21.8% 32.8% 57.1% 21.7% | |||
| -54.9% | 67.8% 86.6% | 44.1% | -25.7% | 34.1% | 63.1% | 23.7% | -25.6% | 31.0% | 60.0% | 22.9% | |||||
| 1.6% | 26.8% 29.8% | 25.8% | 66.6% | 58.0% | 57.9% | 57.6% | 49.9% | 56.0% | 58.9% | 60.7% | 6% | 22% | 59% 57% | 33% | |
| 49.7% | 59.6% 46.9% | 43 8% | 73.8% | 68.9% | 82 2% | 76.7% | 75.2% | 83.3% | 77.7% | 81.1% | 11% | 49% 76% | 80% | 45% | |
| 137 1% 55 1% 53 1% 64.2% 188 7% 170 9% 119 5% 111 3% 122 2% 109.3% 93.6% 98 6% 20% | 137 1% 55 1% 53 1% 64.2% 188 7% 170 9% 119 5% 111 3% 122 2% 109.3% 93.6% 98 6% 20% | 137 1% 55 1% 53 1% 64.2% 188 7% 170 9% 119 5% 111 3% 122 2% 109.3% 93.6% 98 6% 20% | 137 1% 55 1% 53 1% 64.2% 188 7% 170 9% 119 5% 111 3% 122 2% 109.3% 93.6% 98 6% 20% | 137 1% 55 1% 53 1% 64.2% 188 7% 170 9% 119 5% 111 3% 122 2% 109.3% 93.6% 98 6% 20% | 137 1% 55 1% 53 1% 64.2% 188 7% 170 9% 119 5% 111 3% 122 2% 109.3% 93.6% 98 6% 20% | 137 1% 55 1% 53 1% 64.2% 188 7% 170 9% 119 5% 111 3% 122 2% 109.3% 93.6% 98 6% 20% | 137 1% 55 1% 53 1% 64.2% 188 7% 170 9% 119 5% 111 3% 122 2% 109.3% 93.6% 98 6% 20% | 137 1% 55 1% 53 1% 64.2% 188 7% 170 9% 119 5% 111 3% 122 2% 109.3% 93.6% 98 6% 20% | 137 1% 55 1% 53 1% 64.2% 188 7% 170 9% 119 5% 111 3% 122 2% 109.3% 93.6% 98 6% 20% | 137 1% 55 1% 53 1% 64.2% 188 7% 170 9% 119 5% 111 3% 122 2% 109.3% 93.6% 98 6% 20% | 137 1% 55 1% 53 1% 64.2% 188 7% 170 9% 119 5% 111 3% 122 2% 109.3% 93.6% 98 6% 20% | 65% | 141% | 102% | 55% |
| 125.4% | 295.3% 86.6% | 103.5% | 235.1% | 167.8% | 134.1% | 100.9% | 101.3% | 96.7% | 93.0% | 91 7% | -26% | 117% 135% | 94% | 55% |
Source: Company data, Goldman Sachs Global Investment Research
Zhen Ding Technology (ZDT) is the global leading PCB supplier (top 1 in market share in sales) with 7-10% market share, and started its ABF substrate business from 2023 in Shenzhen, China, and has the highest ABF revenue exposure to the China market compared to all other ABF substrate suppliers. We believe ZDT will hold more than 40% ABF substrate market share in China by 2027E (up from 31% in 2024) and bene fi t the most from the strong and growing China ABF substrate market (53% 2025E-27E CAGR) due to the increasing in-sourcing ratio for the AI computing ASIC/GPU market in China. We also expect the increasing foldable smartphone penetration rate in the long term to drive ZDT's FPC TAM, and account for 50% of the company's total revenue in 2027E. We see further revenue upside potential from foldable phones. We are Buy rated mainly due to our positive view on the company's China ABF substrate business opportunity, which should not only drive ZDT's revenue growth, but also improve its OPM level in the long term. We see upside for the stock price considering the company's solid growth opportunity, and our TP implied P/E multiple is still lower than the company's past 10+ year P/E average, which we believe is fair considering the potential upside from China ABF substrate market and increasing foldable phone penetration rate.
Valuation : Our 12-month TP of NT$925 is based on a SOTP valuation methodology, including (1) 3.5x blended 2028E P/B for ABF & BT substrate, (2) 20x 2028E P/E for high-growth AI server/switch related PCB (in line with industry average), and (3) 8x 2028E P/E for low-growth consumer electronics PCB (in-line with industry downcycle average valuation).
Key downside risks include : (1) weaker-than-expected iPhone demand or slower content upgrade, (2) delay in new substrate capacity or slower-than-expected yield rate ramp up progress, and (3) fi ercer competition in China ABF market.
For the exclusive use of KEVINLU@LENOVO.COM
e92c7a75ab8b4efbba794e6b187208c8
For the exclusive use of KEVINLU@LENOVO.COM