PDF 原檔:報告_GS_台光電2383_20260730_original.pdf
圖片清單(已驗證 2026-07-31)
| 檔名 | size | 分類 | 親眼所見內容 |
|---|---|---|---|
260730_gs_EMC_001.png |
131.0KB | 真資料圖 | 分析師聯絡卡+「Key Data」與「GS Forecast」數字表(12/25-12/28E 營收/EBITDA/EPS/估值倍數)+「GS Factor Profile」百分位長條圖 |
260730_gs_EMC_002.png |
26.1KB | 真資料圖 | 「GS Factor Profile」百分位長條圖,Growth/Financial Returns/Multiple/Integrated 四維度,2383.TW 相對 Asia ex. Japan Coverage 與相對台灣電子零組件同業 |
260730_gs_EMC_003.png |
89.7KB | 真資料圖 | 台光電(Elite Material, 2383.TW)Goldman Sachs 評等與目標價沿革圖(2023-2026),標示歷次 rating/price target 數值點 |
原始內容
For the exclusive use of KEVINLU@LENOVO.COM
Elite Material (2383.TW)
Better high-end M9/substrate CCL contribution from 2H26, suggesting even better GM/OPM in coming quarters; reiterate Buy
2383.TW
12m Pri
c
e Target:
NT$10,200.00
Pri c e:
NT$4,100.00
Upside:
148.8%
We hosted EMC's 2Q26 post result call on July 30th. Key takeaways include:
(1) EMC mentioned MP (mass production) for the M9 CCL products has started in 3Q26 and the demand will get even stronger in 4Q26 and beyond, while M9 CCL has already accounted for low single digits of total revenue in 1H26, despite limited shipments. Management expects Nvidia HGX R200 UBB to be the fi rst board to adopt M9 CCL in 3Q26 and further expects shipment of M9 CCL for LPU to start from 4Q26.
- (2) Management mentioned the possibility of another round of CCL pricing hike to occur in 2H26 as the company continues to see cost increases in raw materials. Material supply remains tight in 2H26, which spans across glass fi ber (E-glass & low-DK2) and high-end copper foil (mostly HVLP4). Despite seeing possibility of further cost increases in 2H26, the company can pass-through the higher cost through price hikes.
- (3) Without considering the potential pricing hike and further M9 grade CCL demand growth in 3Q26, EMC now sees its 3Q revenue minimal growth rate at 15% QoQ and the most conservative 3Q GM estimate is 35% +-1.5ppt (1.1ppt GM expansion at the midpoint vs. 2Q26 GM), while the company also mentioned potential upward revision is possible if market conditions continue to be even more favorable.
(4) EMC continue to make progress on substrate CCL, and expects the product shipment could start from 4Q26 the earliest with a high GM (40-50%+ vs. company 's ~34% in 2Q26). The company holds 1.6% market share in substrate CCL market in 2025 and expects to double the share in a one-year time frame; it will expand its substrate CCL capacity by 100% in 4Q26 and will expand the capacity by another 100% in 2027.
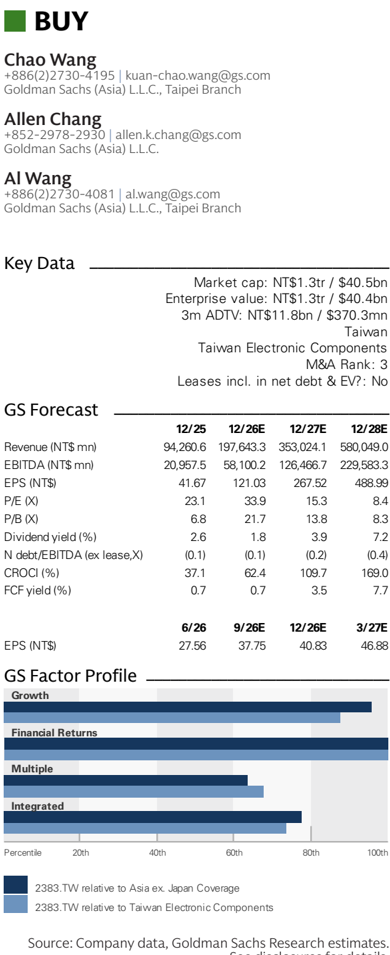
Key Data _____________________________________
Market cap: NT$1.3tr / $40.5bn
Enterprise value: NT$1.3tr / $40.4bn
3m ADTV: NT$11.8bn / $370.3mn
Taiwan
Taiwan Electronic Components
M&A Rank: 3
Leases incl. in net debt & EV?: No
| GS Forecast | 12/25 | __________ 12/26E | 12/27E | 12/28E |
|---|---|---|---|---|
| Revenue (NT$ mn) | 94,260.6 | 197,643.3 | 353,024.1 | 580,049.0 |
| EBITDA (NT$ mn) | 20,957.5 | 58,100.2 | 126,466.7 | 229,583.3 |
| EPS (NT$) | 41.67 | 121.03 | 267.52 | 488.99 |
| P/E (X) | 23.1 | 33.9 | 15.3 | 8.4 |
| P/B (X) | 6.8 | 21.7 | 13.8 | 8.3 |
| Dividend yield (%) | 2.6 | 1.8 | 3.9 | 7.2 |
| N debt/EBITDA (ex lea s e,X) | (0.1) | (0.1) | (0.2) | (0.4) |
| C R OC I (%) | 37.1 | 62.4 | 109.7 | 169.0 |
| FCF yield (%) | 0.7 | 0.7 | 3.5 | 7.7 |
| 6/26 | 9/26E | 12/26E | 3/27E | |
| EPS (NT$) | 27.56 | 37.75 | 40.83 | 46.88 |
Source: Company data, Goldman Sachs Research estimates. See disclosures for details.
Goldman Sachs does and seeks to do business with companies covered in its research reports. As a result, investors should be aware that the fi rm may have a con fl ict of interest that could a ff ect the objectivity of this report. Investors should consider this report as only a single factor in making their investment decision. For Reg AC certi fi cation and other important disclosures, see the Disclosure Appendix, or go to www.gs.com/research/hedge.html. Analysts employed by non-US a ffi liates are not registered/quali fi ed as research analysts with FINRA in the U.S.
e92c7a75ab8b4efbba794e6b187208c8
For the exclusive use of KEVINLU@LENOVO.COM
BUY
Elite Material (2383.TW)
Rating since Oct 26, 2023
Ratios & Valuation __________________________________________
| 12/25 | 12/26E | 12/27E | 12/28E | |
|---|---|---|---|---|
| P/E (X) | 23.1 | 33.9 | 15.3 | 8.4 |
| P/B (X) | 6.8 | 21.7 | 13.8 | 8.3 |
| FCF yield (%) | 0.7 | 0.7 | 3.5 | 7.7 |
| EV/EBIT D AR(X) | 16.1 | 25.2 | 11.4 | 6.0 |
| EV/EBIT D A(excl. leases) (X) | 16.1 | 25.2 | 11.4 | 6.0 |
| CROCI (%) | 37.1 | 62.4 | 109.7 | 169.0 |
| ROE (%) | 34.2 | 73.3 | 110.2 | 124.1 |
| Net debt/equity (%) | (4.9) | (4.8) | (27.6) | (48.2) |
| Net debt/equity (excl. leases) (%) | (4.9) | (4.8) | (27.6) | (48.2) |
| Interest co v er (X) | 43.6 | 79.1 | 149.2 | 278.2 |
| D ays in v entory outst , sales | 50.7 | 33.3 | 26.3 | 25.5 |
| Recei v able days | 121.8 | 88.8 | 83.3 | 84.5 |
| D ays p ayable outstandin g | 111.7 | 87.4 | 84.6 | 86.0 |
| D uPont ROE (%) | 29.0 | 64.0 | 90.3 | 99.4 |
| Turno v er (X) | 0.9 | 1.2 | 1.4 | 1.4 |
| L e v era g e (X) | 2.1 | 2.4 | 2.4 | 2.3 |
| G ross cas h in v ested (ex cas h ) (NT $ ) | 63 , 748.5 | 82 , 214.6 | 96 , 578.0 | 113 , 023.8 |
| A v era g e ca p ital e mp loyed (NT $ ) | 38 , 551.2 | 56 , 237.4 | 70 , 690.4 | 84 , 058.3 |
| BVP S (NT $ ) | 140.81 | 189.25 | 296.26 | 491.86 |
Growth & Margins (%) ______________________________________
| 12/25 | 12/26E | 12/27E | 12/28E | |
|---|---|---|---|---|
| Total revenue growth | 46.4 | 1 0 9.7 | 78.6 | 64.3 |
| EBITDA growth | 5 0 .5 | 177.2 | 117.7 | 81.5 |
| EPS growth | 49.8 | 19 0 .5 | 121. 0 | 82.8 |
| DPS growth | 47.1 | 19 0 .5 | 121. 0 | 82.8 |
| EBIT margin | 2 0 .3 | 28.4 | 35.3 | 39.2 |
| EBITDA margin | 22.2 | 29.4 | 35.8 | 39.6 |
| Net income margin | 15.5 | 21.9 | 27.1 | 3 0 .2 |
Price Performance __________________________________________
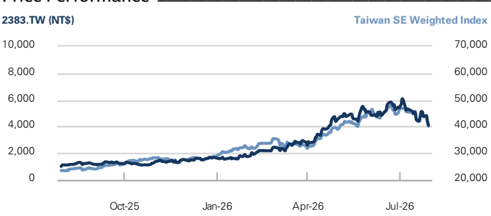
| 3m | 6m | 1 2m | |
|---|---|---|---|
| Absolute | (7.7)% | 1 29. 1 % | 303.9% |
| Rel. to the Ta i wanSE We i ghted Index | (9.4)% | 86. 1 % | 1 34. 1 % |
Source: FactSet. Price as of 29 Jul 2026 close.
Income Statement (NT$ mn) ________________________________
| 12/25 | 12/26E | 12/27E | 12/28E | |
|---|---|---|---|---|
| To t a l r e v e nu e | 9 4,260.6 | 197,643.3 | 353,024.1 | 580,049.0 |
| Co s t of good s s old | (66,140.7) | (128,144.8) | (209,475.8) | (328,155.0) |
| SG&A | (6,869.7) | (9,343.0) | (12,129.0) | (13,944.0) |
| R&D | (2,141.9) | (3,979.5) | (6,951.9) | (10,440.9) |
| Other operating inc./(exp.) | -- | -- | -- | -- |
| E BITDA | 2 0,9 57 . 5 | 58 , 1 00. 2 | 126 ,4 66 . 7 | 22 9, 58 3.3 |
| Depreciation& amortization | (1,849.3) | (1,924.3) | (1,999.3) | (2,074.3) |
| E BIT | 1 9, 1 0 8 .3 | 56 , 176 .0 | 12 4,4 67 .4 | 227 , 5 09.0 |
| Net intere s t inc./(exp.) | (178.8) | (364.2) | (335.5) | 122.0 |
| Income/(lo ss ) from a ss ociate s Pre-t axp r ofi t | -- 18 , 876 . 1 | -- 56 , 2 93. 2 | -- 12 4,4 67 .4 | -- 227 , 5 09.0 |
| (4,231.2) | (12,933.6) | (28,627.5) | (52,327.1) | |
| Provi s ion for taxe s | ||||
| Minority intere s t Preferred dividend s | 4.0 | 2.8 -- | -- -- | -- -- |
| N et inc . (p re-e xc e p t ionals) | -- 1 4, 6 4 8 .9 | 43,3 62 .4 | 9 5 , 8 39.9 | 175 , 182 .0 |
| Po s t-tax exceptional s | -- | -- | -- | -- |
| N et inc . (pos t-e xc e p t ionals) | 1 4, 6 4 8 .9 | 43,3 62 .4 | 9 5 , 8 39.9 | 175 , 182 .0 |
| E P S(basic , p re-e xc e p t ) (N T $) | 4 1 . 67 | 121 .03 | 267 . 52 | 4 88 .99 |
| E P S(dilu te d , p re-e xc e p t ) (N T $) | 4 1 . 67 | 121 .03 | 267 . 52 | 4 88 .99 |
| E P S(basic , pos t-e xc e p t ) (N T $) | 4 1 . 67 | 121 .03 | 267 . 52 | 4 88 .99 |
| E P S(dilu te d , pos t-e xc e p t ) (N T $) | 4 1 . 67 | 121 .03 | 267 . 52 | 4 88 .99 |
| DPS (NT$) | 25.00 | 72.62 | 160.51 | 293.40 |
| Div. payout ratio (%) | 60.0 | 60.0 | 60.0 | 60.0 |
| Balance Sheet (NT$ mn) | ______ | |||
| 12/25 | 12/26E | 12/27E | 12/28E | |
| C a sh& c a sh equiv a lents | 20,007.8 | 28,808.2 | 54,280.0 | 109,481.2 |
| Accounts receiv a ble | 36,581.3 | 59,563.7 | 101,554.9 | 166,863.4 |
| Inventory | 16,751.6 | 19,309.5 | 31,564.8 | 49,448.0 |
| Other current a ssets | 639.0 | 639.0 | 639.0 | 639.0 |
| Total c u rrent assets | 7 3,9 7 9. 7 | 1 0 8 ,3 2 0.4 | 188 ,03 8 . 7 | 3 26 ,43 1 . 6 |
| Net PP&E | 30,863.9 | 51,494.1 | 64,549.4 | 77,529.6 |
| Net int a ngibles | 102.8 | 48.3 | (6.2) | (60.7) |
| Tot a l investments | 0.0 | 0.0 | 0.0 | 0.0 |
| Other long-term a ssets | 2,966.2 | 2,966.2 | 2,966.2 | 2,966.2 |
| Total assets | 1 0 7 ,9 12 . 5 | 162 , 82 9.0 | 255 , 5 4 8 . 1 | 40 6 , 866 . 7 |
| Accounts p a y a ble | 24,517.5 | 36,863.6 | 60,260.2 | 94,400.8 |
| Short-term debt | 9,319.8 | 12,319.8 | 11,819.8 | 11,319.8 |
| Short-term le a se li a bilities | -- | -- | -- | -- |
| Other current li a bilities | 12,393.4 | 29,621.6 | 61,108.2 | 108,713.4 |
| Total c u rrent liabilities | 4 6 , 2 30. 7 | 78 , 8 0 5 .0 | 1 33, 188 . 1 | 21 4,434.0 |
| Long-term debt Long-term le a se li a bilities | 8,219.3 -- | 13,219.3 -- | 13,219.3 -- | 13,219.3 -- |
| Other long-term li a bilities liabilities | 3,027.3 | 3,027.3 | 16 , 2 4 6 . 6 | 3,027.3 |
| Total long-term | 11 , 2 4 6 . 6 | 16 , 2 4 6 . 6 | 3,027.3 | 16 , 2 4 6 . 6 |
| Total liabilities | 57 ,4 77 .3 | 9 5 ,0 51 . 6 | 1 49,434. 7 | 2 30, 68 0. 6 |
| Preferred sh a res Tot a l commonequity | -- 50,455.5 | -- 67,800.5 | -- 106,136.4 | -- 176,209.2 |
| Minority interest | ( 2 0.3) | ( 2 3. 1 ) | ( 2 3. 1 ) | ( 2 3. 1 ) |
| Total liabilities &eq u ity | 1 0 7 ,9 12 . 5 | 162 , 82 9.0 | 255 , 5 4 8 . 1 | 40 6 , 866 . 7 |
| Net debt, a djusted | (2,468.7) | (3,269.0) | ||
| (29,240.9) | (84,942.0) | |||
| Cash Flow (NT$ mn) | __________ | |||
| 12/25 | 12/26E | 12/27E | 12/28E | |
| Net income | 14,648 . 9 | 43,362 . 4 | 95,839 . 9 | 175,182 . 0 |
| D&Aadd-back | 1,849 . 3 | 1,924 . 3 | 1,999 . 3 | 2,074 . 3 |
| Minority interest add-back | (4 . 0) | (2 . 8) | -- | -- |
| Net (inc)/dec working capital | (8,696 . 1) | (13,194 . 3) | (30,849 . 9) | (49,051 . 1) |
| Other operating cash flow | 4,169 . 8 | -- | -- | -- |
| Cash flow from operations | 11 ,9 67 . 8 | 3 2 ,0 8 9. 6 | 66 ,9 8 9. 2 | 128 , 2 0 5 . 1 |
| C apital expenditures | (9,489 . 7) | (22,500 . 0) | (15,000 . 0) | (15,000 . 0) |
| Acquisitions | -- | -- | -- | -- |
| Divestitures | 1 . 7 | -- | -- | -- |
| Others Cash flow from investing | (399 . 5) (9, 887 . 6 ) | -- ( 22 , 5 00.0) | -- ( 15 ,000.0) | -- ( 15 ,000.0) |
| -- | ||||
| Repayment of lease liabilities pref) | -- | -- | -- | |
| Dividends paid(common& | (5,893 . 7) | (8,789 . 2) | (26,017 . 4) | (57,503 . 9) |
| Inc/(dec) in debt Other financing | 11,402 . 8 (2,569 . 8) | 8,000 . 0 0 . 0 | (500 . 0) 0 . 0 | (500 . 0) 0 . 0 |
| cash flows Cash flow from finan c ing | 2 ,939. 2 | ( 78 9. 2 ) | ( 26 , 517 .4) | ( 58 ,003.9) |
| Total c ash flow Free cash flow | 5 ,0 1 9. 5 2,478 . 1 | 8 , 8 00.4 9,589 . 6 | 25 ,4 71 . 8 51,989 . 2 | 55 , 2 0 1 . 2 113,205 . 1 |
Source: Company data, Goldman Sachs Research estimates.
e92c7a75ab8b4efbba794e6b187208c8
For the exclusive use of KEVINLU@LENOVO.COM
(5) Company mentioned its future capacity expansion has already been fully booked by end customers and it's discussing capacity with customers for after 2H28. In terms of overall capacity expansion plans, on top of the existing +5%/+51% YoY capacity growth (year-end to year-end basis) in 2026/27, the company plans to further expand 1.2mn/0.6mn sheets of monthly capacity in 1Q28/2Q28 (another 19% increase by mid 2028 vs. 2027 end capacity).
(6) In terms of the high-end CCL competition, management believe the more favorable competition landscape will be even more favorable going into the long term as CCL migrates to more advanced generation; they also don't expect competition from low-end CCL peers, which claim to be making progress with M10 CCL, will have any impact on the company. The company believes the high-end CCL shortage issue will continue for at least the next 2+ years. For M10, EMC has submitted samples for veri fi cation but does not expect the product will be adopted in foreseeable future.
(7) For switches, the company mentioned that 800G switches will remain mainstream in 2026 and start to see shipment for 1.6T switches starting in 3Q26. The company also sees upgrade in CCL for switches, migrating from M8 grade CCL (low-DK glass fi ber with HVLP3 copper foil) to M8+ grade CCL (low-DK2 glass fi ber with HVLP4 copper foil).
Investment view
We maintain our positive view on EMC, due to not only the potential better pricing outlook with the tightening supply demand conditions on the high-end high quality CCL supply (see here), but also thanks to the company's leadership position in the high GM M9 grade CCL and its good progress on penetrating into the high GM substrate CCL supply chain, while we believe all three factors above should not only drive the company's top line growth in coming years, but also imply an expanding GM/OPM outlook.
We are positive on EMC's commentary that its MP on M9 is ongoing with increasing orders and new models to adopt this high-end product, while we expect the M9 grade CCL to have the highest GM among companies' product portfolios (we expect M9 CCL GM should be 50-55%+ based on current pricing status). Considering EMC's leadership position in M9 grade CCL, we expect the company to enjoy a solid ASP expansion in 2027 and beyond considering (1) we expect the M9+ grade CCL demand will grow 2x+ YoY in 2027 and further expand in 2028 and beyond, and (2) M9 grade CCL pricing per sheet is normally 100%+ higher than M8 grade CCL. We therefore expect the company will enjoy strong revenue/GM growth in coming quarters/years even without any like for like base pricing hike.
For substrate CCL, TAM was ~US$1.3bn in 2025 per EMC (TAM is only ~40% of EMC's revenue in 2025), and if assuming the substrate CCL TAM growth rate to be in-line with ABF/BT substrate industry growth rate, the TAM will increase to US$3.4bn/US$5.5bn in 2027/28 (28%/28% of EMC's 2027/28 per GSe), suggesting a low revenue contribution even if the company can get a higher market share (was 1.6% in 2025). However, if we consider the GM of the substrate CCL during supply tightness periods can be as high as 50-70%, this new business can contribute more pro fi tability growth in coming years.
Overall, we reiterate our Buy rating on EMC with an unchanged TP of NT$10,200, considering its solid position in the AI CCL industry (which should see 100%+ revenue CAGR in at least the next 3-5 years) and its early penetration into the high margin e92c7a75ab8b4efbba794e6b187208c8
NTSmn
Revenue
Gross profit
Operating expense
Operating income
Pretax income
Taxes expense
Net income
1026
(2,601)
7.128
7,194
(1,855)
5,340
EPS, NTS
14.90
Ratio analysis and assumption
As % of sales
Gross margin
Operating expense ratio
Operating margin
Net margin
3Q26E
57,349
21.117|
(3,556)
17.561
17,561
(4,039)
13,522
37.73
36.8%
6.2%
30.6%
23.6%
29.4%
7.9%
21.6%
16.1%
2026
(3,269)
12.734
12,785
(2,914)
9,873
27.55
33.9%
6.9%
26.9%
20.9%
QoQ growth (%)
Revenue
Gross profit
Exhibit 1: P&L table
Operating income
Net income
YoY growth (%)
Revenue
Gross profit
Operating income
Net income
For the exclusive use of KEVINLU@LENOVO.COM
2Q27E
81.696
32,690
(4,616)
28.075
3Q27E
94,459
38,502
(4,912)
33.591
4Q27E
109,822
46.151
(5,162)
40.990
1Q28E
122,256
52,156
(5,502)
46,655
2Q28E
139,528
60,074
(6,000)
54.074
3Q28E
153,104
66,695
(6,277)
60.418
4Q28E
165,161
72,969
(6,606)
66.362
2025
94,261
28,120
(9,012)
19.108
2026E
197,643
69,498
(13,322)
56,176
2027E
353,024
143,548
(19,081)
124.467
2028E
580.049
(24,385)
227,509
2029E
827,957
(34,812)
339,766
4Q26E
59,952
22,649
(3,897
18.752
1Q27E
67,047
26,204
(4,392)
21,813
substrate CCL business, as well as the favorable pricing environment now in the AI CCL market, which should continue to drive EMC's pro fi tability in coming quarters/years.
40.81
60.32
46.87
Valuation
Maintain Buy on EMC, with an unchanged 12-TP of NT$10,200 (based on the same 27x 2027E EPS; in line with the peak P/E multiple for AI component suppliers in past 3 years).
4.5%
7.3%
21.8%
24.8%
11.8%
15.7%
15.6%
17.8%
16.3%
19.9%
11.3%
13.0%
14.1%
15.2%
9.7%
11.0%
7.9%
9.4%
| 44.5% | 78.6% 37.9% | 6.8% 16.3% | 28.7% | 19.6% | 22.0% | 13.8% | 15.9% | 11.7% | 9.8% | |||||||
|---|---|---|---|---|---|---|---|---|---|---|---|---|---|---|---|---|
| 42.9% | 84.9% | 37.0% | 8.2% | 14.8% 28.7% | 19.6% | 22.0% 13.8% | 15.9% | 11.7% | 9.8% | |||||||
| 52.5% | 110.0% 128.1% | 140.5% | 102.8% | 72.8% | 64.7% | 83.2% 82.3% | 70.8% | 62.1% 50.4% | 46% | 110% | 79% | 64% | 43% | |||
| 47.6% | 134.3% 178.7% | 217.9% | 169.3% | 104.3% | 82.3% 103.8% | 99.0% | 83.8% | 73.2% | 58.1% | 56% | 147% | 107% | 75% | 49% | ||
| 57.0% | 174.2% 251.9% | 280.0% | 206.0% | 120.5% | 91.3% | 118.6% 113.9% | 92.6% | 79.9% | 61.9% | 57% | 194% | 122% | 83% | 49% | ||
| 53.9% | 183.9% 241.0% | 291.4% | 214.5% | 118.9% | 91.3% 115.8% | 113.9% | 92.6% | 79.9% 61.9% | 53% | 196% | 121% | 83% | 49% |
Source: Company data, Goldman Sachs Global Investment Research
Investment Thesis & PT methodology and risks
EMC, a key supplier of high-end HDI material (70%+ market share) and SLP material (90%+ market share), has been focusing on the high-speed switch/server CCL market for 3-5+ years. We are positive on its market share trajectory in the server industry and expect EMC to increase its share from <10% in the Purley generation to 15-20%/20+% in the Whitley/Eagle Stream platforms. EMC is also proactively expanding its share in the switch market (40%/30%+ in 2024/23 vs. <5% before 2019), with an expanding AI customer base (only one 400G customer in 3Q20, to being one of the largest suppliers in 2023), which should continue to bene fi t the company's top/bottom line growth over time. We believe EMC's leading position in the AI server CCL market should drive strong revenue growth and GM/OPM expansion in the long term, given that it is the major supplier for all Nvidia/Google/AWS AI server projects, and we expect it to maintain its leadership position. Considering its leading position in the high-end CCL industry, solid production skills and earnings growth outlook, we are Buy rated on the stock. With the shares trading at a 2026E P/E below AI server component suppliers and supported by a solid growth outlook, we view valuation as attractive.
Key downside risks include: (1) RCC to replace all high-end smartphone HDI design; (2) rising trade tensions, which could lead to weaker smartphone and server shipments; and (3) rising competition from mainland China peers.
Valuation methodology: Our 12m TP of NT$10,200 is based on 27x 2H27-1H28E P/E
72.17
88.07
100.24
116.18
129.81
142.58
41.67
121.00
267.42
488.81
730.00
e92c7a75ab8b4efbba794e6b187208c8
For the exclusive use of KEVINLU@LENOVO.COM
(in line with the peak P/E multiple for AI component suppliers in the past 3 years).
Key downside risks: (1) RCC to replace all high-end smartphone HDI design; (2) rising trade tensions, which could lead to weaker smartphone and server shipments; and (3) rising competition from mainland China peers.
e92c7a75ab8b4efbba794e6b187208c8
For the exclusive use of KEVINLU@LENOVO.COM