PDF 原檔:報告_GS_元太8069_20260930_original.pdf
圖片清單(已驗證 2026-10-01)
| 檔名 | size | 分類 | 親眼所見內容 |
|---|---|---|---|
報告_GS_元太8069_20260930_001.png |
19,850B | 真資料圖 | Exhibit 1:E Ink 營收按產品別堆疊長條圖(消費性電子/IoT applications/Others)+毛利率折線(右軸),橫軸 2021–2028E |
報告_GS_元太8069_20260930_002.png |
46,628B | 真資料圖 | Exhibit 2:E Ink 月營收長條圖+YoY 折線(右軸),橫軸 2015/2–2026/8(月度資料) |
報告_GS_元太8069_20260930_003.png |
26,801B | 真資料圖 | Exhibit 7:E Ink 12 個月前瞻 PEG ratio 折線圖,橫軸 2017/1–2026/8,標示 +1 標準差 0.9x/均值 0.5x/-1 標準差 0.2x 三條水平參考線 |
報告_GS_元太8069_20260930_004.png |
15,844B | 真資料圖 | Exhibit 8:E Ink 淨利長條圖,橫軸 2017–2028E,標註「2026-28E NI CAGR at 21%」紅字與箭頭 |
報告_GS_元太8069_20260930_005.png |
33,265B | 真資料圖 | Exhibit 9:E Ink 12 個月前瞻 P/E ratio 折線圖,橫軸 2017/1–2026/8,標示 +1 標準差 27.3x/均值 19.2x/-1 標準差 11.1x 三條水平參考線 |
報告_GS_元太8069_20260930_006.png |
38,267B | 真資料圖 | Exhibit 10:E Ink QFII(外資)持股比例折線圖,橫軸 2004/3–2026/3,標註事件圈:iPad launch(43%)、Merged E Ink、Expanded to ESL(0%)、Exit LCD business(15%),圖末標示近期 43%/40% |
報告_GS_元太8069_20260930_007.png |
69,754B | 真資料圖 | GS 評等與股價目標歷史圖:股價線(淺藍,右軸 index)、目標價階梯點(深藍方塊,可見數字 282/310/385/393/334/298/254/153,左軸),橫軸標示 NA/B(Buy)/N(Neutral)評等區間,2023/09–2026 |
本份報告共 7 張圖,全數逐張 Read 確認均為真資料圖,無裝飾/文字卡。
原始內容
[讀者資訊已遮蔽]
E Ink (8069.TWO): E-paper application continues to expand; expect modest consumer electronics mix; Aug beat; Neutral
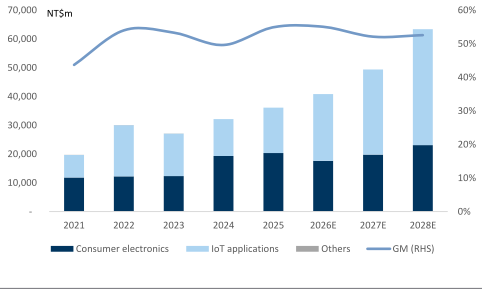
We remain positive on growing e-paper applications across e-readers, e-notes, and e-labels. However, consumer electronics end-demand could remain modest amid high memory costs. We expect E Ink's consumer electronics (e-readers, e-notes) to decline 13% YoY in 2026E (vs. +6% YoY in 2025), and recover back to +12-16% YoY in 2027E-28E; on IoT applications (ESL and Signage), we expect revenue to grow at a +32% CAGR in 2026E-28E (vs. +22% YoY in 2025), driven by rising adoption on savings of labour costs, electricity, and paper, digitalization trend, and growing ESG awareness. Signage new products could also drive revenue growth with high ASPs, despite lower GMs considering in module format to accelerate customers' adoption. Our target P/E multiple declines to 11x (vs. 13x previous TP implied 2027E P/E) on consumer electronics sector de-rating under high memory costs. Our new 12m TP is NT$142 (vs. NT$153 previously). Maintain Neutral.
Exhibit 1: E Ink revenues by product and GM trend
Source: Company data, Goldman Sachs Global Investment Research
3-month revenues preview: We expect a sequential increase in revenues through Sep-Dec, driven by e-labels, Signage ramp up, and better consumer electronics seasonality. The ongoing digitalization should support e-paper adoption; E Ink's e-labels further penetrated in Canada, serving Sobeys (retail) to deploy ESLs across 300 to 350 stores over the next 18 months (link). Overall, we expect 3Q26E / 4Q26E revenues to grow at +0% / +16% QoQ on the mix of modest consumer electronics end-demand under high memory costs, and ongoing e-labels adoption and Signage shipment ramp up.
Goldman Sachs does and seeks to do business with companies covered in its research reports. As a result, investors should be aware that the firm may have a conflict of interest that could affect the objectivity of this report. Investors should consider this report as only a single factor in making their investment decision. For Reg AC certification and other important disclosures, see the Disclosure Appendix, or go to www.gs.com/research/hedge.html. Analysts employed by non-US affiliates are not registered/qualified as research
analysts with FINRA in the U.S.
Verena Jeng
+852-2978-1681 | verena.jeng@gs.com Goldman Sachs (Asia) L.L.C.
Allen Chang +852-2978-2930 | allen.k.chang@gs.com Goldman Sachs (Asia) L.L.C.
e92c7a75ab8b4efbba794e6b187208c8
[讀者資訊已遮蔽]
Earnings revision
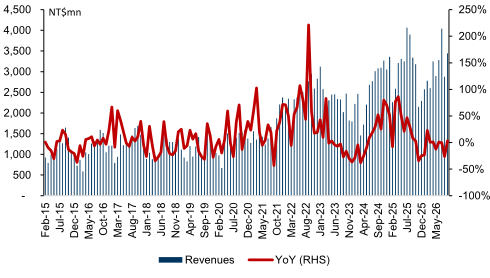
Exhibit 2: E Ink monthly revenues and YoY trend
Source: Company data, Goldman Sachs Global Investment Research
Exhibit 3: E Ink monthly preview
| Jul-26 | Aug-26 | Sep-26E | Oct-26E | Nov-26E | Dec-26E | 3Q26E | 4Q26E | |
|---|---|---|---|---|---|---|---|---|
| Rev (NT$m) | 2,876 | 3,446 | 3,855 | 3,894 | 3,933 | 3,982 | 10,178 | 11,809 |
| Rev YoY | -26% | 3% | 21% | 81% | 71% | 55% | -2% | 68% |
| Rev MoM / QoQ | -29% | 20% | 12% | 1% | 1% | 1% | 0% | 16% |
| GS estimates (NT$m) | 3,168 | 2,693 | ||||||
| Act vs. GS | -9% | 28% |
Source: Company data, Goldman Sachs Global Investment Research
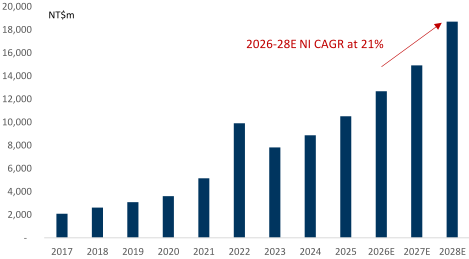
We factor in 2Q26 and Aug results and revise up our 2026E-28E net income by 15% / 10% / 8% mainly on higher gross margins, given better product mix (e-labels mainly delivered via e-paper while consumer electronics mainly via module, carry a lower GM). Overall, we expect 2026E revenues growth at +13% YoY (vs. +12% YoY in 2025A), driven by e-labels growing application and adoption, which we model to grow +47% YoY (vs. +22% YoY in 2025A), while we also expect a decline in consumer electronics under high memory costs (-13% YoY vs. +6% YoY in 2025). We continue to expect revenue growth in 2027E-28E driven by (1) rising color e-notes / e-readers enlarging size, (2) more stores adopting e-labels to save operation costs with growing outdoor signage. On GM, we increase our forecasts in 2026E-28E to reflect 2Q26 beat on better product mix.
Exhibit 4: E Ink: 2Q26 results snapshot
| NT$m | 2Q25 | 1Q26 | 2Q26 | QoQ | YoY | GS | Act vs. GS | Cons. Act vs. Cons. | Cons. Act vs. Cons. |
|---|---|---|---|---|---|---|---|---|---|
| Revenues | 10,626 | 8,633 | 10,216 | 18% | -4% | 10,133 | 1% | 10,227 | 0% |
| GP | 6,406 | 5,150 | 5,999 | 16% | -6% | 5,413 | 11% | 6,001 | 0% |
| OP | 4,202 | 2,814 | 3,542 | 26% | -16% | 2,971 | 19% | 3,561 | -1% |
| Pretax income | 2,519 | 3,398 | 5,193 | 53% | 106% | 5,193 | 0% | 4,113 | 26% |
| Net income | 2,972 | 2,785 | 3,733 | 34% | 26% | 2,839 | 32% | 3,353 | 11% |
| Margins | |||||||||
| GM | 60.3% | 59.7% | 58.7% | 53.4% | 58.7% | ||||
| OPM | 39.5% | 32.6% | 34.7% | 29.3% | 34.8% | ||||
| NM | 28.0% | 32.3% | 36.5% | 28.0% | 32.8% |
Source: Company data, Goldman Sachs Global Investment Research
e92c7a75ab8b4efbba794e6b187208c8
[讀者資訊已遮蔽]
Exhibit 5: Earnings revision
| NT m | 2026E - Old | 2026E - New | 2026E - Chg | 2027E - Old | 2027E - New | 2027E - Chg | 2028E - Old | 2028E - New | 2028E - Chg |
|---|---|---|---|---|---|---|---|---|---|
| Revenues | 40,344 | 40,836 | 1% | 51,641 | 49,395 | -4% | 67,764 | 63,405 | -6% |
| GP | 21,102 | 21,913 | 4% | 26,438 | 25,741 | -3% | 34,714 | 33,330 | -4% |
| OP | 11,445 | 12,391 | 8% | 15,013 | 15,664 | 4% | 20,212 | 20,395 | 1% |
| Net income | 10,995 | 12,675 | 15% | 13,596 | 14,914 | 10% | 17,328 | 18,707 | 8% |
| Margins | |||||||||
| GM | 52.3% | 53.7% | 51.2% | 52.1% | 51.2% | 52.6% | |||
| OPM | 28.4% | 30.3% | 29.1% | 31.7% | 29.8% | 32.2% | |||
| NM | 27.3% | 31.0% | 26.3% | 30.2% | 25.6% | 29.5% |
Source: Company data, Goldman Sachs Global Investment Research
Exhibit 6: E Ink P&L
| NT$ m | 2023 | 2024 | 2025 | 2026E | 2027E | 2028E | 1Q25 | 2Q25 | 3Q25 | 4Q25 | 1Q26 | 2Q26 | 3Q26E | 4Q26E |
|---|---|---|---|---|---|---|---|---|---|---|---|---|---|---|
| Income statement | ||||||||||||||
| Revenue | 27,120 | 32,163 | 36,116 | 40,836 | 49,395 | 63,405 | 8,059 | 10,626 | 10,415 | 7,016 | 8,633 | 10,216 | 10,178 | 11,809 |
| Gross profit | 14,456 | 15,965 | 19,833 | 21,913 | 25,741 | 33,330 | 4,208 | 6,406 | 5,830 | 3,390 | 5,150 | 5,999 | 4,800 | 5,963 |
| OP income | 7,285 | 7,619 | 10,674 | 12,391 | 15,664 | 20,395 | 2,147 | 4,202 | 3,637 | 688 | 2,814 | 3,542 | 2,612 | 3,424 |
| Net income | 7,814 | 8,867 | 10,515 | 12,675 | 14,914 | 18,707 | 2,197 | 2,972 | 4,228 | 1,119 | 2,785 | 3,733 | 2,754 | 3,403 |
| EPS, diluted (NT$) | 6.78 | 7.67 | 9.09 | 10.95 | 12.88 | 16.16 | 1.90 | 2.57 | 3.65 | 0.97 | 2.40 | 3.22 | 2.38 | 2.94 |
| Margins | ||||||||||||||
| Gross margin | 53.3% | 49.6% | 54.9% | 53.7% | 52.1% | 52.6% | 52.2% | 60.3% | 56.0% | 48.3% | 59.7% | 58.7% | 47.2% | 50.5% |
| Operating margin | 26.9% | 23.7% | 29.6% | 30.3% | 31.7% | 32.2% | 26.6% | 39.5% | 34.9% | 9.8% | 32.6% | 34.7% | 25.7% | 29.0% |
| Net margin | 28.8% | 27.6% | 29.1% | 31.0% | 30.2% | 29.5% | 27.3% | 28.0% | 40.6% | 15.9% | 32.3% | 36.5% | 27.1% | 28.8% |
| Ratios | ||||||||||||||
| Opex ratio | 26.4% | 25.9% | 25.4% | 23.3% | 20.4% | 20.4% | 25.6% | 20.7% | 21.0% | 38.5% | 27.1% | 24.1% | 21.5% | 21.5% |
| Tax rate | 19.9% | 18.0% | 17.7% | 17.5% | 19.0% | 20.0% | 21.5% | 12.9% | 18.4% | 19.1% | 16.3% | 17.9% | 17.9% | 17.9% |
| YoY | ||||||||||||||
| Revenue | -10% | 19% | 12% | 13% | 21% | 28% | 43% | 39% | 13% | -27% | 7% | -4% | -2% | 68% |
| Gross profit | -11% | 10% | 24% | 10% | 17% | 29% | 57% | 76% | 31% | -35% | 22% | -6% | -18% | 76% |
| OP income | -21% | 5% | 40% | 16% | 26% | 30% | 158% | 166% | 52% | -76% | 31% | -16% | -28% | 398% |
| Net income | -21% | 13% | 19% | 21% | 18% | 25% | 66% | 47% | 111% | -68% | 27% | 26% | -35% | 204% |
| QoQ | ||||||||||||||
| Revenue | -17% | 32% | -2% | -33% | 23% | 18% | 0% | 16% | ||||||
| Gross profit | -19% | 52% | -9% | -42% | 52% | 16% | -20% | 24% | ||||||
| OP income | -24% | 96% | -13% | -81% | 309% | 26% | -26% | 31% | ||||||
| Net income | -38% | 35% | 42% | -74% | 149% | 34% | -26% | 24% |
Source: Company data, Goldman Sachs Global Investment Research
Valuation
We continue to derive our 12m TP based on a near-term P/E. We derive our target P/E via E Ink's avg. 12m forward PEG ratio since 2017. With largely the same PEG ratio of 0.5x, 22% forward year earnings growth (vs. 26% previously), our new target P/E is at 11x (vs. 13x our TP implied 2027E P/E previously). The new target P/E of 11x is largely in line with the company's avg.-1stv. P/E, reflecting the consumer electronics sector de-rating under high memory costs. Our new 12m target price is NT$142 (vs. NT$153 previously). Maintain Neutral.
e92c7a75ab8b4efbba794e6b187208c8
[讀者資訊已遮蔽]
Exhibit 7: E Ink 12M forward PEG ratio
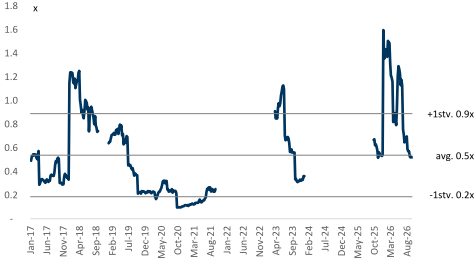
Exhibit 8: E Ink net income trend
Source: Company data, Goldman Sachs Global Investment Research
Exhibit 9: E Ink 12M forward P/E ratio
Source: Company data, Goldman Sachs Global Investment Research
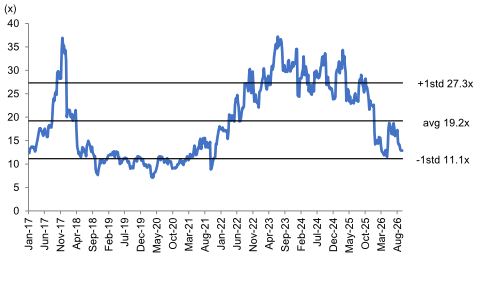
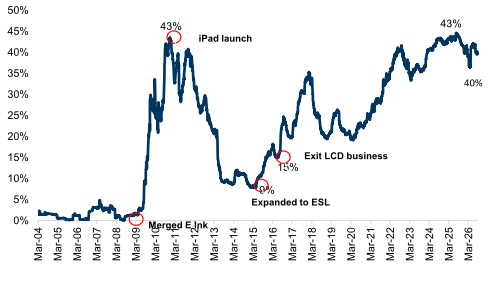
Exhibit 10: E Ink QFII holdings
Source: Company data, Goldman Sachs Global Investment Research, Bloomberg
Source: TEJ
Price target methodology and risks - E Ink
Valuation methodology: We are Neutral rated on E Ink. Our 12m target price for E Ink is based on a near-term P/E, consistent with our Taiwan Technology coverage. Our 12-m TP of NT$142 is based on a target P/E multiple of 11x forward year EPS (2027E). Our target P/E multiple of 11x is derived from the company's avg. PEG since 2017 (0.5x), as we expect macro uncertainties to reduce the visibility of e-paper adoption, while we remain positive in the long term: technology upgrades (colour, larger sizes) to unlock the e-paper market potential.
Upside / Downside risks: (1) Faster- / slower-than-expected e-readers / e-notes penetration rate, (2) Faster- / slower-than-expected ESL adoption rate, (3) Fiercer- / healthier-than-expected competition, which could be driven by competition from other technology gadgets (e.g. AI / AR glasses, AI PCs, tablets, smart watches, etc.) or new entrants in e-paper industry.
e92c7a75ab8b4efbba794e6b187208c8
[讀者資訊已遮蔽]
| 8069.TWO | 12m Price Target: NT$142.00 | 12m Price Target: NT$142.00 | Price: NT$142.50 | Downside: | 0.4% |
|---|---|---|---|---|---|
| Neutral | GS Forecast | ||||
| Market cap: NT$165.0bn / $5.2bn Enterprise value: NT$165.4bn / $5.2bn 3m ADTV: NT$1.5bn / $45.9mn Taiwan Greater China Technology M&A Rank: 3 Leases incl. in net debt & EV?: Yes | Revenue (NT$ mn) New Revenue (NT$ mn) Old EBITDA (NT$ mn) EPS (NT$) New EPS (NT$) Old P/E (X) | 12/25 36,115.8 | 12/26E 40,836.0 40,343.8 14,630.5 10.98 9.55 13.0 2.2 5.0 | 12/27E 49,395.4 | 12/28E 63,405.2 |
| Market cap: NT$165.0bn / $5.2bn Enterprise value: NT$165.4bn / $5.2bn 3m ADTV: NT$1.5bn / $45.9mn Taiwan Greater China Technology M&A Rank: 3 Leases incl. in net debt & EV?: Yes | 36,115.8 | 51,641.2 | 67,764.4 | ||
| Market cap: NT$165.0bn / $5.2bn Enterprise value: NT$165.4bn / $5.2bn 3m ADTV: NT$1.5bn / $45.9mn Taiwan Greater China Technology M&A Rank: 3 Leases incl. in net debt & EV?: Yes | 12,435.2 | 18,244.1 | 23,041.9 | ||
| Market cap: NT$165.0bn / $5.2bn Enterprise value: NT$165.4bn / $5.2bn 3m ADTV: NT$1.5bn / $45.9mn Taiwan Greater China Technology M&A Rank: 3 Leases incl. in net debt & EV?: Yes | 9.14 | 12.92 | 16.21 | ||
| Market cap: NT$165.0bn / $5.2bn Enterprise value: NT$165.4bn / $5.2bn 3m ADTV: NT$1.5bn / $45.9mn Taiwan Greater China Technology M&A Rank: 3 Leases incl. in net debt & EV?: Yes | 9.14 | 11.81 | 15.06 | ||
| Market cap: NT$165.0bn / $5.2bn Enterprise value: NT$165.4bn / $5.2bn 3m ADTV: NT$1.5bn / $45.9mn Taiwan Greater China Technology M&A Rank: 3 Leases incl. in net debt & EV?: Yes | 25.6 | 11.0 | 8.8 | ||
| Market cap: NT$165.0bn / $5.2bn Enterprise value: NT$165.4bn / $5.2bn 3m ADTV: NT$1.5bn / $45.9mn Taiwan Greater China Technology M&A Rank: 3 Leases incl. in net debt & EV?: Yes | P/B (X) | 3.9 | 2.1 | 1.9 | |
| Market cap: NT$165.0bn / $5.2bn Enterprise value: NT$165.4bn / $5.2bn 3m ADTV: NT$1.5bn / $45.9mn Taiwan Greater China Technology M&A Rank: 3 Leases incl. in net debt & EV?: Yes | Dividend yield (%) | 2.5 | 5.8 | 7.3 | |
| Market cap: NT$165.0bn / $5.2bn Enterprise value: NT$165.4bn / $5.2bn 3m ADTV: NT$1.5bn / $45.9mn Taiwan Greater China Technology M&A Rank: 3 Leases incl. in net debt & EV?: Yes | CROCI (%) | 26.0 | 36.9 | 40.1 | 49.0 |
| Market cap: NT$165.0bn / $5.2bn Enterprise value: NT$165.4bn / $5.2bn 3m ADTV: NT$1.5bn / $45.9mn Taiwan Greater China Technology M&A Rank: 3 Leases incl. in net debt & EV?: Yes | 6/26 | 9/26E | 12/26E | 3/27E | |
| Market cap: NT$165.0bn / $5.2bn Enterprise value: NT$165.4bn / $5.2bn 3m ADTV: NT$1.5bn / $45.9mn Taiwan Greater China Technology M&A Rank: 3 Leases incl. in net debt & EV?: Yes | EPS (NT$) | 3.23 | 2.39 | 2.95 | 2.26 |
Source: Company data, Goldman Sachs Research estimates, FactSet. Price as of 29 Sep 2026 close.
e92c7a75ab8b4efbba794e6b187208c8
[讀者資訊已遮蔽]