PDF 原檔:報告_GS_信驊5274_20260728_original.pdf
圖片清單(已驗證 2026-07-29)
| 檔名 | size | 分類 | 親眼所見內容 |
|---|---|---|---|
報告_GS_信驊5274_20260728_001.png |
135KB | 文字卡 | 封面卡:分析師聯絡資訊(Evelyn Yu / Allen Chang / Ryan Huang)、Key Data 表、GS Forecast 數字表(12/25-12/28E 營收/EPS/PE等)、底部「GS Factor Profile」四項百分位橫條圖(Growth/Financial Returns/Multiple/Integrated) |
報告_GS_信驊5274_20260728_002.png |
41KB | 真資料圖 | 「Price Performance」股價相對走勢折線圖,5274.TWO(深藍)vs Taiwan SE Weighted Index(淺藍),時間軸 Oct-25 至 Jul-26,下方 3m/6m/12m 絕對與相對報酬率表 |
報告_GS_信驊5274_20260728_003.png |
46KB | 真資料圖 | 營收分類堆疊長條圖 2014-2028E(PC/AV extension、Others、PFR IC、I/O expander、Traditional BMC、Mini BMC、SMC+eFPGA)疊加 YoY% 折線 |
報告_GS_信驊5274_20260728_004.png |
33KB | 真資料圖 | 營收長條圖(深藍)+ OpM% 折線(灰)2014-2028E,Y軸雙軸 |
報告_GS_信驊5274_20260728_005.png |
38KB | 真資料圖 | Aspeed traditional BMC shipment(k units,深藍長條)vs US CSP capex(US$bn,淺藍折線)2013-2028E |
報告_GS_信驊5274_20260728_006.png |
38KB | 真資料圖 | Aspeed traditional BMC shipment(淺藍長條)+ YoY%(灰折線)2013-2028E |
報告_GS_信驊5274_20260728_007.png |
36KB | 真資料圖 | Taiex(灰線,左軸)vs Aspeed(深藍線,右軸 NT$)股價走勢 2016-2026 |
報告_GS_信驊5274_20260728_008.png |
34KB | 真資料圖 | Forward P/E 走勢圖,股價折線疊加 20x/35x/50x/65x/80x 虛線本益比帶,2016-2026 |
報告_GS_信驊5274_20260728_009.png |
38KB | 真資料圖 | Forward P/B 走勢圖,股價折線疊加 25x/35x/45x/55x/65x 虛線本淨比帶,2016-2026 |
報告_GS_信驊5274_20260728_010.png |
37KB | 真資料圖 | ROE%(灰底色區塊,左軸)vs Forward P/B(深藍折線,右軸)雙軸圖,2016-2026 |
報告_GS_信驊5274_20260728_011.png |
82KB | 真資料圖 | 「Goldman Sachs rating and stock price target history」股價走勢圖疊加歷次目標價數字標籤(3880/4200/4600/5500/5800/6100/5300/4700/6000/5850/3700/7300/12000/15000/20000/22000)與評等區間(NA/B)色帶,2023-2026 |
原始內容
For the exclusive use of KEVINLU@LENOVO.COM
Aspeed (5274.TWO)
Multiple growth drivers ahead with risk reward incrementally skewed to the upside; reiterate Buy
5 2 74.TWO
12m Pri c e Target:
NT$ 22 ,000.00
Stronger outlook into 3Q26
Aspeed will report its 2Q26 results on Aug 5. It previously reported June 2026 revenue of NT$1,310mn, bringing total 2Q26 revenue to NT$3,871mn (+23% QoQ, +72% YoY), which came in 3% above GSe and also exceeded company's high-end range of guidance by 8%. On the margin front, we estimate 2Q26E GM at 69.6% (vs. 69.2% in 1Q26; vs. guidance of 67-68%), as we believe Aspeed is passing through higher substrate and OSAT costs via pricing adjustments. Looking ahead to 3Q26E, we now expect revenue growth to strengthen further to 22% QoQ (vs. 14% QoQ previously), as substrate bottlenecks begin to ease and customer demand remains resilient, while GM should hold at a similar level of 69.5%.
Multiple drivers underpin a robust growth trajectory
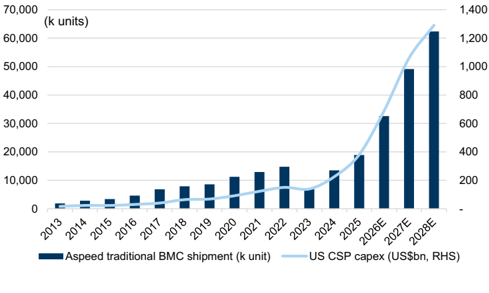
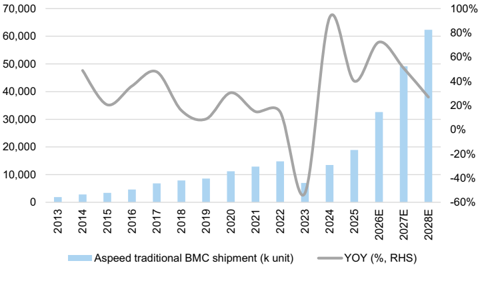
We remain constructive on Aspeed's underlying demand trends, with customer order visibility extending and some orders already placed for 2027. Overall, we continue to see a favorable setup for Aspeed's earnings outlook, driven by 1) stronger agentic AI demand, where we see potential upside to AI-related general server BMC demand vs. management's prior guidance of around 8.5mn/12.3mn in 2026/2027E, supported by robust in-house CPU and general server CPU demand; 2) accelerating AI ASIC deployments with new market share gain for US AI ASIC customer; 3) rising AST2700 adoption, with the AST2700 now expected to account for 5%/22%/38% of traditional BMC shipments in 2026-2028E; and 4) easing supply chain bottlenecks, as E-glass quali fi cation nears completion and a new OSAT partner is expected to be introduced in 4Q26. Overall, we raise Aspeed's traditional BMC shipment forecast to 32.6mn/49.1mn/62.4mn in 2026-2028E (vs. 29.5mn/41.6mn/52.8mn previously), supporting a stronger revenue growth trajectory of 98%/85%/51% YoY in 2026-2028E (vs. 81%/77%/58% YoY previously).
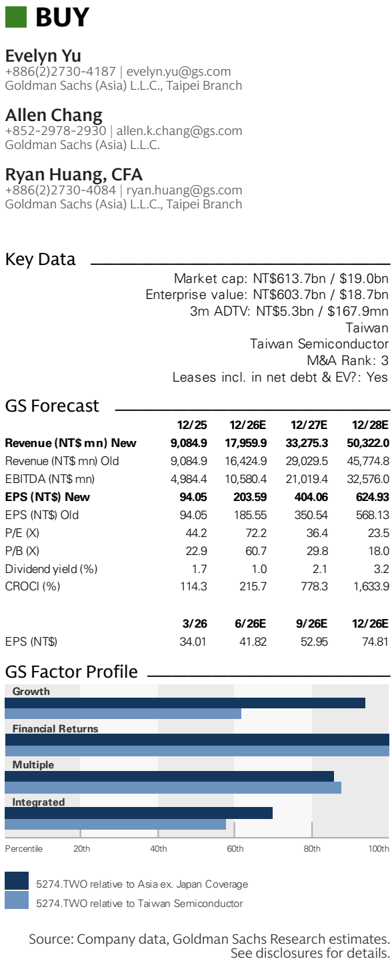
Key Data _____________________________________
Market cap: NT$613.7bn / $19.0bn
Enterprise value: NT$603.7bn / $18.7bn
3m ADTV: NT$5.3bn / $167.9mn
Taiwan
Taiwan Semiconductor
M&A Rank: 3
Leases incl. in net debt & EV?: Yes
| GS Forecast | 12/25 | __________ 12/26E | 12/27E | 12/28E |
|---|---|---|---|---|
| Revenue(NT$mn) New | 9,084.9 | 17,959.9 | 33,275.3 | 50,322.0 |
| Revenue (NT$ mn) Old | 9,084.9 | 16,424.9 | 29,029.5 | 45,774.8 |
| EBITDA (NT$ mn) | 4,984.4 | 10,580.4 | 21,019.4 | 32,576.0 |
| EPS(NT$) New | 94.05 | 203.59 | 404.06 | 624.93 |
| EPS (NT$) Old | 94.05 | 185.55 | 350.54 | 568.13 |
| P/E (X) | 44.2 | 72.2 | 36.4 | 23.5 |
| P/B (X) | 22.9 | 60.7 | 29.8 | 18.0 |
| Dividend yield (%) | 1.7 | 1.0 | 2.1 | 3.2 |
| CROCI (%) | 114.3 | 215.7 | 778.3 | 1,633.9 |
| 3/26 | 6/26E | 9/26E | 12/26E | |
| EPS (NT$) | 34.01 | 41.82 | 52.95 | 74.81 |
Goldman Sachs does and seeks to do business with companies covered in its research reports. As a result, investors should be aware that the fi rm may have a con fl ict of interest that could a ff ect the objectivity of this report. Investors should consider this report as only a single factor in making their investment decision. For Reg AC certi fi cation and other important disclosures, see the Disclosure Appendix, or go to www.gs.com/research/hedge.html. Analysts employed by non-US a ffi liates are not registered/quali fi ed as research analysts with FINRA in the U.S.
Pri
c
e:
NT$14,695.00
Upside:
49.7%
e92c7a75ab8b4efbba794e6b187208c8
For the exclusive use of KEVINLU@LENOVO.COM
BUY
Aspeed (5274.TWO)
Rating since Mar 17, 2024
Ratios & Valuation __________________________________________
| 12/25 | 12/26E | 12/27E | 12/28E | |
|---|---|---|---|---|
| P/E (X) | 44.2 | 72.2 | 36.4 | 23.5 |
| P/B (X) | 22.9 | 60.7 | 29.8 | 18.0 |
| FCF yield (%) | 2.4 | 1.2 | 2.8 | 4.5 |
| EV/EBITD A R(X) | 33.7 | 56.8 | 28.1 | 17.7 |
| EV/EBITD A (excl. leases) (X) | 33.7 | 56.8 | 28.1 | 17.7 |
| CROCI (%) | 114.3 | 215.7 | 778.3 | 1,633.9 |
| ROE (%) | 59.5 | 96.0 | 109.9 | 95.5 |
| Net debt/equity (%) | (76.5) | (98.6) | (101.2) | (104.8) |
| Net debt/equity (excl. leases) (%) | (76.5) | (98.6) | (101.2) | (104.8) |
| I n te r est c ov e r (X) | 693.8 | 2,159.8 | 3,601.9 | 5,765.1 |
| Days i nv e n t or y o utst, sales | 12.8 | 10.1 | 8.3 | 7.6 |
| Recei v able days | 62.9 | 63.4 | 54.7 | 50.9 |
| Days p ayable o utsta n di ng | 181.1 | 261.7 | 252.3 | 242.5 |
| DuP on t ROE (%) | 51.9 | 84.1 | 81.9 | 76.7 |
| Tu rnov e r (X) | 0.9 | 1.0 | 1.1 | 1.1 |
| L e v e r a g e (X) | 1.4 | 1.8 | 1.4 | 1.4 |
| Gro ss cas h i nv ested (ex cas h ) (NT $ ) | 3,499.1 | 2,218.2 | 2,149.4 | 1,052.2 |
| Av e r a g e ca p ital e mp l o yed (NT $ ) | 1,881.2 | 959.5 | (50.6) | (926.4) |
| BVP S (NT $ ) | 182.06 | 242.07 | 493.40 | 815.20 |
Growth & Margins (%) ______________________________________
| 12/25 | 12/26E | 12/27E | 12/28E | |
|---|---|---|---|---|
| Total revenue growth | 40 . 6 | 97 . 7 | 85 . 3 | 51 . 2 |
| EBITDA growth | 57 . 0 | 112 . 3 | 98 . 7 | 55 . 0 |
| EPS growth | 52 . 0 | 116 . 5 | 98 . 5 | 54 . 7 |
| DPS growth | 49 . 1 | 116 . 5 | 98 . 5 | 54 . 7 |
| EBIT margin | 51 . 3 | 56 . 9 | 62 . 3 | 64 . 2 |
| EBITDA margin | 54 . 9 | 58 . 9 | 63 . 2 | 64 . 7 |
| Net income margin | 43 . 2 | 47 . 1 | 50 . 5 | 51 . 6 |
Price Performance __________________________________________
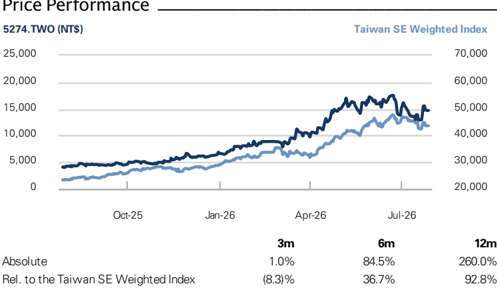
Source: FactSet. Price as of 27 Jul 2026 close.
Income Statement (NT$ mn) ________________________________
12/25
9,084
.
9
(2,906
.
2)
(476
.
4)
(1,042
0)
.
--
4,9
8
4.4
(324
.
0)
4,
66
0.3
146
.
6
--
4,
855
.4
(927
.
6)
--
--
27
.
8
--
3,9
27
.
8
94.0
5
94.0
5
94.0
5
94.0
5
70
.
56
75
.
0
12/26E
17,959
.
9
(5,473
9)
.
(756
.
9)
(1,502
.
1)
--
1
0,
58
0.4
(353
1
4)
.
0,
227
.0
134
.
5
--
0,49
1
1
.
(2,025
8
,4
8
,4
7
.
7)
--
--
66
.
1
--
66
2
.
1
03.
5
2
9
03.
5
2
9
03.
5
2
9
03.
5
9
152
.
73
75
.
0
12/27E
33,275
3
.
(9,645
7)
.
(1,083
.
2)
(1,832
.
5)
--
21
,0
1
9.4
(305
2
.
5)
0,
3.9
71
139
.
1
--
2
1
9.
0,9
(4,117
16
,
8
0
8
.
8)
--
--
2
.0
--
16
,
0
2
8
.0
404.0
6
404.0
6
404.0
6
404.0
6
303
.
12
75
.
0
)
.
/(exp
a
To
e
t
l
v
nu
e
e
r
Cost of goods sold
SG&A
R&D
Other operating inc
.
E
BITDA
Depreciation & amortization
E
BIT
Net interest inc
.
)
.
/(exp
Income/(loss) from associates
Pre-tax pro
t
fi
Provision for taxes
Minority interest
Preferred dividends
N
pre-ex
c
i
o
(
.
et inc
ept
Post-tax exceptionals
N
ept po
t-ex
c
et inc
.
(
s
E
P
E
E
S
P
P
(b
a
S
S
sic
(dilu
o
i
, pre-ex te
(b
a
c
n
a
ls)
n
ept
d
a
ls)
)
(N
, pre-ex sic
c
, po
E
P
S
(dilu
s
t-ex te
d
DPS (NT$)
Div payout ratio (%)
.
3
2
12/28E
50,322
0
.
(14,458
.
8)
(1,376
.
1)
(2,191
3
2
,
.
2)
--
576
.0
(280
3
.
1)
2
5
2
,
9
.9
138
.
7
--
,
5
0
1
.4
(6,515
25
,9
25
,9
.
0)
--
--
86
.4
--
86
.4
62
4.93
62
4.93
62
4.93
62
4.93
468
.
81
75
.
0
Balance Sheet (NT$ mn) ____________________________________
| 12/25 | 12/26E | 12/27E | 12/28E | |
|---|---|---|---|---|
| C a sh& c a sh equiv a lents | 5, 7 88.3 | 9 , 9 2 9 .3 | 20, 7 54.6 | 35,513.6 |
| Accounts receiv a ble | 1,642.1 | 4,5 9 6.4 | 5,386.1 | 8,65 9 .0 |
| Inventory | 2 79 . 7 | 7 12.0 | 80 7 . 7 | 1,2 77 .4 |
| Other current a ssets | 6 9 8.2 | 7 46.8 | 7 46.8 | 7 46.8 |
| Total current assets | 8 ,40 8 . 2 | 15 ,9 8 4. 6 | 27 , 6 9 5 . 2 | 4 6 , 1 9 6 . 8 |
| Net PP&E | 40 9 .0 | 3 9 5.5 | 303.0 | 23 9 .5 |
| Net int a ngibles | 60 7 . 7 | 4 7 5.2 | 342.2 | 205.5 |
| Tot a l investments | 208. 9 | 20 9 .4 | 20 9 .4 | 20 9 .4 |
| Other long-term a ssets | 6 99 .8 | 6 9 1.1 | 6 9 1.1 | 6 9 1.1 |
| Total assets | 1 0,333. 7 | 17 , 755 . 8 | 2 9, 2 40. 8 | 4 7 , 5 4 2 .3 |
| Accounts p a y a ble | 1,6 79 . 7 | 6,1 7 0.3 | 7 ,164.5 | 12,044.3 |
| Short-term debt | 0.0 | 0.0 | 0.0 | -- |
| Short-term le a se li a bilities | -- | -- | -- | -- |
| Other current li a bilities | 7 63. 9 | 1,1 97 .4 | 1,23 7 .4 | 1,2 77 .4 |
| Total current liabilities | 2 ,443. 6 | 7 ,3 67 . 7 | 8 ,40 1 . 8 | 1 3,3 21 . 7 |
| Long-term debt | -- | -- | -- | -- |
| Long-term le a se li a bilities | -- | -- | -- | -- |
| Other long-term li a bilities | 31 9 .3 | 322.1 | 322.1 | 322.1 |
| Total long-term liabilities | 3 1 9.3 | 3 22 . 1 | 3 22 . 1 | 3 22 . 1 |
| Total liabilities | 2 , 762 .9 | 7 , 68 9. 8 | 8 , 72 4.0 | 1 3, 6 43. 8 |
| Preferred sh a res | -- | -- | -- | -- |
| Tot a l commonequity | 7 ,5 7 0.8 | 10,066.0 | 20,516. 9 | 33,8 9 8.6 |
| Minority interest | -- | -- | -- | -- |
| Total liabilities &equity | 1 0,333. 7 | 17 , 755 . 8 | 2 9, 2 40. 8 | 4 7 , 5 4 2 .3 |
| Net debt, a djusted | (5, 7 88.3) | ( 9 , 9 2 9 .3) | (20, 7 54.6) | (35,513.6) |
Cash Flow (NT$ mn) ________________________________________
| Cash Flow (NT$ mn) | 12/25 | 12/26E | 12/27E | 12/28E |
|---|---|---|---|---|
| Net income | 3,927.8 | 8,466.1 | 16,802.0 | 25,986.4 |
| D&Aadd-back | 324.0 | 353.4 | 305.5 | 280.1 |
| Minority interest add-back | -- | -- | -- | -- |
| Net (inc)/dec working capital | 397.6 | 1,103.9 | 108.8 | 1,137.1 |
| Other operating cash flow | (153.6) | (2,544.9) | -- | -- |
| Cash flow fro m operations | 4 , 4 9 5 .9 | 7 ,3 78 . 5 | 17 , 216 . 4 | 27 , 4 03. 6 |
| Capital expenditures | (274.1) | (261.2) | (40.0) | (40.0) |
| Acquisitions | -- | -- | -- | -- |
| Di v estitures | -- | -- | -- | -- |
| Others | (120.6) | (36.1) | -- | -- |
| Cash flow fro m investing | (39 4 . 7 ) | ( 2 9 7 .3) | ( 4 0.0) | ( 4 0.0) |
| Repayment of lease liabilities | -- | -- | -- | -- |
| Di v idends paid(common& pref) | (1,966.7) | (2,946.6) | (6,351.1) | (12,604.7) |
| Inc/(dec) in debt | 0.0 | -- | -- | -- |
| Other financing cash flows | (5.5) | 6.5 | 0.0 | 0.0 |
| Cash flow fro m financing | ( 1 ,9 72 . 2 ) | ( 2 ,9 4 0. 1 ) | ( 6 ,3 51 . 1 ) | ( 12 , 6 0 4 . 7 ) |
| Total cash flow | 2 , 12 9.0 | 4 , 141 . 1 | 1 0, 825 .3 | 14 , 758 .9 |
| Free cash flow | 4,221.8 | 7,117.3 | 17,176.4 | 27,363.6 |
Source: Company data, Goldman Sachs Research estimates.
ept
c
$)
T
)
ept
, po
s
(N
)
T
(N
t-ex
c
$)
T
$)
ept
)
(N
T
$)
3,9
e92c7a75ab8b4efbba794e6b187208c8
For the exclusive use of KEVINLU@LENOVO.COM
AST1840 unlocks new growth opportunities
Aspeed had previously announced its new AST1840 chip, developed jointly with Lattice, which integrates FPGA functionality directly into Aspeed's chip. Notably, management believes AST1840's long-term shipment opportunity could eventually be comparable to the traditional BMC market, with volume production expected by 2H27. We expect that AST1840 will begin contributing to Aspeed's revenue starting 2H27, with GM being inline with the corporate average. We believe both CSP and enterprise customers are incentivized to adopt AST1840, as it strengthens FPGA cybersecurity, improves spacing e ffi ciency, and simpli fi es routing designs. Overall, we view AST1840 as a new potential growth driver of Aspeed and a potential catalyst for content expansion across future server designs.
Risk-reward incrementally attractive
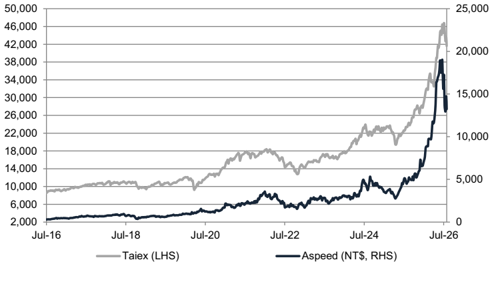
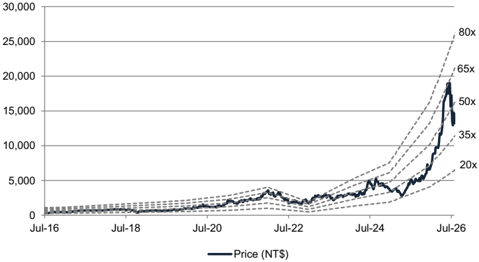
Aspeed's shares have declined -31% from their recent peak in June (vs. TAIEX's -13%). We believe this weakness largely re fl ects softer AI sentiment, with investors likely taking pro fi t in high-PE names. However, we believe Aspeed's BMC business remains solid, as traditional BMC shipments are expected to come in much stronger than previously anticipated, with customer visibility extending into 2027, underpinned by the proliferation of agentic AI. Aspeed now trades at 33x GSe FY27E EPS, well below its past 5-year average forward P/E of 50x. Overall, we revise up Aspeed's 2026-2028E earnings by 10-15% and raise our 12m TP to NT$22,000 from NT$20,000 . With c.66% implied upside as of Jul 28 close price, we view the risk-reward as incrementally skewed to the upside and reiterate our Buy rating on Aspeed.
Exhibit 1: We expect Aspeed's revenue to accelerate over 2025-2027E
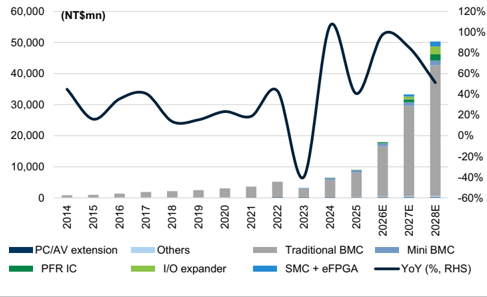
Source: Company data, Goldman Sachs Global Investment Research
Exhibit 2: Clear OPM expansion trend as revenue accelerates
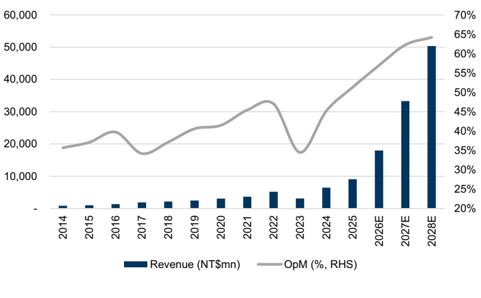
Source: Company data, Goldman Sachs Global Investment Research
e92c7a75ab8b4efbba794e6b187208c8
For the exclusive use of KEVINLU@LENOVO.COM
Exhibit 3: Aspeed traditional BMC shipment vs. Top 4 US CSP capex
Source: Company data, Goldman Sachs Global Investment Research
Exhibit 4: Aspeed traditional BMC shipment forecast
Source: Company data, Goldman Sachs Global Investment Research
e92c7a75ab8b4efbba794e6b187208c8
For the exclusive use of KEVINLU@LENOVO.COM
Earnings changes, valuation and risks
Forecast changes
We revise up our 2026-2028E EPS estimates by 10%/15%/10% as we factor in 1) stronger 2Q26 revenue, 2) higher BMC shipment forecast, and 3) new AST1840 opportunities.
Exhibit 5: Earnings revisions
| 2026E | 2026E | 2026E | 2027E | 2027E | 2027E | 2028E | 2028E | 2028E | |
|---|---|---|---|---|---|---|---|---|---|
| (NT$mn) | Old | New | Diff (%) | Old | New | Diff (%) | Old | New | Diff (%) |
| Revenue | 16,425 | 17,960 | 9.3% | 29,030 | 33,275 | 14.6% | 45,775 | 50,322 | 9.9% |
| Gross profit | 11,481 | 12,486 | 8.8% | 20,804 | 23,630 | 13.6% | 32,953 | 35,863 | 8.8% |
| Op. income | 9,219 | 10,227 | 10.9% | 17,826 | 20,714 | 16.2% | 29,153 | 32,296 | 10.8% |
| Net income | 7,716 | 8,466 | 9.7% | 14,577 | 16,802 | 15.3% | 23,625 | 25,986 | 10.0% |
| EPS (NT$) | 185.55 | 203.59 | 9.7% | 350.54 | 404.06 | 15.3% | 568.13 | 624.93 | 10.0% |
| GM | 69.9% | 69.5% | -0.4% | 71.7% | 71.0% | -0.7% | 72.0% | 71.3% | -0.7% |
| OpM | 47.6% | 56.9% | 9.4% | 61.4% | 62.3% | 0.8% | 63.7% | 64.2% | 0.5% |
| NM | 47.0% | 47.1% | 0.2% | 50.2% | 50.5% | 0.3% | 51.6% | 51.6% | 0.0% |
| 2Q26E | 2Q26E | 2Q26E | 3Q26E | 3Q26E | 3Q26E | 4Q26E | 4Q26E | 4Q26E | |
|---|---|---|---|---|---|---|---|---|---|
| (NT$mn) | Old | New | Diff (%) | Old | New | Diff (%) | Old | New | Diff (%) |
| Revenue | 3,763 | 3,871 | 2.9% | 4,286 | 4,714 | 10.0% | 5,229 | 6,228 | 19.1% |
| Gross profit | 2,614 | 2,696 | 3.1% | 3,002 | 3,278 | 9.2% | 3,687 | 4,336 | 17.6% |
| Op. income | 2,050 | 2,130 | 3.9% | 2,415 | 2,690 | 11.4% | 3,096 | 3,748 | 21.1% |
| Net income | 1,697 | 1,739 | 2.5% | 2,004 | 2,202 | 9.9% | 2,601 | 3,111 | 19.6% |
| EPS (NT$) | 40.80 | 41.82 | 2.5% | 48.19 | 52.95 | 9.9% | 62.55 | 74.81 | 19.6% |
| GM | 69.5% | 69.6% | 0.2% | 70.0% | 69.5% | -0.5% | 70.5% | 69.6% | -0.9% |
| OpM | 54.5% | 55.0% | 0.5% | 56.3% | 57.1% | 0.7% | 59.2% | 60.2% | 1.0% |
| NM | 45.1% | 44.9% | -0.2% | 46.8% | 46.7% | 0.0% | 49.7% | 49.9% | 0.2% |
Source: Goldman Sachs Global Investment Research
Maintain Buy with TP raised to NT$22,000 from NT$20,000
We raise our 12m TP to NT$22,000 (from NT$20,000 previously) which is still based on 40x 2028E discounted P/E (unchanged). Our target P/E is inline with the long-term 10-yr avg. fwd P/E. We apply this to our 2028E EPS, and discount it back to 2027E at a 13.6% CoE to arrive at our TP of NT$22,000. Our key assumptions for CoE include: (1) 1.5x beta (sourcing Bloomberg), (2) a 4.25% risk-free rate (inline with GS house-view), and (3) a market risk premium of 6.25% (in line with GS house view). Our new TP implies c.66% upside from the current share price, and we reiterate our Buy rating on Aspeed.
e92c7a75ab8b4efbba794e6b187208c8
For the exclusive use of KEVINLU@LENOVO.COM
Exhibit 6: Aspeed: P&L overview
| 1Q26 | 2Q26E | 3Q26E | 4Q26E | 1Q27E | 2Q27E | 3Q27E | 4Q27E | 2026E | 2027E | 2028E | |
|---|---|---|---|---|---|---|---|---|---|---|---|
| P&L | |||||||||||
| Revenue | 3,147 | 3,871 | 4,714 | 6,228 | 6,942 | 7,919 | 9,403 | 9,011 | 17,960 | 33,275 | 50,322 |
| Gross profit | 2,177 | 2,696 | 3,278 | 4,336 | 4,930 | 5,618 | 6,665 | 6,416 | 12,486 | 23,630 | 35,863 |
| Operating profit | 1,659 | 2,130 | 2,690 | 3,748 | 4,321 | 4,922 | 5,849 | 5,622 | 10,227 | 20,714 | 32,296 |
| Net income | 1,414 | 1,739 | 2,202 | 3,111 | 3,489 | 3,952 | 4,726 | 4,634 | 8,466 | 16,802 | 25,986 |
| EPS (NT$) | 34.01 | 41.82 | 52.95 | 74.81 | 83.91 | 95.04 | 113.66 | 111.45 | 203.59 | 404.06 | 624.93 |
| Margins (%) | |||||||||||
| GM | 69.2% | 69.6% | 69.5% | 69.6% | 71.0% | 70.9% | 70.9% | 71.2% | 69.5% | 71.0% | 71.3% |
| OpM | 52.7% | 55.0% | 57.1% | 60.2% | 62.2% | 62.2% | 62.2% | 62.4% | 56.9% | 62.3% | 64.2% |
| NM | 44.9% | 44.9% | 46.7% | 49.9% | 50.3% | 49.9% | 50.3% | 51.4% | 47.1% | 50.5% | 51.6% |
| YoY (%) | |||||||||||
| Revenue | 52.4% | 72.3% | 102.3% | 154.9% | 120.6% | 104.6% | 99.5% | 44.7% | 97.7% | 85.3% | 51.2% |
| Gross profit | 59.2% | 76.8% | 103.1% | 159.3% | 126.5% | 108.4% | 103.4% | 48.0% | 102.1% | 89.2% | 51.8% |
| Operating profit | 61.5% | 79.9% | 118.4% | 207.8% | 160.5% | 131.1% | 117.4% | 50.0% | 119.4% | 102.5% | 55.9% |
| Net income | 59.5% | 176.4% | 81.4% | 159.7% | 146.7% | 127.3% | 114.6% | 49.0% | 115.5% | 98.5% | 54.7% |
| EPS | 62.7% | 176.3% | 81.4% | 159.7% | 146.7% | 127.3% | 114.6% | 49.0% | 116.5% | 98.5% | 54.7% |
| QoQ (%) | |||||||||||
| Revenue | 28.8% | 23.0% | 21.8% | 32.1% | 11.5% | 14.1% | 18.7% | -4.2% | |||
| Gross profit | 30.2% | 23.8% | 21.6% | 32.3% | 13.7% | 14.0% | 18.6% | -3.7% | |||
| Operating profit | 36.2% | 28.4% | 26.3% | 39.3% | 15.3% | 13.9% | 18.8% | -3.9% | |||
| Net income | 18.1% | 23.0% | 26.6% | 41.3% | 12.2% | 13.3% | 19.6% | -1.9% | |||
| EPS | 18.0% | 23.0% | 26.6% | 41.3% | 12.2% | 13.3% | 19.6% | -1.9% |
Source: Company data, Goldman Sachs Global Investment Research
Exhibit 7: Taiex vs. Aspeed
Source: Bloomberg
Exhibit 8: Forward P/E
Source: Bloomberg
e92c7a75ab8b4efbba794e6b187208c8
For the exclusive use of KEVINLU@LENOVO.COM
Exhibit 9: Forward P/B
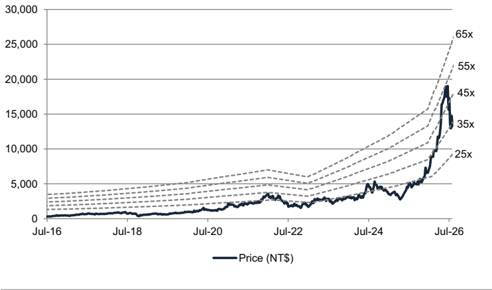
Source: Bloomberg
Exhibit 10: P/B vs. ROE
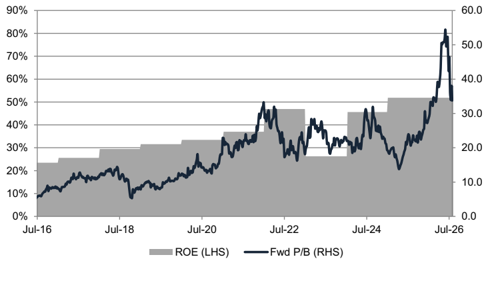
Source: Bloomberg
Investment Thesis, Price Target Risks and Methodology
Investment Thesis - Aspeed (5274.TWO)
Aspeed is a leading Taiwan-based IC (integrated circuit) design company specializing in BMC (baseboard management controller) SoC, which is used to remotely monitor the physical state of servers. The company is the largest BMC supplier, with c.70% of the global BMC market share, and 85% of its total revenue comes from the BMC segment.
We like Aspeed as we expect its revenue/earnings CAGRs to further accelerate to 77%/88% in 2025-2028E (vs. 5.9%/4.9% during 2019-2023), driven mostly by AI server demand, especially started from 2025. Furthermore, we also expect server architecture changes will bring more business opportunities to Aspeed to drive up its TAM expansion within the server market. With more TAM expansion and more dollar content growth within the AI theme, we continue to see upside potential for its revenue and earnings growth. We have a Buy rating on the name.
Price Target Risks and Methodology - Aspeed (5274.TWO)
Valuation: Our 12-month TP of NT$22,000 is based on a target P/E of 40x (in line with its 10-year historical trading average) applied to our 2028E EPS, and discounted back to 2027E at 13.6% CoE. Our key assumptions for CoE include: (1) 1.5x beta (sourcing Bloomberg), (2) a 4.25% risk-free rate, and (3) a market risk premium at 6.25% (in line with GS house view).
Key downside risks to our view and TP: 1) A softer-than-expected server market demand recovery, 2) slower-than-expected BMC penetration within AI servers, 3) intensifying market competition.
e92c7a75ab8b4efbba794e6b187208c8
For the exclusive use of KEVINLU@LENOVO.COM