PDF 原檔:報告_GS_上詮_20260706_original.pdf
圖片清單(已驗證 2026-07-07)
ingest 時建立的「眼見為憑」圖片索引,是 lib/ 嵌圖的唯一真相來源;嵌入時只從這裡挑分類為「真資料圖」的,不照 trimmed 引用順序猜。建立步驟見
ingest_steps.mdStep 2.5。
| 檔名 | size | 分類 | 親眼所見內容 |
|---|---|---|---|
260706_gs_FOCI-buy-initiation_009.png |
42KB | 真資料圖 | FOCI FAU 實物尺寸對比照,黑色 FAU 元件放在新台幣 1 元硬幣旁,顯示元件尺寸極小 |
260706_gs_FOCI-buy-initiation_001.png |
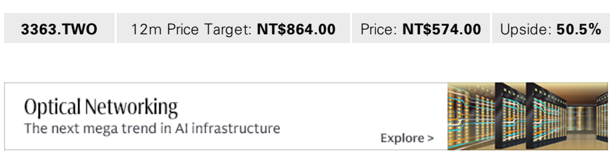
51KB | 文字卡 | GS 報告標頭:3363.TWO 12m PT NT$864.00 / Price NT$574.00 / Upside 50.5%;下方「Optical Networking」橫幅 |
260706_gs_FOCI-buy-initiation_005.png |
60KB | 真資料圖 | 美國雲端服務商 Capex 趨勢長條圖 2019–2028E(Amazon / Meta / Alphabet / Microsoft / Oracle),附 Blended YoY 折線 |
260706_gs_FOCI-buy-initiation_018.png |
77KB | 真資料圖 | FAU 與 GlassBridge 結構對比圖:左側 FAU 含 Fiber→Lens→V-groove→Glue→PIC;右側 GlassBridge 以玻璃直接橋接 Fiber 至 PIC |
260706_gs_FOCI-buy-initiation_017.png |
92KB | 真資料圖 | FOCI 光纖陣列電纜實物照片,多彩色光纖排列在白色連接頭兩端 |
260706_gs_FOCI-buy-initiation_010.png |
108KB | 真資料圖 | FAU 在 CPO switch 中位置的 3D 渲染圖,標示「1 FAU」,顯示 FAU 與晶片封裝整合示意 |
260706_gs_FOCI-buy-initiation_022.png |
111KB | 真資料圖 | FOCI 同業比較表:PE / PS / NI YoY / Rev YoY / OPM(2027E/2028E),列示 FOCI vs TFC Optical / Largan / Sumitomo / FII / Fabrinet / Coherent / Everprox / Browave / AFR / Accelink |
260706_gs_FOCI-buy-initiation_013.png |
112KB | 真資料圖 | CPO 架構示意圖:兩個 XPU 透過 FAU 連接各自的 Optical Engine(含 PIC / Modulator / Photo detector / EIC / Driver / TIA) |
260706_gs_FOCI-buy-initiation_015.png |
130KB | 真資料圖 | 光學技術遷移路線圖:Pluggable transceivers(EML→Silicon Photonics,2024)→ CPO with switch(2026)→ CPO with XPU(時程未定),含硬體示意圖 |
260706_gs_FOCI-buy-initiation_014.png |
136KB | 真資料圖 | 資料中心 Scale-up racks 與 Scale-out clusters 連接架構圖:標示 TOR/EoR Switches、Servers、PCB midplanes、AEC/AOC/DAC 纜線及 CPO/NPO 位置 |
260706_gs_FOCI-buy-initiation_021.png |
221KB | 真資料圖 | FOCI P&L 摘要表(2022-2031E)含 Revenue / Gross profit / OPEX / Operating profit / Net profit / EPS;下方折現 P/E 估值計算:2030E P/E 15.9x → 目標 NT$1,234,折現至 2027E TP=NT$864(COE 12.6%) |
原始內容
For the exclusive use of KEVINLU@LENOVO.COM
FOCI (3363.TWO)
FAU for CPO switch riding on optical networking migration; Initiate at Buy with TP at NT$864
We identify FOCI as a key bene fi ciary of the optical networking migration trend and expect its net income to grow at a 250% CAGR in 2025-30E, driven by (1) FAU ( fi ber array unit) used in CPO switches, carrying higher ASP and GM, along with healthier competition and continuous speci fi cation upgrades (3.2T, 6.4T, and more advanced), (2) growing CPO switch demand (see our Optical Networking thematic), riding on the AI infrastructure upcycle, (3) early participation with global-leading CPO switch brand makers and chipset suppliers, supporting its timely product design amid fast technology migration, (4) automated production driving manufacturing e ffi ciency and yield rates, and (5) a strong commitment to capacity expansion to support the CPO FAU shipment ramp-up. We initiate FOCI at Buy with a 12-month target price of NT$864 (which implies 48x 2027E P/E vs. 1,100% NI YoY in 2027-28E).
Key debate: There are market concerns that new technologies (e.g., GlassBridge) could replace FAU; however, we argue that for a technology to become mainstream, it requires stable performance and a ff ordable costs in mass production, along with the related system support and supply chain readiness. Our supply chain checks suggest: (1) it is normal that other solutions (e.g., glass, metal, etc.) are proposed to connect fi bers and chips, but FAU continues to be the one chosen by customers, and (2) FAU is also evolving, including more channels (toward 100+ channels vs. 24+ channels for GlassBridge, link), narrower pitch, 2D architecture, and heat-resistant materials to withstand the heat during the re fl ow process. We believe GlassBridge is a complement to FAU rather than a replacement, and the strong AI server rack ramp-up, along with fast bandwidth upgrades, would continue to support FAU demand,
BUY
Allen Chang
+852-2978-2930 | allen.k.chang@gs.com Goldman Sachs (Asia) L.L.C.
Verena Jeng
+852-2978-1681 | verena.jeng@gs.com Goldman Sachs (Asia) L.L.C.
Yifan Hu
+852-2978-0996 | yifan.hu@gs.com Goldman Sachs (Asia) L.L.C.
Key Data _____________________________________
Market cap: NT$62.9bn / $2.0bn
Enterprise value: NT$60.2bn / $1.9bn
3m ADTV: NT$2.8bn / $87.4mn
Taiwan
Greater China Technology
M&A Rank: 3
Leases incl. in net debt & EV?: Yes
| GS Forecast | 12/25 | __________ 12/26E | 12/27E | 12/28E |
|---|---|---|---|---|
| Revenue (NT$ mn) | 1,892.0 | 2,924.3 | 10,648.7 | 26,212.1 |
| EBITDA (NT$ mn) | 124.2 | 248.5 | 2,897.4 | 7,764.7 |
| EPS (NT$) | 0.16 | 0.84 | 17.83 | 50.03 |
| P/E (X) | NM | NM | 32.2 | 11.5 |
| P/B (X) | 12.3 | 10.6 | 8.0 | 4.7 |
| Dividend yield (%) | 0.0 | 0.0 | 0.0 | 0.0 |
| N debt/EBITDA (ex lease,X) | (10.1) | (10.9) | (1.0) | (0.7) |
| CROCI (%) | 3.6 | 9.2 | 49.6 | 81.5 |
| FCF yield (%) | (0.8) | (2.9) | 0.4 | 4.4 |
| 3/26 | 6/26E | 9/26E | 12/26E | |
| EPS (NT$) | (0.98) | (0.92) | 1.23 | 1.51 |
Source: Company data, Goldman Sachs Research estimates. See disclosures for details.
Goldman Sachs does and seeks to do business with companies covered in its research reports. As a result, investors should be aware that the fi rm may have a con fl ict of interest that could a ff ect the objectivity of this report. Investors should consider this report as only a single factor in making their investment decision. For Reg AC certi fi cation and other important disclosures, see the Disclosure Appendix, or go to www.gs.com/research/hedge.html. Analysts employed by non-US a ffi liates are not registered/quali fi ed as research analysts with FINRA in the U.S.
e92c7a75ab8b4efbba794e6b187208c8
For the exclusive use of KEVINLU@LENOVO.COM
FOCI (3363.TWO)
Rating since Jul 6, 2026
Ratios & Valuation __________________________________________
| 12/25 | 12/26E | 12/27E | 12/28E | |
|---|---|---|---|---|
| P/E (X) | NM | NM | 32.2 | 11.5 |
| P/B (X) | 12.3 | 10.6 | 8.0 | 4.7 |
| FCF yie l d (%) | (0.8) | (2.9) | 0.4 | 4.4 |
| EV/EBITDAR (X) | 242.5 | 242.4 | 20.7 | 7.4 |
| EV/EBITDA (exc l . l eases) (X) | 242.5 | 242.4 | 20.7 | 7.4 |
| CROCI (%) | 3.6 | 9.2 | 49.6 | 81.5 |
| ROE (%) | 0.6 | 2.2 | 28.3 | 51.6 |
| Net debt/equity (%) | (49.4) | (45.8) | (37.6) | (42.9) |
| Net debt/equity (exc l . l eases) (%) | (49.4) | (45.8) | (37.6) | (42.9) |
| Interest cover (X) | 0.1 | 8.4 | 285.2 | 820.3 |
| Days inventory outst, sa l es | 67.2 | 64.3 | 39.9 | 34.8 |
| Receivab l e days | 55.6 | 50.0 | 25.0 | 22.0 |
| Days p ayab l e outstandin g | 75.6 | 60.0 | 60.0 | 60.0 |
| DuPont ROE (%) | 0.6 | 1.6 | 24.8 | 41.0 |
| Turnover (X) | 0.6 | 0.4 | 1.1 | 1.5 |
| L evera g e (X) | 1.2 | 1.1 | 1.3 | 1.3 |
| G ross cas h invested (ex cas h ) (NT $ ) | 1,624.1 | 3,723.4 | 5,925.2 | 9,490.5 |
| Avera g e ca p ita l e mpl oyed (NT $ ) | 1,175.6 | 2,251.1 | 4,065.4 | 6,273.4 |
| BVP S (NT $ ) | 24.60 | 54.09 | 71.92 | 121.95 |
Growth & Margins (%) ______________________________________
| 12/25 | 12/26E | 12/27E | 12/28E | |
|---|---|---|---|---|
| Total revenue growth | 38.7 | 54.6 | 264.1 | 146.2 |
| EBITDA growth | 445.7 | 100.1 | NM | 168.0 |
| EPS growth | 132.8 | 438.3 | 2,019.7 | 180.6 |
| DPS growth | NM | NM | NM | NM |
| EBIT margin | 0.1 | 2.4 | 22.6 | 26.4 |
| EBITDA margin | 6.6 | 8.5 | 27.2 | 29.6 |
| Net income margin | 0.9 | 3.2 | 18.4 | 20.9 |
Price Performance __________________________________________
Source: FactSet. Price as of 6 Jul 2026 close.
Income Statement (NT$ mn) ________________________________
12/25
1,892.0
(1,536.4)
(142.2)
(212.3)
--
12
4.
2
(123.0)
1
2
.
11.1
4.4
22
8
.
(6.6)
--
--
16
.
2
--
16
2
.
0.
16
0.
16
0.
16
0.
16
--
0.0
,4
5
5
,4
12/28E
26,212.1
(16,577.2)
(891.2)
(1,834.8)
--
7
,
7
76
4.
(855.9)
6
.
8
8
,90
78.9
--
6
,9
87
7
.
(1,502.4)
--
--
85
.
3
--
85
3
.
5
0.0
3
5
3
0.0
5
0.0
3
5
0.0
3
--
0.0
9
9
12/26E
2,924.3
(2,349.4)
(200.3)
(303.6)
--
2
.
5
8
4
(177.5)
7
0.9
31.1
2.9
115
.9
(23.7)
--
--
2
.
2
--
2
2
.
0.
4
8
0.
4
8
0.
8
4
0.
8
4
--
0.0
12/27E
10,648.7
(7,075.1)
(425.9)
(745.4)
--
2
8
9
.4
7
,
(495.1)
2
,40
2
.
2
72.0
--
2
2
4.
,4
7
(519.6)
--
--
5
4.
6
--
,9
1
,9
1
5
4.
17
6
.
83
17
.
83
17
.
83
17
.
83
--
0.0
v
e
l
To
r
e
t
a
nu
e
Co
s
t of good
SG&A
R&D
Other operating inc./(exp.)
E
BITDA
Depreciation & amortization
E
BIT
Net intere t inc./(exp.)
s
Income/(lo ss
Pre-ta ss
) from a x p
t
r
ofi
Provi
s
s
ion for taxe
Minority intere
t
s
Preferred dividend
s
N
re-e et
.
inc xc
(p
Po
p
t
e
s
ion t-tax exceptional
N
ociate
s
a
ls)
s
et
E
P
E
E
xc inc
e
(pos
.
t-e
S (b
P
P
p
re-e sic
a
,
S (dilu
p
te
S (b
t
xc
,
ion
e
ls)
a
p
re-e
p
d
sic
,
a
t
xc pos
E
P
S (dilu t-e
te
d
,
) (N
e
xc pos
$)
T
p
e
t
p
t-e
DPS (NT$)
Div. payout ratio (%)
Balance Sheet (NT$ mn) ____________________________________
| 12/25 | 12/26E | 12/27E | 12/28E | |
|---|---|---|---|---|
| C a sh& c a sh equiv a lents | 1,412. 0 | 2,871.3 | 3,119.3 | 5,895.3 |
| Accounts receiv a ble | 281.3 | 519.9 | 938.8 | 2,221. 0 |
| Inventory | 4 0 8.7 | 621.2 | 1,7 0 4.9 | 3,291. 0 |
| Other current a ssets | 1 0 5.4 | 1 0 5.4 | 1 0 5.4 | 1 0 5.4 |
| Total c u rrent assets | 2 , 2 0 7 .4 | 4, 117 . 8 | 5 , 868 .4 | 11 , 512 . 7 |
| Net PP&E | 647.4 | 2,225.5 | 3,869.1 | 5,383.9 |
| Net int a ngibles | 22.4 | 22.4 | 29.1 | 33.1 |
| Tot a l investments | 0 . 0 | 0 . 0 | 0 . 0 | 0 . 0 |
| Other long-term a ssets | 279.9 | 279.9 | 279.9 | 279.9 |
| Total assets | 3, 157 . 1 | 6 , 6 4 5 . 6 | 1 0,04 6 . 5 | 17 , 2 09. 6 |
| Accounts p a y a ble | 332.5 | 439.9 | 1,886.1 | 3,563.9 |
| Short-term debt | 153.1 | 153.1 | 153.1 | 153.1 |
| Short-term le a se li a bilities | -- | -- | -- | -- |
| Other current li a bilities | 36.3 | 36.3 | 36.3 | 36.3 |
| Total c u rrent liabilities | 522 .0 | 62 9.4 | 2 ,0 75 . 6 | 3, 75 3.4 |
| Long-term debt | -- | -- | -- | -- |
| Long-term le a se li a bilities | -- | -- | -- | -- |
| Other long-term li a bilities | 86. 0 | 86. 0 | 86. 0 | 86. 0 |
| Total long-term liabilities | 86 .0 | 86 .0 | 86 .0 | 86 .0 |
| Total liabilities | 6 0 8 .0 | 715 .4 | 2 , 161 . 6 | 3, 8 39.4 |
| Preferred sh a res | -- | -- | -- | -- |
| Tot a l commonequity | 2,549.1 | 5,93 0 .2 | 7,884.9 | 13,37 0 .2 |
| Minority interest | -- | -- | -- | -- |
| Total liabilities &eq u ity | 3, 157 . 1 | 6 , 6 4 5 . 6 | 1 0,04 6 . 5 | 17 , 2 09. 6 |
| Net debt, a djusted | (1,258.8) | (2,718.2) | (2,966.2) | (5,742.2) |
Cash Flow (NT$ mn) ________________________________________
12/25
16.2
123.0
--
(78.3)
(78.3)
(
)
17
5
.
(218.9)
--
--
54.0
16
4.
)
8
--
--
153.1
(28.6)
12
5
4.
(
.
57
8
)
(236.3)
12/26E
92.2
177.5
--
(343.7)
--
(
4.0)
7
(1,740.0)
--
--
(15.7)
,
755
.
6
)
--
--
--
3,288.9
3,
288
.9
1
,4
5
9.4
12/27E
1,954.6
495.1
--
(56.4)
--
2
,393.3
(2,129.7)
--
--
(15.7)
,
1
4
5
.4)
--
--
--
0.0
0.0
2
4
7
.9
12/28E
5,485.3
855.9
--
(1,190.5)
--
5
15
,
8
0.
(2,359.1)
--
--
(15.7)
2
,3
7
4.
8
)
--
--
--
0.0
0.0
2
,
776
.0
(1,813.9)
263.6
2,791.7
Source: Company data, Goldman Sachs Research estimates.
) (N
t
xc
T
) (N
e
p
$)
T
$)
t
) (N
T
$)
s
Net income
D&A add-back
Minority interest add-back
Net (inc)/dec orking capital
w
Other operating cash flo
w
Cash flow
from operations
Capital expenditures
Acquisitions
Divestitures
Others
Cash from
investing flow
Repayment of lease liabilities
Dividends paid (common & pref)
Inc/(dec) in debt
Other financing cash flo
s
w
Cash financing
from flow
Total flow
cash
Free cash flo
w
s
old
(
(
1
(
2
(
e92c7a75ab8b4efbba794e6b187208c8
For the exclusive use of KEVINLU@LENOVO.COM
driving FOCI's growth going forward.
Valuation: Our target price is based on a 2030E discounted P/E. Our target P/E multiple is derived from peers' trading P/E relative to their forward-year EPS YoY. Our TP implies 48x 2027E P/E with NI YoY at 1,100% in 2027-28E. Key downside risks: fi ercer-than-expected market competition, technology migration trends in optical networking, and slower-than-expected capacity ramp up.
e92c7a75ab8b4efbba794e6b187208c8
cambles. oo cor caper tellu
USSm
1,400,000
1,200,000
1,000,000
800,000
600,000
400,000
200,000
For the exclusive use of KEVINLU@LENOVO.COM
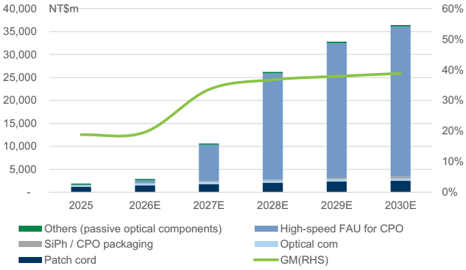
FOCI in six charts
34%
35%
90%
80%
70%
60%
50%
40%
Exhibit 1: FOCI's revenue and GM trends 30%
GM improvement on rising contribution from CPO FAU
0%
10%
0%
Source: Company data, Goldman Sachs Global Investment Research
Exhibit 3: US CSP Capex trend
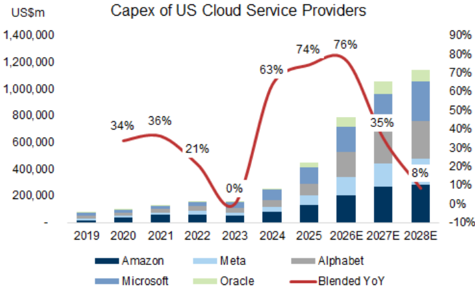
Data include Microsoft, Amazon, Meta, Alphabet and Oracle. For Microsoft, we use capex incl. fi nancial lease. In FY24, 50% of the capex of Microsoft was spent on land and 50% on AI/Cloud.
Source: Company data, Goldman Sachs Global Investment Research
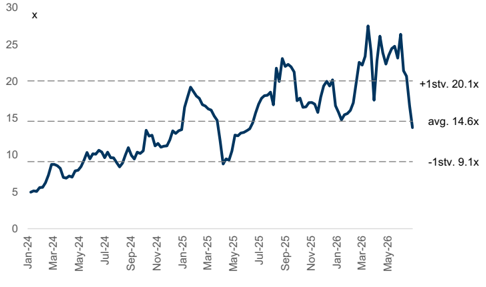
Exhibit 5: FOCI 12M forward P/S
Source: Company data, Goldman Sachs Global Investment Research
63% -
74%
76%
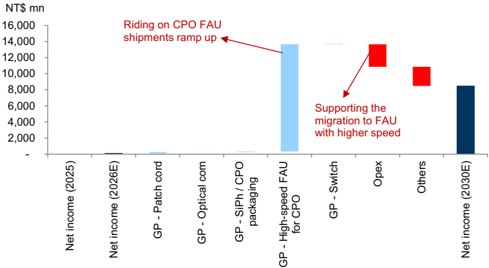
Exhibit 2: FOCI's NI waterfall chart 2025-30E CPO FAU as a key driver ahead
Source: Company data, Goldman Sachs Global Investment Research
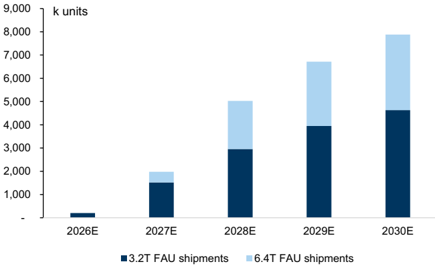
Exhibit 4: FOCI's FAU shipments trend
Source: Company data, Goldman Sachs Global Investment Research
Exhibit 6: FOCI's 40 channel FAU for 3.2T or above CPO switch
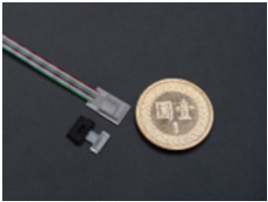
Source: Company data
e92c7a75ab8b4efbba794e6b187208c8
eaiont.noee teSlie ToSA
1
FAU
FOCI's products
Exhibit 7: FOCI's FAU in CPO switch
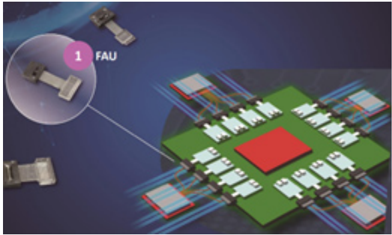
Source: Company data
Exhibit 9: FOCI's 100G LR4 TOSA
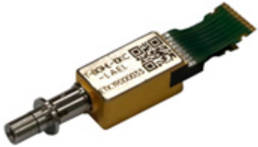
Source: Company data
Exhibit 11: FOCI's data center AOC
Source: Company data
For the exclusive use of KEVINLU@LENOVO.COM
Exhibit 8: FOCI's fi lter devices
Source: Company data
Exhibit 10: FOCI's 100G LR4 ROSA
Source: Company data
Exhibit 12: FOCI's polarization maintaining fi ber patchcords
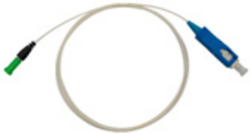
Source: Company data
e92c7a75ab8b4efbba794e6b187208c8
camble 14 comectrons I udla cellet. oedle up vo. oedle out
Laser
Scale up racks
Optical Engine
FAU to grow on rising CPO switch demand
Switches
Modulator
¡ Photo detector
Scale out clusters
FAU
FAU
FAU
Laser
Optical Engine
PIC
Modulator
EOR
Switches
Photo detector
To meet the increasing demand for bandwidth, power consumption, and miniaturization, the form of optical connection is evolving, such as expanding from the pluggable optical module to onboard optics (NPO) and co-packaged optics (CPO), covering short-distance connections with high bandwidth and better power e ffi ciency. We expect CPO will initially be integrated with the switch ASIC, followed by XPUs (GPUs, CPUs, ASICs, etc.). CPO/ NPO scale out
0000000-
00
Servers
00 • 00000000.
PCB midplanes
CPO/ NPO scale up
Exhibit 13: How CPO works in data transmission
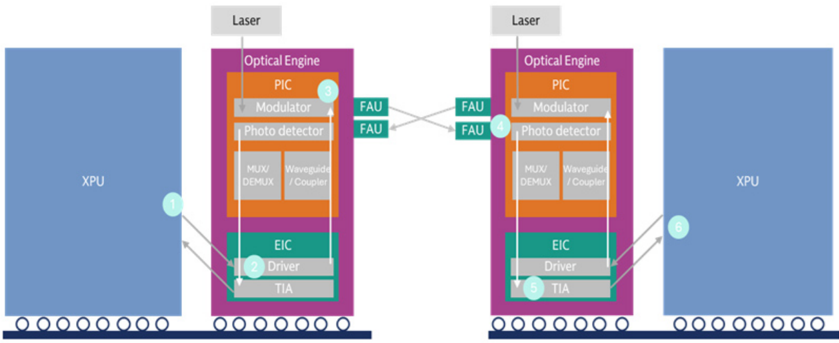
Source: Company data, Data compiled by Goldman Sachs Global Investment Research
Exhibit 14: Connections in data center: Scale-up vs. Scale-out
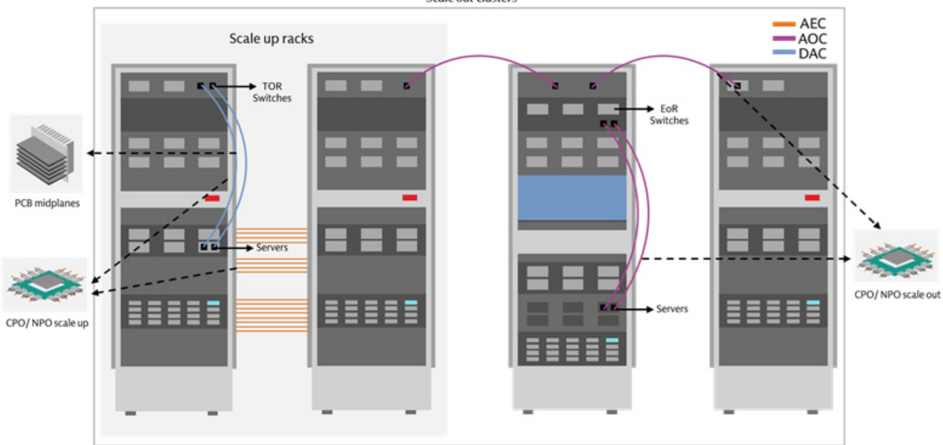
TOR Switch: Top of rack switch; EoR Switch: End of row switch
Source: Company data, Data compiled by Goldman Sachs Global Investment Research
For the exclusive use of KEVINLU@LENOVO.COM
XPU
AEC
AOC
DAC
e92c7a75ab8b4efbba794e6b187208c8
exmore 1o. ero switen specheation comparison
Nvid ia
Ethernet Switch
Spectrum-X Photonics
Substrate
InfiniBand
115.2Tb/s
4
28.8Tb/s
Accelerator
Interposer
Tomahawk 5 - Bailly
Engine
Optical
Ethernet
Ethernet
409.6 Tb/s
51.2 Tb/s
Exhibit 15: Optics technology migrations
102.4Tb/s
144 x 800G
200G/lane SerDes
18
72 (1.6T)
4U
Network
Switching capacity
of Switch ASIC
Switch ASIC
Ports
Speed
External laser source
Optical engines
Size
Pluggable transceivers
EML-based → Silicon Photonics
(2024)
For the exclusive use of KEVINLU@LENOVO.COM
51.2Tb/s
Ethernet
102.4 Tb/s
1
102.4Tb/s
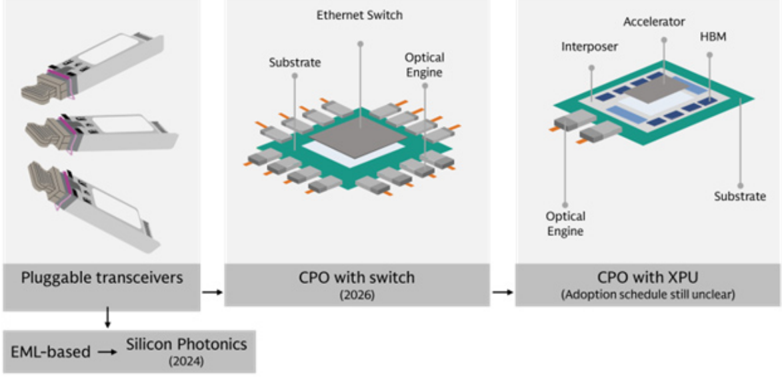
Source: Company data, Data compiled by Goldman Sachs Global Investment Research
Exhibit 16: CPO switch speci fi cation comparison
Source: Company data, Data compiled by Goldman Sachs Global Investment Research
Co-Packaged Optics (CPO) expands optics to cover short-distance connections and higher bandwidth requirements. It places optical engines as close as possible to the chips, shortening the electrical paths from several centimeters to the millimeter level, lowering power consumption. The shorter transmission path also reduces latency and eliminates the need for DSPs and retimers, further reducing the overall power consumption of these devices. Additionally, this higher integration results in a smaller form factor.
On the other hand, CPO requires a comprehensive supply chain technology migration rather than a single-device upgrade, which could take time to develop. Furthermore, the co-packaging leads to higher maintenance costs. For instance, in a pluggable optical module, if the optical engine fails, one simply replaces the optical module while the switch system remains intact. Conversely, failures in highly-integrated systems have broader impacts: (1) with onboard optics / NPO, one would need to replace the switch PCB; (2) with CPO integrated into the switch, a failure would a ff ect the switch ASIC, and (3) with CPO integrated into a XPU, a failure would a ff ect the entire XPU (e.g., GPU, CPU, NPU, etc.).
Moreover, the lifecycles of PICs (Photonic Integrated Circuits) and EICs (Electronic Integrated Circuits) are di ff erent, with PICs being more delicate, which led to the design of the pluggable optical modules. As a result, we expect that: (1) pluggable optical
HBM
Broadcom e92c7a75ab8b4efbba794e6b187208c8
Exmolt 1o. ero switch bom redkaowll, by value (use)
BROADCOM
- nVIDIA
CPO switch BoM (Quantum-X Photonics)
US$
800G
Switch ASIC
1.6T
RANOVUS
MEDIATEK
Optical engines (1.6T)
3.2T
FAU
CPO
ELS
Scale up
Among which: CW laser (300mw)
Scale out
Shuffle box
OCS
MPO connectors/ cables
Scale up or scale out
Single mode Fiber
BoM
Note:
Markup
For the exclusive use of KEVINLU@LENOVO.COM
Microsoft
ASP|
Value
3,000
12,000
Exmore 19. ero switch bom bredkaown, by 7o (use)
Meta
V
Single mode
Fiber, 16%
Amazon
V
MPO
modules will co-exist with NPO / CPO, and continue speed migration toward 3.2T; (2) CPO will become more attractive to clients for short-distance and higher bandwidth applications that pluggable optical module cannot support; and (3) pluggable optical module suppliers will also enjoy new optics device opportunities within the NPO / CPO ecosystem, such as providing optical engines, FAUs, ELS modules.
75,803
Exhibit 17: CPO: Key development of major players
0: See progress in adoption
| Key players | Progress | Progress details | Highlights |
|---|---|---|---|
| - CPO Switch commercially available in 2026 (Scale out) | Mar-2025: Announced CPO switch (Quantum-X InfiniBand, Spectrum-X Ethernet) Early 2026: Commercial availability of CPO switch | Adopt MRM(Micro Ring Modulator) technology, achieving higher density and efficiency | |
| - Davisson (102.4T) CPO switch sampling in Oct 2025 (Scale-out and scale-up) | Mar-2022 : world's first 25.6T CPO Demo June-2023: 51.2T CPO sampling Mar-2024: Bailly (51.2T) CPO switch delivered to customers Oct-2025: Davisson (102.4T) CPO switch delivered to customers | Adopt MZM (Mach-Zehnder Modulator), which is more matured, while also developingMRM | |
| - CPO ethernet swith sampling in 2027 (Scale-out) - Developing CPO for XPUs (Scale-up) | Feb-2026: Acquired Celestial AI, a startup focusing on CPO for XPUs 2027: CPO (204T) Ethernet switch sampling | CPO solution to combine with custom XPUs for CSPs | |
| Announced co-developed CPO for ASIC in 2024 | Mar-2024: Announced Odin CPO solutions (6.4T) collaborating with Mediatek's ASIC platform | Targeting CPO technology on XPU |
Source: Company data, Data compiled by Goldman Sachs Global Investment Research
Exhibit 18: CPO switch BoM breakdown, by value (GSe)
ASP estimates are based on industry checks
Exhibit 19: CPO switch BoM breakdown, by % (GSe)
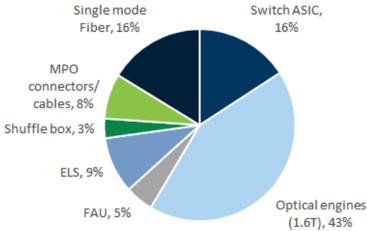
Source: Company data, Goldman Sachs Global Investment Research
Source: Company data, Goldman Sachs Global Investment Research
Exhibit 20: Technology adoption by cloud service providers (CSPs)
(1.6T), 43%
Oracle
Switch ASIC,
16%
V
Chinese CSP
Nvidia
V
V
O (2028)
V
4
Source: Company data, Data compiled by Goldman Sachs Global Investment Research
e92c7a75ab8b4efbba794e6b187208c8
P Au Ae
U Ou
FAU vs. GlassBridge
The FAU is a passive optical component that holds multiple optical fi bers in a precisely aligned array, typically using a V-groove substrate. Its functions include: (1) high-precision optical coupling: providing micron-level alignment between optical fi bers and the on-chip waveguides of the silicon photonic engine, (2) polarization management: FAUs often adopt polarization-maintaining fi bers to ensure stable optical performance and high Polarization Extinction Ratios (PER), and (3) high-density interconnect: FAUs enable high-density interconnect by arranging fi bers at a very tight pitch.
Exhibit 21: FOCI's FA solution for SiPh chip (1)
Source: Company data
Exhibit 22: FOCI's FA solution for SiPh chip (2)
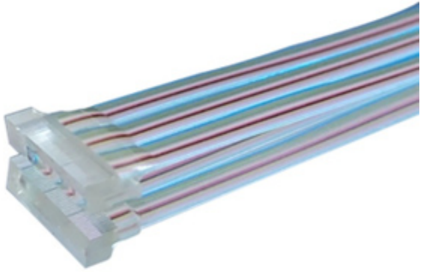
Source: Company data
Corning Inc. (GLW, Not Covered) is the major player in GlassBridge in the market (link), which is a wafer level-manufactured fi ber-to-PIC technology designed as a detachable connector that supports 24+ optical channels. GlassBridge acts both as a high-precision glass component and as an integrated connector for fi ber and optical engine, used in next-generation optical networking products (e.g., NPO, CPO, etc.). GlassBridge adopts IOX (ion-exchange) waveguides, which are optical pathways integrated in glass that enable high-precision optical alignment and low-loss performance, ful fi lling the strict requirements in optical networking products used in AIDC.
The market is concerned that new technologies (e.g., GlassBridge) could replace
FAU ; however, we argue that for a technology to become mainstream, it requires stable performance and a ff ordable costs in mass production, along with related system support and supply chain readiness. Our supply chain checks suggest: (1) it is normal that other solutions (e.g., glass, metal) are proposed to connect fi bers and chips, but FAU continues to be the one chosen by customers, and (2) FAU is also evolving, including more channels (toward 100+ channels vs. 24+ channels for GlassBridge, link), narrower pitch, 2D architecture, and heat-resistant materials to withstand the heat during the re fl ow process. We believe GlassBridge is a complement to FAU rather than a replacement, and the strong AI server rack ramp-up, along with fast bandwidth upgrades, would continue to support FAU demand, driving FOCI's growth.
For the exclusive use of KEVINLU@LENOVO.COM
e92c7a75ab8b4efbba794e6b187208c8
Calwilco.rhu anlu dlaseblllse sotuctures
FAU solution
Fiber
Lens
V groove
Glue
PIC
For the exclusive use of KEVINLU@LENOVO.COM
GlassBridge solution
The rising demand for high-speed transmission drives high density, high precision, and high integration, lifting the entry barrier for FAUs: the size of FAUs will not increase, but the number of fi bers will keep doubling with the rising transmission speed if per-channel speed stays the same. The increasing density will raise the di ffi culty in both design and manufacturing, and in CPO, the FAU couples with the PIC via optical co-packaging, with one end connecting with the PIC, and the other end connecting to high-density fi ber optic cables, further lifting the entry barrier. FOCI works closely with a global-leading foundry to develop a standardized platform (IP ReLFACon: re fl owable lensed fi ber array connector). The ReLFACon is a connector or I/O (input/output) on the optical engine (EIC and PIC packaged together), connecting the optical engine and fi ber optic cables to transmit data in and out. The ReLFACon can withstand the high temperature (up to 280 degrees Celsius) during semiconductor packaging, and can connect multiple fi bers in a small space.
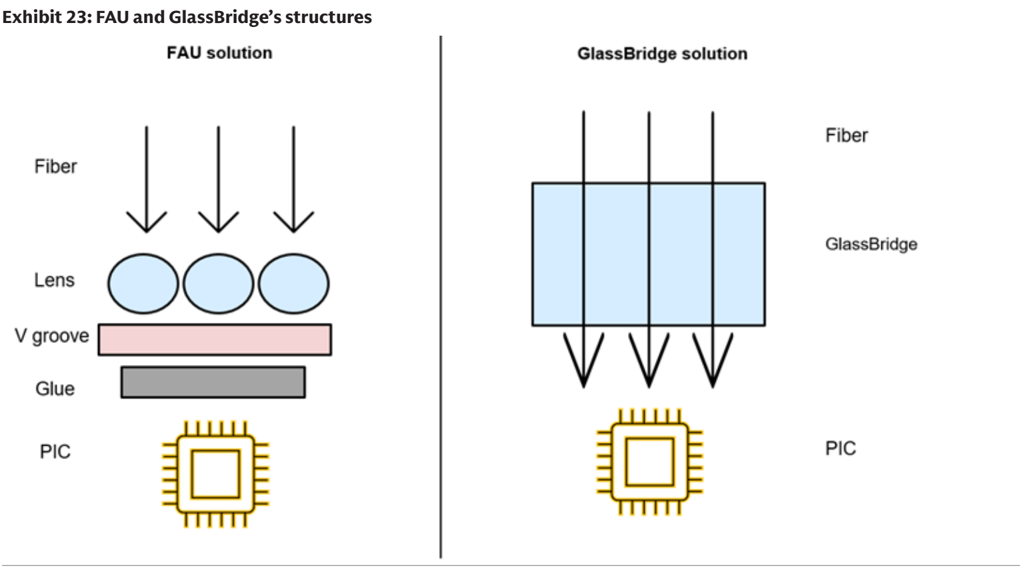
Source: Goldman Sachs Global Investment Research
Earnings estimates
Revenues: +81% CAGR in 2025-30E, driven by: (1) Expanding from telecom to AIDC optical networking: FOCI provides optical components to telecom operators and is expanding to high-speed FAU used in the AIDC CPO switch, riding on the growing AI infrastructure trend globally, (2) CPO switch shipment ramp-up: FOCI serves major CPO switch players in the global market, and the rising end demand would drive FOCI's high-speed FAU shipment growth ahead, (3) Product migration: We model FOCI to enjoy the product migration from 3.2T to 6.4T FAU in coming years, leading to an ASP uptrend, and (4) Capacity expansion: FOCI raised capital in 2026 to support its capacity expansion plan for FAU, supporting the company's shipment growth ahead.
GM: Up from 19% in 2025 to 39% in 2030E on rising contribution from CPO FAU and e92c7a75ab8b4efbba794e6b187208c8
For the exclusive use of KEVINLU@LENOVO.COM
migration toward FAU with higher speed, which carries a higher GM than other product lines. Opex ratio: Improving from 18.7% in 2025 to 9.1% in 2030E on growing revenue scale and higher operational e ffi ciency, with R&D expense at a +59% CAGR to support the product speci fi cation upgrades. NI: +250% CAGR in 2025-30E, driven by the rising revenue scale and pro fi tability improvement.
Exhibit 24: FOCI P&L summary
| (NT$ m) | 1Q25 | 2Q25 | 3Q25 | 4Q25 | 1Q26 | 2Q26E | 3Q26E | 4Q26E | 2024 | 2025 | 2026E | 2027E | 2028E | 2029E | 2030E |
|---|---|---|---|---|---|---|---|---|---|---|---|---|---|---|---|
| Revenue | 411 | 582 | 508 | 391 | 382 | 433 | 1,032 | 1,077 | 1,364 | 1,892 | 2,924 | 10,649 | 26,212 | 32,793 | 36,410 |
| Gross profit | 71 | 115 | 121 | 49 | 7 | 12 | 257 | 298 | 181 | 356 | 575 | 3,574 | 9,635 | 12,422 | 14,140 |
| Operating expense | (77) | (83) | (110) | (84) | (163) | (147) | (95) | (99) | (272) | (354) | (504) | (1,171) | (2,726) | (3,214) | (3,313) |
| Operating income | (6) | 33 | 11 | (36) | (156) | (135) | 162 | 199 | (92) | 1 | 71 | 2,402 | 6,909 | 9,208 | 10,826 |
| Net income | 1 | 17 | 21 | (22) | (107) | (101) | 135 | 165 | (48) | 16 | 92 | 1,955 | 5,485 | 7,259 | 8,485 |
| EPS, diluted (NT$) | 0.01 | 0.16 | 0.20 | (0.22) | (0.98) | (0.92) | 1.23 | 1.51 | (0.48) | 0.16 | 0.84 | 17.83 | 50.03 | 66.20 | 77.38 |
| Margins / ratio | |||||||||||||||
| Gross margin | 17.2% | 19.8% | 23.8% | 12.4% | 1.9% | 2.7% | 24.9% | 27.7% | 13.3% | 18.8% | 19.7% | 33.6% | 36.8% | 37.9% | 38.8% |
| Opex ratio | -18.8% | -14.2% | -21.7% | -21.6% | -42.7% | -33.9% | -9.2% | -9.2% | -20.0% | -18.7% | -17.2% | -11.0% | -10.4% | -9.8% | -9.1% |
| Operating margin | -1.6% | 5.6% | 2.2% | -9.2% | -40.8% | -31.2% | 15.7% | 18.5% | -6.7% | 0.1% | 2.4% | 22.6% | 26.4% | 28.1% | 29.7% |
| Net margin | 0.3% | 2.9% | 4.1% | -5.7% | -28.0% | -23.4% | 13.1% | 15.3% | -3.5% | 0.9% | 3.2% | 18.4% | 20.9% | 22.1% | 23.3% |
| QoQ | |||||||||||||||
| Revenue | 14% | 41% | -13% | -23% | -2% | 13% | 139% | 4% | |||||||
| Gross profit | 110% | 63% | 5% | -60% | -85% | 63% | 2091% | 16% | |||||||
| Operating income | nm | nm | -66% | nm | nm | nm | nm | 23% | |||||||
| Net income | nm | 1420% | 22% | nm | nm | nm | nm | 22% | |||||||
| YoY | |||||||||||||||
| Revenue | 53% | 65% | 33% | 9% | -7% | -26% | 103% | 176% | 7% | 39% | 55% | 264% | 146% | 25% | 11% |
| Gross profit | 235% | 62% | 121% | 44% | -90% | -90% | 113% | 514% | 0% | 97% | 62% | 522% | 170% | 29% | 14% |
| Operating income | nm | 376% | nm | nm | nm | nm | 1382% | nm | nm | nm | 5856% | 3286% | 188% | 33% | 18% |
| Net income | nm | -34% | nm | nm | nm | nm | 557% | nm | nm | nm | 469% | 2020% | 181% | 32% | 17% |
Source: Company data, Goldman Sachs Global Investment Research
We expect CCC days to improve from 63 days in 2025 to 18 days in 2030E, mainly due to the gradually improving accounts receivable, inventory, and accounts payable days in the coming years, driven by the CPO FAU shipment ramp-up. We forecast ROE to increase to 34% in 2030E from 1% in 2025, mainly on improving asset turnover and net margins driven by the rising contribution from the high-margin CPO FAU business. We believe FCF should keep improving in the coming years, driven by higher operating cash fl ow as earnings scale up.
e92c7a75ab8b4efbba794e6b187208c8
For the exclusive use of KEVINLU@LENOVO.COM
Exhibit 25: FOCI's balance sheet
| NT$m | 2024 | 2025 | 2026E | 2027E | 2028E | 2029E | 2030E |
|---|---|---|---|---|---|---|---|
| Balance Sheet | |||||||
| Cash and equivalents | 1,470 | 1,412 | 2,871 | 3,119 | 5,895 | 12,976 | 21,561 |
| Accounts receivable | 295 | 281 | 520 | 939 | 2,221 | 2,271 | 2,317 |
| Inventory | 288 | 409 | 621 | 1,705 | 3,291 | 3,406 | 3,549 |
| Other current assets | 88 | 105 | 105 | 105 | 105 | 105 | 105 |
| Current assets | 2,141 | 2,207 | 4,118 | 5,868 | 11,513 | 18,759 | 27,533 |
| Net PP&E/Fixed assets | 485 | 647 | 2,226 | 3,869 | 5,384 | 5,521 | 5,413 |
| Net intangibles | 32 | 22 | 22 | 29 | 33 | 36 | 37 |
| Other long-term assets | 309 | 280 | 280 | 280 | 280 | 280 | 280 |
| Non-current assets | 826 | 950 | 2,528 | 4,178 | 5,697 | 5,837 | 5,730 |
| Total assets | 2,967 | 3,157 | 6,646 | 10,047 | 17,210 | 24,596 | 33,263 |
| Accounts payable | 304 | 332 | 440 | 1,886 | 3,564 | 3,692 | 3,874 |
| Short-term debt | - | 153 | 153 | 153 | 153 | 153 | 153 |
| Other current liabilities | 43 | 36 | 36 | 36 | 36 | 36 | 36 |
| Current liabilities | 347 | 522 | 629 | 2,076 | 3,753 | 3,881 | 4,064 |
| Long-term debt | - | - | - | - | - | - | - |
| Other long-term liabilities | 89 | 86 | 86 | 86 | 86 | 86 | 86 |
| Non-current liabilities | 89 | 86 | 86 | 86 | 86 | 86 | 86 |
| Total liabilities | 437 | 608 | 715 | 2,162 | 3,839 | 3,967 | 4,150 |
| Common stock | 2,476 | 2,500 | 5,789 | 5,789 | 5,789 | 5,789 | 5,789 |
| Retained earnings | 276 | 273 | 366 | 2,320 | 7,806 | 15,064 | 23,549 |
| Other common equity | (222) | (225) | (225) | (225) | (225) | (225) | (225) |
| Total common equity | 2,531 | 2,549 | 5,930 | 7,885 | 13,370 | 20,629 | 29,113 |
| Minority interest | - | - | - | - | - | - | - |
| Total equity | 2,531 | 2,549 | 5,930 | 7,885 | 13,370 | 20,629 | 29,113 |
| BVPS (NT$) | 25.00 | 24.59 | 54.09 | 71.92 | 121.95 | 188.15 | 265.53 |
| Cash conversion cycle | |||||||
| Account receivable days | 78 | 56 | 50 | 25 | 22 | 25 | 23 |
| Inventory days | 82 | 83 | 80 | 60 | 55 | 60 | 57 |
| Net payable days | 73 | 76 | 60 | 60 | 60 | 65 | 62 |
| Cash conversion cycle | 87 | 63 | 70 | 25 | 17 | 20 | 18 |
| Ratios | |||||||
| ROE (common equity) | -2% | 1% | 2% | 28% | 52% | 43% | 34% |
| ROA | -2% | 1% | 2% | 23% | 40% | 35% | 29% |
| Net debt to total equity | -58% | -49% | -46% | -38% | -43% | -62% | -74% |
| Net cash per share (NT$) | 14.52 | 12.15 | 24.79 | 27.05 | 52.37 | 116.95 | 195.26 |
| Total liabilities to total assets | 15% | 19% | 11% | 22% | 22% | 16% | 12% |
| Dupont analysis | |||||||
| Asset turnover | 0.5 | 0.6 | 0.6 | 1.3 | 1.9 | 1.6 | 1.3 |
| Leverage (assets to equity) | 1.2 | 1.2 | 1.2 | 1.2 | 1.3 | 1.2 | 1.2 |
| Net margin | -4% | 1% | 3% | 18% | 21% | 22% | 23% |
| CROCI (EDBITA/total equity) | 1% | 5% | 4% | 37% | 58% | 50% | 41% |
Source: Company data, Goldman Sachs Global Investment Research
Exhibit 26: FOCI's cash fl ow statement
| NT$m | 2024 | 2025 | 2026E | 2027E | 2028E | 2029E | 2030E |
|---|---|---|---|---|---|---|---|
| Cash flow statement | |||||||
| Net income | (48) | 16 | 92 | 1,955 | 5,485 | 7,259 | 8,485 |
| Minority interest add-back | - | - | - | - | - | - | - |
| Depreciation and amortization add-back | 114 | 123 | 178 | 495 | 856 | 1,187 | 1,215 |
| (Increase)/decrease in working capital | 81 | (78) | (344) | (56) | (1,191) | (38) | (6) |
| Other operating cash flow items | (77) | (78) | - | - | - | - | - |
| Cash flow from operating | 70 | (17) | (74) | 2,393 | 5,151 | 8,408 | 9,693 |
| Capital expenditure | (182) | (219) | (1,740) | (2,130) | (2,359) | (1,312) | (1,092) |
| Other investment cash flow items | 200 | 54 | (16) | (16) | (16) | (16) | (16) |
| Cash flow from investing | 19 | (165) | (1,756) | (2,145) | (2,375) | (1,327) | (1,108) |
| Dividends paid | (49) | - | - | - | - | - | - |
| Change in common stock | 473 | 24 | 3,289 | - | - | - | - |
| Increase/(decrease) in short-term debt | - | 153 | - | - | - | - | - |
| Increase/(decrease) in long-term debt | - | - | - | - | - | - | - |
| Other financing cash flow items | 30 | (56) | - | - | - | - | - |
| Cash flow from financing | 453 | 122 | 3,289 | - | - | - | - |
| Net change in cash | 557 | (58) | 1,459 | 248 | 2,776 | 7,081 | 8,585 |
| FCF | (112) | (236) | (1,814) | 264 | 2,792 | 7,096 | 8,601 |
| Ratio | |||||||
| Capex to revenue | 13% | 12% | 60% | 20% | 9% | 4% | 3% |
Source: Company data, Goldman Sachs Global Investment Research
e92c7a75ab8b4efbba794e6b187208c8
For the exclusive use of KEVINLU@LENOVO.COM
Valuation and Risks
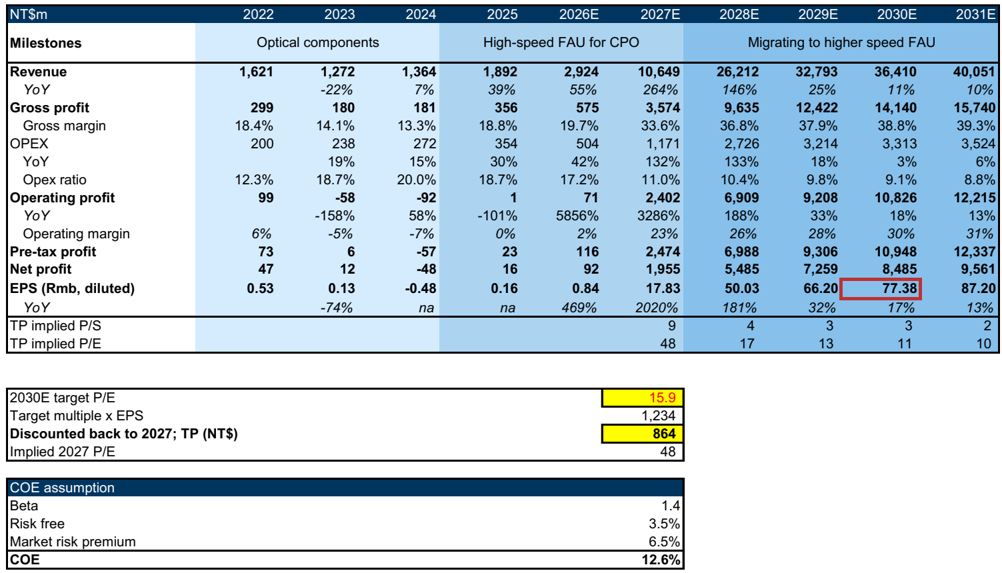
We derive our 12-month target price of NT$864 based on a discounted P/E methodology to capture the company's long-term growth, which is consistent with our Greater China Tech coverage. Our 2030E target P/E multiple of 15.9x is based on the peers' correlation between forward-year trading P/E and earnings growth, with FOCI's 2030-31E average net income YoY at 15%. We apply the 15.9x target P/E to 2030E EPS and discount it back to 2027E with a COE of 12.6%. With a potential 49% upside to our target price, we initiate coverage on FOCI at Buy. Our TP-implied PEG is at 0.8x, within the peers' range of 0.3x-1.2x.
Exhibit 27: Our target P/E multiple is derived from peers' correlation between P/E and forward-year NI YoY growth
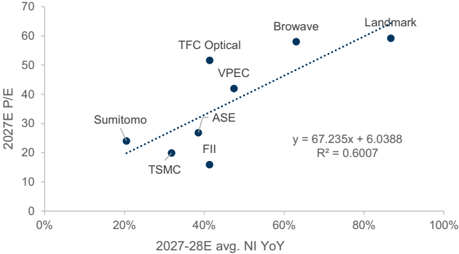
Estimates for not covered (NC) names are based on consensus.
Source: Company data, Goldman Sachs Global Investment Research, Re fi nitiv Eikon
Exhibit 29: FOCI and peers' PEG ratio
| Company | FOCI | Company | FII | Browave | Landmark | VPEC | TFC Optical | Sumitomo | ASE | TSMC |
|---|---|---|---|---|---|---|---|---|---|---|
| Ticker | 3363.TWO | Ticker | 601138.SS | 3163.TWO | 3081.TWO | 2455.TW | 300394.SZ | 5802.T | ASX | 2330.TW |
| Rating | Buy | Rating | Buy | NC | Buy | Buy | Buy | Buy | NC | Buy |
| 2030E TP implied P/E | 11 | 2027E trading P/E | 16 | 58 | 59 | 42 | 52 | 24 | 27 | 20 |
| 2030-31E avg. NI YoY | 15% | 2027-28E avg. NI YoY | 41% | 63% | 87% | 47% | 41% | 1.2 | 0.7 | 0.6 |
| PEG | 0.8 | PEG | 0.4 | 0.9 | 0.7 | 0.9 | 1.2 | 0.2 | 0.4 | 0.3 |
Estimates for not covered (NC) names are based on consensus.
Source: Company data, Goldman Sachs Global Investment Research, Re fi nitiv Eikon
Exhibit 28: FOCI's 12M forward P/S
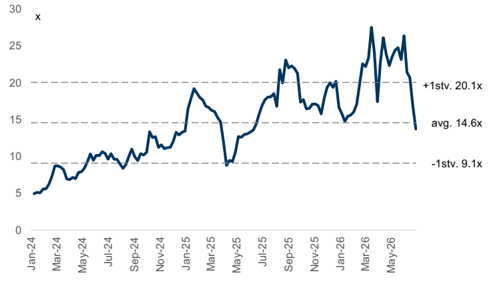
Source: Re fi nitiv Eikon
e92c7a75ab8b4efbba794e6b187208c8
For the exclusive use of KEVINLU@LENOVO.COM
Exhibit 30: FOCI's discounted P/E
| NT$m | 2022 | 2023 | 2024 | 2025 | 2026E | 2027E | 2028E | 2029E | 2030E | 2031E |
|---|---|---|---|---|---|---|---|---|---|---|
| Milestones | Optical components | Optical components | Optical components | High-speed FAU for CPO | High-speed FAU for CPO | High-speed FAU for CPO | Migrating to higher speed FAU | Migrating to higher speed FAU | Migrating to higher speed FAU | Migrating to higher speed FAU |
| Revenue | 1,621 | 1,272 | 1,364 | 1,892 | 2,924 | 10,649 | 26,212 | 32,793 | 36,410 | 40,051 |
| YoY | -22% | 7% | 39% | 55% | 264% | 146% | 25% | 11% | 10% | |
| Gross profit | 299 | 180 | 181 | 356 | 575 | 3,574 | 9,635 | 12,422 | 14,140 | 15,740 |
| Gross margin | 18.4% | 14.1% | 13.3% | 18.8% | 19.7% | 33.6% | 36.8% | 37.9% | 38.8% | 39.3% |
| OPEX | 200 | 238 | 272 | 354 | 504 | 1,171 | 2,726 | 3,214 | 3,313 | 3,524 |
| YoY | 19% | 15% | 30% | 42% | 132% | 133% | 18% | 3% | 6% | |
| Opex ratio | 12.3% | 18.7% | 20.0% | 18.7% | 17.2% | 11.0% | 10.4% | 9.8% | 9.1% | 8.8% |
| Operating profit | 99 | -58 | -92 | 1 | 71 | 2,402 | 6,909 | 9,208 | 10,826 | 12,215 |
| YoY | -158% | 58% | -101% | 5856% | 3286% | 188% | 33% | 18% | 13% | |
| Operating margin | 6% | -5% | -7% | 0% | 2% | 23% | 26% | 28% | 30% | 31% |
| Pre-tax profit | 73 | 6 | -57 | 23 | 116 | 2,474 | 6,988 | 9,306 | 10,948 | 12,337 |
| Net profit | 47 | 12 | -48 | 16 | 92 | 1,955 | 5,485 | 7,259 | 8,485 | 9,561 |
| EPS (Rmb, diluted) | 0.53 | 0.13 | -0.48 | 0.16 | 0.84 | 17.83 | 50.03 | 66.20 | 77.38 | 87.20 |
| YoY | -74% | na | na | 469% | 2020% | 181% | 32% | 17% | 13% | |
| TP implied P/S | 9 | 4 | 3 | 3 | 2 | |||||
| TP implied P/E | 48 | 17 | 13 | 11 | 10 |
Source: Company data, Goldman Sachs Global Investment Research
Exhibit 31: FOCI's peers comp table
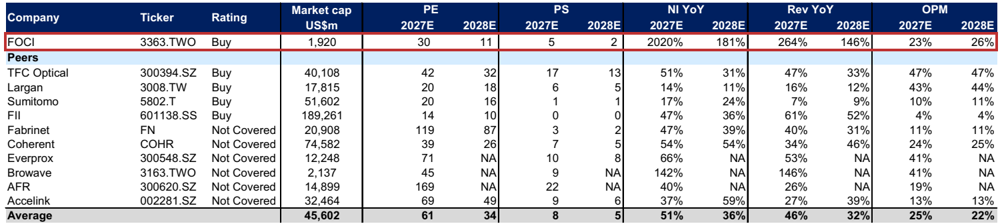
| Company | Ticker | Rating | Market cap | PE | PE | PS | PS | NI YoY | NI YoY | Rev YoY | Rev YoY | OPM | OPM |
|---|---|---|---|---|---|---|---|---|---|---|---|---|---|
| Company | Ticker | Rating | US$m | 2027E | 2028E | 2027E | 2028E | 2027E | 2028E | 2027E | 2028E | 2027E | 2028E |
| FOCI | 3363.TWO | Buy | 1,920 | 30 | 11 | 5 | 2 | 2020% | 181% | 264% | 146% | 23% | 26% |
| Peers | |||||||||||||
| TFC Optical | 300394.SZ | Buy | 40,108 | 42 | 32 | 17 | 13 | 51% | 31% | 47% | 33% | 47% | 47% |
| Largan | 3008.TW | Buy | 17,815 | 20 | 18 | 6 | 5 | 14% | 11% | 16% | 12% | 43% | 44% |
| Sumitomo | 5802.T | Buy | 51,602 | 20 | 16 | 1 | 1 | 17% | 24% | 7% | 9% | 10% | 11% |
| FII | 601138.SS | Buy | 189,261 | 14 | 10 | 0 | 0 | 47% | 36% | 61% | 52% | 4% | 4% |
| Fabrinet | FN | Not Covered | 20,908 | 119 | 87 | 3 | 2 | 47% | 39% | 40% | 31% | 11% | 11% |
| Coherent | COHR | Not Covered | 74,582 | 39 | 26 | 7 | 5 | 54% | 54% | 34% | 46% | 24% | 25% |
| Everprox | 300548.SZ | Not Covered | 12,248 | 71 | NA | 10 | 8 | 66% | NA | 53% | NA | 41% | NA |
| Browave | 3163.TWO | Not Covered | 2,137 | 45 | NA | 9 | NA | 142% | NA | 146% | NA | 41% | NA |
| AFR | 300620.SZ | Not Covered | 14,899 | 169 | NA | 22 | NA | 40% | NA | 26% | NA | 19% | NA |
| Accelink | 002281.SZ | Not Covered | 32,464 | 69 | 49 | 9 | 6 | 37% | 59% | 27% | 39% | 13% | 13% |
| Average | 45,602 | 61 | 34 | 8 | 5 | 51% | 36% | 46% | 32% | 25% | 22% |
Data as of Jul 3, 2026. Estimates for not covered (NC) names are based on consensus.
Source: Company data, Goldman Sachs Global Investment Research, Re fi nitiv Eikon
M&A framework: We assign an M&A rank of 3 (indicating a low probability of the company being acquired) to FOCI, given its long operational history and that it is currently in a rapid growth stage driven by its CPO FAU business, and therefore, we do not include any M&A component in our price target.
Key downside risks
- Fiercer-than-expected market competition: We see peers proactively developing n and promoting their FAU products, and fi ercer-than-expected market competition could weigh on FOCI's revenue and earnings growth.
- Technology migration trend in optical networking: We see fast technology n migration in the optical networking market, and the development of new solutions that could outperform FAU could drag on FOCI's growth going forward, as we model
e92c7a75ab8b4efbba794e6b187208c8
For the exclusive use of KEVINLU@LENOVO.COM
FAU as FOCI's key growth driver.
- Slower-than-expected capacity ramp up: FOCI is expanding its CPO FAU capacity n to support rising end demand. If FOCI's capacity expansion pace or yield rate is lower than expected, it would pose downside risks to our forecasts for FOCI's shipment and revenue growth.
FOCI is an optical component supplier expanding from telecom to AIDC, co-designing and providing high-speed FAU for global-leading CPO switch players. We are positive on FOCI's earnings growth going forward, driven by (1) business expansion from optical components for telecom operators to FAU ( fi ber array unit) used in CPO switches, (2) increasing CPO switch shipments globally, (3) collaboration with global-leading CPO switch players in FAU design and manufacturing, (4) fully-automated FAU packaging technology supporting manufacturing e ffi ciency and driving yield rates, (5) pro fi tability improvement driven by the rising contribution from CPO FAU, (6) product migration toward higher-speed FAU (e.g., from 3.2T to 6.4T), and (7) capacity expansion in the coming years. We are Buy-rated on FOCI.
Valuation: Our 12-month target price of NT$864 is based on a 15.9x 2030E P/E, discounted back to 2027E at a COE of 12.6%. Our target multiple is derived from peers' correlation between forward-year trading P/E and earnings growth.
Key downside risks: Fiercer-than-expected market competition, technology migration trends in optical networking, and slower-than-expected capacity ramp-up.
e92c7a75ab8b4efbba794e6b187208c8
For the exclusive use of KEVINLU@LENOVO.COM