PDF 原檔:報告_GFHK_記憶體NAND_20260920_original.pdf
圖片清單(已驗證 2026-09-24)
| 檔名 | size | 分類 | 親眼所見內容 |
|---|---|---|---|
報告_GFHK_記憶體NAND_20260920_002.png |
63.3KB | 真資料圖 | Figure 1:DRAM 合約價 QoQ 估計柱狀圖(PC DDR4/DDR5、Server DDR4/DDR5 等細分)+ Server DDR5 64GB 現貨均價折線(右軸),1Q22-2Q27E,1Q26-2Q26 QoQ 漲幅逾 80% |
報告_GFHK_記憶體NAND_20260920_003.png |
54.3KB | 真資料圖 | Figure 2:NAND 合約價 QoQ 估計柱狀圖(eMMC/UFS、Enterprise SSD、Client SSD、Blended NAND)+ eSSD 每 GB 均價折線(右軸),1Q22-2Q27E,1Q26-2Q26 Enterprise SSD QoQ 逼近 80% |
報告_GFHK_記憶體NAND_20260920_005.png |
60.6KB | 真資料圖 | 記憶體階層金字塔圖:SRAM/DRAM/SCM/Flash Memory 由上而下依 Bitcost(低→高)與 Latency(高→低)排列,並標示 PCRAM/MRAM/ReRAM 與 Low latency flash 正推動 SCM 層發展 |
其餘 001(Jeff Pu 頭像/機構 banner)、004(<40KB,NAND supply bit growth 圖,依 trimmed 描述判斷為真資料圖但未逐張放大驗證)。
原始內容
Memory: NAND Pricing Breakout Driven by eSSD
Jeff Pu, CFA
SFC CE No. BNO719
jeffpu@gfgroup.com.hk Henry Huang SFC CE No. BYA749
henryhuang@gfgroup.com.hk
What's New?
According to TrendForce, the leading third-party memory research firm, NAND demand is tracking materially stronger than expected, driven by eSSD as U.S. CSPs scale AI infrastructure. Following our recent bullish sector notes focused on DRAM (Intact DRAM on Sept 6; HBM Unlikely to be 4-Hi on Sept 14), we now see NAND fundamentals re-accelerating. We revise our NAND contract price outlook meaningfully higher, forecasting 3Q26/4Q26/1Q27 QoQ increases of 21%/17%/15%, vs. prior expectations of 18%/2%/0%.
Comments
Raise our NAND price estimates meaningfully: We lift our NAND contract price expectations for 3Q26/4Q26/1Q27 to 21%/17%/15% QoQ, up from 18%/2%/0%, driven by stronger-than-expected eSSD demand. Inventory at U.S. hyperscalers is expected to trend lower, with levels expected to decline by 4Q26 from ~14 weeks in July (vs. ~15-week normal). On supply, we continue to expect disciplined bit growth of 15%/21%/20% YoY in 2025/2026/2027. Meanwhile, eSSD demand from U.S. hyperscalers has nearly doubled vs. prior projections, implying demand growth will outpace supply at least over the near-term quarters.
eSSD/AI demand the key driver amid suppliers' increased confidence: According to TrendForce, a sharp structural split is emerging in NAND, with enterprise demand materially outpacing consumer segments. eSSD pull-ins remain strong, particularly from U.S. CSPs scaling AI infrastructure, with both TLC and increasingly QLC SSDs seeing accelerated uptake. Confidence in this demand is underpinned by AI workloads shifting from training toward agentic-AI, vector databases, and KV-cache offloading, where eSSD offers a superior cost-per-bit vs. DRAM and better power efficiency vs. HDD.
AI to reshape the storage hierarchy leading to content gains of NAND: AI workloads are breaking the traditional memory-storage hierarchy that relied on a clean separation between DRAM → NAND (SLC/MLC/TLC/QLC) → HDD. However, AI introduces continuous, high-throughput, low-latency access to massive datasets. This gap is being filled by Storage Class Memory (SCM), a new tier 'near-memory storage,' delivering better latency and DRAM-like read performance. Below SCM, QLC NAND becomes the bulk layer for AI data lakes, providing extreme density and cost efficiency for petabyte-scale training corpora. The result is a more granular, AI-specific hierarchy: DRAM → SCM → TLC/QLC NAND → HDD.
Recommendations
We remain bullish on DRAM/HBM names such as SK Hynix (000660 KS) and Micron (MU). We now also like NAND flash sector with names of three major memory makers (Samsung, SK Hynix and MU) who are the main suppliers of eSSD. We expect NAND flash supply chain such as SanDisk (SNDK), Phison (8299 TT), etc to outperform as well.
Risks: 1) AI demand slowdown, 2) infrastructure deployment, 3) supply constraints, 4) competition.
Focus Charts
Figure 1: DRAM Contract Price QoQ Estimates
Sources: TrendForce, GF Securities (Hong Kong) Brokerage
Figure 2: NAND Contract Price QoQ Estimates
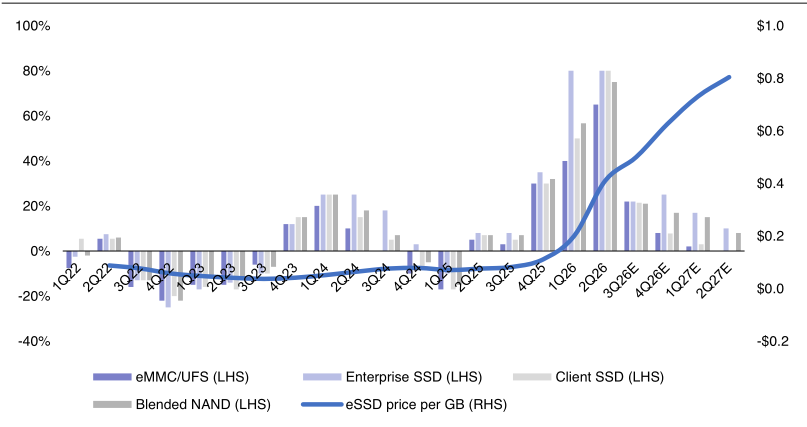
Sources: TrendForce, GF Securities (Hong Kong) Brokerage
Figure 3: NAND Flash industry supply bit growth
Sources: TrendForce, GF Securities (Hong Kong) Brokerage
Figure 4: Memory hierarchy including SCM layer
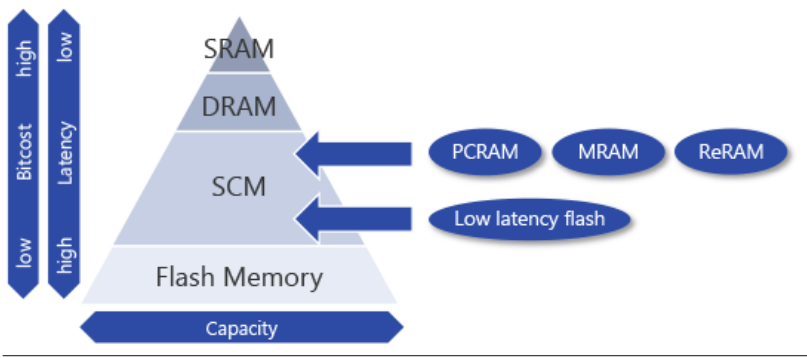
Sources: Kioxia, GF Securities (Hong Kong) Brokerage
Risks
- 1) AI demand slowdown, 2) infrastructure deployment, 3) supply constraints, 4) competition.
Rating definitions Benchmark: Hang Seng Index (Hong Kong)
| Company ratings | Buy Hold Underperform | Stock expected to outperform benchmark by more than 10% Expected stock relative performance ranges between -10% and 10% Stock expected to underperform benchmark by more than 10% |
|---|---|---|
| Sector ratings | Positive Neutral Cautious | Sector expected to outperform benchmark by more than 10% Expected sector relative performance ranges between -10% and 10% Sector expected to underperform benchmark by more than 10% |
| Hong Kong | Company Address Telephone Email | GF Securities (Hong Kong) Brokerage Limited 27/F, GF Tower, 81 Lockhart Road, Wan Chai, Hong Kong (852) 37191111 evanlee@gfgroup.com.hk |