PDF 原檔:報告_Daiwa_聯詠3034_20260806_original.pdf
圖片清單(已驗證 2026-08-07)
| 檔名 | size | 分類 | 親眼所見內容 |
|---|---|---|---|
報告_Daiwa_聯詠3034_20260806_002.png |
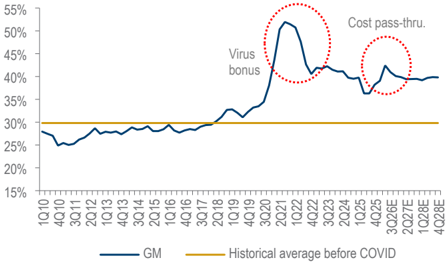
49KB | 真資料圖 | 聯詠季度毛利率趨勢圖(1Q10-4Q28E),紅圈標示「Virus bonus」(2020-21)與「Cost pass-thru」(2025-26)兩波 GM 高峰,30% 為 COVID 前歷史均值線 |
報告_Daiwa_聯詠3034_20260806_003.png |
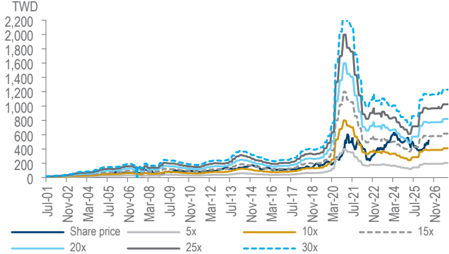
56KB | 真資料圖 | 4 季 forward PER band 圖:股價疊加 5x/10x/15x/20x/25x/30x 倍數帶,2001-2026 |
<40KB(
_001.png)未逐張 Read,預設列為裝飾,未列入清單。
原始內容
Taiwan
Novatek Microelectronics (3034 TT)
Target price:
TWD515.00 (from TWD430.00)
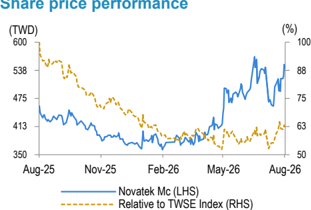
Share price (6 Aug): TWD543.00 |
Up/downside: -5.2%
Rebalancing still yet resilience on share gain
- 2Q26 results and 3Q26 guidance all upbeat
- Consumer rebalancing offset by high-end smartphone share gain
- Reiterating Hold (3) rating with a higher 12M TP of TWD515
What's new: Novatek disclosed upbeat 2Q26 results and 3Q26 guidance thanks to continued supply-chain cost pass-through, as well as share gain in the high-end smartphone OLED display driver (D/D) market. Though we raise forecasts and TP to reflect these unusual business dynamics amid the 'silicon inflation', we remain comfortable with our Hold (3) rating. That said, we are structurally positive on its leading position in design and technology for SoC diversification to cope with the D/D competition.
What's the impact: Results and guidance all beat yet ... Novatek reported 2Q26 EPS of TWD10.4, beating our / consensus estimates by 31%/36% thanks to robust gross margin (GM) that beat guidance (38-41%) and market expectation on supply-chain cost pass-through, favourable SoC mix and low-cost inventory, as well as frugal opex control and higher nonoperating gains associated with investment and dividend incomes (table on p.2). Guidance calls for 3Q26 revenue to still grow 5-9% QoQ regardless of a demand slowdown in the consumer space. Yet guided GM of 38.5-41.5% implies a QoQ drop due to no more low-cost inventory and an unfavourable mix as small-and-medium D/D will drive the growth, while SoC revenue will be flat and large D/D will drop QoQ, per management.
… business dynamics don't seem to be structural. While our view calling for a demand rebalancing across TV and PC in the consumer space after customers' order pull-in in 1H26 appears to be materialising, per management's comments at today's call, Novatek's share gain in the highend smartphone OLED D/D market looks to be helping it offset the impact, with extra delta to be contributed by the continued pass-through of wafer and OSAT cost hikes through the supply chain. We therefore lift our 202628E EPS by 2-21% but view these dynamics as unusual amid the 'silicon inflation' environment. That said, we remain structurally positive on Novatek's leading position in design capability and process technology for diversification into a broadened SoC portfolio to cope with any intense D/D competition, including machine-vision solutions for applications from surveillance to drones, smart wearables, smart appliances to robotics.
What we recommend: Given our forecast revisions, we raise our 12M TP for Novatek to TWD515 (previous: TWD430), still based on our 4-quarter forward PER target of 13x. We reaffirm our Hold (3) rating with key upside/downside risks of any further cost pass-through/deteriorated enddemand on commodity price hikes.
How we differ: Our 2026-28E EPS are 20-24% above the consensus, as we believe the street has yet to factor in the full effect of the cost passthrough.
Daiwa
5
3
Hold
Rick Hsu
Rick Hsu
(886) 2 8758 6261 rick.hsu@daiwacm-cathay.com.tw
Sharon Kao (886) 2 8758 6255 sharon.kao@daiwacm-cathay.com.tw
Forecast revisions (%)
| Year to 31 Dec | 26E | 27E | 28E |
|---|---|---|---|
| Revenue change | 5.5 | 9.9 | 8.1 |
| Net profit change | 20.5 | 14.1 | 2.2 |
| Core EPS (FD) change | 20.5 | 14.1 | 2.2 |
Source: Daiwa forecasts
| 12-month range | 361.00-567.00 |
|---|---|
| Market cap (USDbn) | 10.23 |
| 3m avg daily turnover (USDm) | 101.63 |
| Shares outstanding (m) | 608 |
| Major shareholder | Polaris Securities Inv. Trust (4.2%) |
Financial summary (TWD)
| Year to 31 Dec | 26E | 27E | 28E |
|---|---|---|---|
| Revenue (m) | 113,207 | 135,074 | 150,682 |
| Operating profit (m) | 23,850 | 27,380 | 30,249 |
| Net profit (m) | 22,065 | 23,821 | 26,253 |
| Core EPS (fully-diluted) | 36.240 | 39.123 | 43.118 |
| EPS change (%) | 35.0 | 8.0 | 10.2 |
| Daiwa vs Cons. EPS (%) | 23.9 | 19.9 | 20.5 |
| PER (x) | 15.0 | 13.9 | 12.6 |
| Dividend yield (%) | 4.2 | 4.7 | 5.3 |
| DPS | 23.0 | 25.5 | 29.0 |
| PBR (x) | 4.4 | 3.9 | 3.6 |
| EV/EBITDA (x) | 10.8 | 9.5 | 8.1 |
| ROE (%) | 30.7 | 29.8 | 29.7 |
Source: FactSet, Daiwa forecasts
Novatek: quarterly P&L estimates and forecasts
Daiwa
| TWDm | 1Q26 | 2Q26E | 3Q26E | 4Q26E | 1Q27E | 2Q27E | 3Q27E | 4Q27E | 2025 | 2026E | 2027E | 2028E |
|---|---|---|---|---|---|---|---|---|---|---|---|---|
| Revenue | 23,145 | 28,660 | 31,052 | 30,350 | 29,911 | 33,605 | 35,910 | 35,648 | 100,663 | 113,207 | 135,074 | 150,682 |
| COGS | -14,105 | -16,503 | -18,333 | -18,182 | -17,987 | -20,361 | -21,745 | -21,572 | -62,755 | -67,123 | -81,666 | -90,933 |
| Gross profit | 9,040 | 12,157 | 12,719 | 12,168 | 11,924 | 13,244 | 14,165 | 14,076 | 37,908 | 46,084 | 53,409 | 59,749 |
| Opex | -5,012 | -5,691 | -5,869 | -5,662 | -5,727 | -6,337 | -6,886 | -7,078 | -19,671 | -22,234 | -26,028 | -29,500 |
| Operating profit | 4,028 | 6,466 | 6,850 | 6,506 | 6,197 | 6,907 | 7,279 | 6,998 | 18,237 | 23,850 | 27,380 | 30,249 |
| Pretax profit | 4,389 | 7,782 | 7,348 | 7,004 | 6,495 | 7,205 | 7,577 | 7,296 | 19,534 | 26,524 | 28,572 | 31,441 |
| Income taxes | -622 | -1,454 | -1,220 | -1,163 | -1,072 | -1,203 | -1,273 | -1,204 | -3,186 | -4,459 | -4,752 | -5,188 |
| Net profit | 3,767 | 6,328 | 6,129 | 5,842 | 5,423 | 6,001 | 6,304 | 6,092 | 16,348 | 22,065 | 23,821 | 26,253 |
| FD O/S (m) | 609 | 609 | 609 | 609 | 609 | 609 | 609 | 609 | 609 | 609 | 609 | 609 |
| FD EPS (TWD) | 6.19 | 10.39 | 10.07 | 9.59 | 8.91 | 9.86 | 10.35 | 10.01 | 26.85 | 36.24 | 39.12 | 43.12 |
| Revenue mix | ||||||||||||
| Large D/D | 23% | 20% | 21% | 21% | 19% | 20% | 21% | 20% | 23% | 21% | 20% | 17% |
| Small/medium D/D | 33% | 28% | 31% | 32% | 32% | 31% | 30% | 30% | 40% | 31% | 31% | 34% |
| SoC | 44% | 52% | 47% | 47% | 49% | 49% | 49% | 50% | 36% | 48% | 49% | 49% |
| Margin | ||||||||||||
| Gross | 39.1% | 42.4% | 41.0% | 40.1% | 39.9% | 39.4% | 39.4% | 39.5% | 37.7% | 40.7% | 39.5% | 39.7% |
| Opex | -21.7% | -19.9% | -18.9% | -18.7% | -19.1% | -18.9% | -19.2% | -19.9% | -19.5% | -19.6% | -19.3% | -19.6% |
| Operating | 17.4% | 22.6% | 22.1% | 21.4% | 20.7% | 20.6% | 20.3% | 19.6% | 18.1% | 21.1% | 20.3% | 20.1% |
| Net | 16.3% | 22.1% | 19.7% | 19.2% | 18.1% | 17.9% | 17.6% | 17.1% | 16.2% | 19.5% | 17.6% | 17.4% |
| Growth (QoQ) | ||||||||||||
| Revenue | 1% | 24% | 8% | -2% | -1% | 12% | 7% | -1% | ||||
| Gross profit | 4% | 34% | 5% | -4% | -2% | 11% | 7% | -1% | ||||
| Operating profit | 4% | 61% | 6% | -5% | -5% | 11% | 5% | -4% | ||||
| Net profit | 2% | 68% | -3% | -5% | -7% | 11% | 5% | -3% | ||||
| FD EPS | 2% | 68% | -3% | -5% | -7% | 11% | 5% | -3% | ||||
| Growth (YoY) | ||||||||||||
| Revenue | -15% | 10% | 26% | 33% | 29% | 17% | 16% | 17% | -2% | 12% | 19% | 12% |
| Gross profit | -16% | 28% | 43% | 40% | 32% | 9% | 11% | 16% | -9% | 22% | 16% | 12% |
| Operating profit | -29% | 34% | 78% | 68% | 54% | 7% | 6% | 8% | -16% | 31% | 15% | 10% |
| Net profit | -28% | 69% | 68% | 58% | 44% | -5% | 3% | 4% | -19% | 35% | 8% | 10% |
| FD EPS | -28% | 69% | 68% | 58% | 44% | -5% | 3% | 4% | -19% | 35% | 8% | 10% |
Source: Company, Daiwa estimates and forecasts
Novatek: 2Q26 results review and 3Q26 guidance check
| 2Q26 | 2Q26 | 2Q26 | Variance | Variance | Growth | Growth | 3Q26E | 3Q26E | |
|---|---|---|---|---|---|---|---|---|---|
| TWDm | Actual | Daiwa | Consensus | Daiwa | Consensus | QoQ | YoY | Guidance | Daiwa (previous) |
| Revenue | 28,660 | 28,412 | 27,980 | 1% | 2% | 24% | 10% | Revenue = TWD30.0-31.2bn | c.TWD28bn |
| Gross profit | 12,157 | 11,198 | 11,083 | 9% | 10% | 34% | 28% | GM=38.5-41.5% | 39.5% |
| Opex | 5,691 | 5,910 | 5,857 | -4% | -3% | 14% | 22% | OPM=19-22% | 20.1% |
| Operating profit | 6,466 | 5,288 | 5,226 | 22% | 24% | 61% | 34% | ||
| Pretax profit | 7,782 | 5,786 | 5,645 | 34% | 38% | 77% | 69% | ||
| Net profit | 6,328 | 4,825 | 4,640 | 31% | 36% | 68% | 69% | ||
| Adjusted EPS (TWD) | 10.39 | 7.93 | 7.62 | 31% | 36% | 68% | 69% | ||
| Margin | |||||||||
| Gross | 42.4% | 39.4% | 39.6% | 3.0% | 2.8% | ||||
| Operating | 22.6% | 18.6% | 18.7% | 3.9% | 3.9% | ||||
| Net | 22.1% | 17.0% | 16.6% | 5.1% | 5.5% | ||||
| Revenue mix* | |||||||||
| Large D/D | 22% | ||||||||
| Small/medium D/D | 43% | ||||||||
| SoC | 35% |
Source: Company, Daiwa estimates and forecasts
Note: * D/D = display driver IC, SoC = system on a chip
Novatek: quarterly gross margin trend
Source: Company, Daiwa estimates and forecasts
Novatek Microelectronics (3034 TT): 6 August 2026
Novatek: 4-quarter forward PER bands
Source: Company, TEJ, Daiwa forecasts
Financial summary
Key assumptions
| Year to 31 Dec | 2021 | 2022 | 2023 | 2024 | 2025 | 2026E | 2027E | 2028E |
|---|---|---|---|---|---|---|---|---|
| Large-size D/D shipment (mn unit) | 3,520 | 2,319 | 2,708 | 2,693 | 2,746 | 2,960 | 3,217 | 3,326 |
| Large-size D/D ASP (USD) | 0.4 | 0.4 | 0.3 | 0.3 | 0.3 | 0.3 | 0.3 | 0.2 |
| Small-size D/D shipment (mn unit) | 557 | 442 | 441 | 415 | 485 | 419 | 465 | 612 |
Profit and loss (TWDm)
| Year to 31 Dec | 2021 | 2022 | 2023 | 2024 | 2025 | 2026E | 2027E | 2028E |
|---|---|---|---|---|---|---|---|---|
| Large-size D/D Revenue | 40,778 | 29,566 | 29,103 | 25,947 | 23,566 | 23,998 | 27,086 | 25,974 |
| SoC Revenue | 43,653 | 37,265 | 43,408 | 39,568 | 36,527 | 54,236 | 66,390 | 74,096 |
| Other Revenue | 50,935 | 43,126 | 37,918 | 37,273 | 40,570 | 34,973 | 41,599 | 50,612 |
| Total Revenue | 135,366 | 109,957 | 110,429 | 102,788 | 100,663 | 113,207 | 135,074 | 150,682 |
| Other income | 0 | 0 | 0 | 0 | 0 | 0 | 0 | 0 |
| COGS | (67,974) | (59,015) | (78,184) | (61,315) | (62,755) | (67,123) | (81,666) | (90,933) |
| SG&A | (3,018) | (2,802) | (2,759) | (2,859) | (2,946) | (3,069) | (3,427) | (3,839) |
| Other op.expenses | (16,601) | (15,410) | (20,565) | (16,807) | (16,725) | (19,165) | (22,601) | (25,661) |
| Operating profit | 47,773 | 32,729 | 8,921 | 21,806 | 18,237 | 23,850 | 27,380 | 30,249 |
| Net-interest inc./(exp.) | 107 | 509 | 1,234 | 1,296 | 1,019 | 1,460 | 1,192 | 1,192 |
| Assoc/forex/extraord./others | 234 | 1,274 | 336 | 776 | 278 | 1,214 | 0 | 0 |
| Pre-tax profit | 48,115 | 34,511 | 10,490 | 23,878 | 19,534 | 26,524 | 28,572 | 31,441 |
| Tax | (9,249) | (6,542) | (6,024) | (3,784) | (3,186) | (4,459) | (4,752) | (5,188) |
| Min. int./pref. div./others | 0 | 0 | 0 | 0 | 0 | 0 | 0 | 0 |
| Net profit (reported) | 38,866 | 27,970 | 4,466 | 20,094 | 16,348 | 22,065 | 23,821 | 26,253 |
| Net profit (adjusted) | 38,866 | 27,970 | 4,466 | 20,094 | 16,348 | 22,065 | 23,821 | 26,253 |
| EPS (reported)(TWD) | 63.771 | 45.868 | 7.331 | 32.991 | 26.849 | 36.240 | 39.123 | 43.118 |
| EPS (adjusted)(TWD) | 63.771 | 45.868 | 7.331 | 32.991 | 26.849 | 36.240 | 39.123 | 43.118 |
| EPS (adjusted fully-diluted)(TWD) | 63.771 | 45.868 | 7.331 | 32.991 | 26.849 | 36.240 | 39.123 | 43.118 |
| DPS (TWD) | 15.576 | 51.393 | 36.959 | 31.971 | 27.984 | 22.984 | 25.482 | 28.980 |
| EBIT | 47,773 | 32,729 | 8,921 | 21,806 | 18,237 | 23,850 | 27,380 | 30,249 |
| EBITDA | 48,874 | 33,961 | 10,261 | 23,120 | 19,573 | 25,302 | 29,014 | 32,068 |
Cash flow (TWDm)
| Year to 31 Dec | 2021 | 2022 | 2023 | 2024 | 2025 | 2026E | 2027E | 2028E |
|---|---|---|---|---|---|---|---|---|
| Profit before tax | 48,115 | 34,511 | 10,490 | 23,878 | 19,534 | 26,524 | 28,572 | 31,441 |
| Depreciation and amortisation | 1,101 | 1,233 | 1,340 | 1,314 | 1,336 | 1,452 | 1,633 | 1,819 |
| Tax paid | (9,249) | (6,542) | (6,024) | (3,784) | (3,186) | (4,459) | (4,752) | (5,188) |
| Change in working capital | (8,976) | 784 | 7,092 | (5,433) | (2,047) | 6,454 | (12,928) | 8,197 |
| Other operational CF items | 10,731 | (7,295) | 17,084 | 678 | (2,008) | 0 | 0 | 0 |
| Cash flow from operations | 41,721 | 22,691 | 29,981 | 16,652 | 13,629 | 29,972 | 12,526 | 36,269 |
| Capex | (845) | (839) | (808) | (1,175) | (1,211) | (679) | (810) | (904) |
| Net (acquisitions)/disposals | (13) | (258) | (201) | 0 | (154) | 0 | 0 | 0 |
| Other investing CF items | (7,556) | (1,770) | (693) | 326 | 134 | (250) | (250) | (250) |
| Cash flow from investing | (8,414) | (2,867) | (1,702) | (849) | (1,232) | (929) | (1,060) | (1,154) |
| Change in debt | 0 | 0 | 0 | 0 | 0 | 0 | 0 | 0 |
| Net share issues/(repurchases) | 0 | 0 | 0 | 0 | 0 | 0 | 0 | 0 |
| Dividends paid | (9,493) | (31,338) | (22,515) | (19,472) | (17,038) | (13,994) | (15,515) | (17,645) |
| Other financing CF items | 13,447 | 531 | (1,037) | (1,484) | (1,703) | 0 | 0 | 0 |
| Cash flow from financing | 3,955 | (30,807) | (23,552) | (20,956) | (18,741) | (13,994) | (15,515) | (17,645) |
| Forex effect/others | (8) | 25 | (8) | 34 | (8) | 0 | 0 | 0 |
| Change in cash | 37,254 | (10,958) | 4,719 | (5,119) | (6,352) | 15,048 | (4,050) | 17,470 |
| Free cash flow | 40,876 | 21,852 | 29,173 | 15,478 | 12,417 | 29,292 | 11,716 | 35,365 |
Source: FactSet, Daiwa forecasts
Novatek Microelectronics (3034 TT): 6 August 2026
Daiwa
Financial summary continued …
Balance sheet (TWDm)
| Year to 31 Dec | 2021 | 2022 | 2023 | 2024 | 2025 | 2026E | 2027E | 2028E |
|---|---|---|---|---|---|---|---|---|
| Cash & short-term investment | 61,672 | 51,483 | 54,738 | 49,048 | 42,697 | 57,745 | 53,695 | 71,165 |
| Inventory | 14,186 | 12,029 | 8,551 | 8,701 | 8,641 | 10,117 | 12,705 | 12,707 |
| Accounts receivable | 23,572 | 15,765 | 16,935 | 20,274 | 21,099 | 19,842 | 29,007 | 25,486 |
| Other current assets | 685 | 607 | 825 | 1,018 | 1,104 | 1,104 | 1,104 | 1,104 |
| Total current assets | 100,115 | 79,884 | 81,048 | 79,041 | 73,540 | 88,807 | 96,511 | 110,462 |
| Fixed assets | 6,906 | 7,052 | 6,876 | 7,023 | 7,210 | 7,017 | 6,848 | 6,661 |
| Goodwill & intangibles | 2,485 | 2,432 | 2,509 | 2,609 | 2,652 | 2,321 | 1,918 | 1,441 |
| Other non-current assets | 11,087 | 11,178 | 14,009 | 13,728 | 13,964 | 13,964 | 13,964 | 13,964 |
| Total assets | 120,593 | 100,546 | 104,443 | 102,401 | 97,366 | 112,110 | 119,240 | 132,527 |
| Short-term debt | 0 | 0 | 0 | 0 | 0 | 0 | 0 | 0 |
| Accounts payable | 27,123 | 15,655 | 19,870 | 17,664 | 15,788 | 22,461 | 21,286 | 25,965 |
| Other current liabilities | 8,786 | 8,777 | 5,869 | 6,700 | 4,064 | 4,064 | 4,064 | 4,064 |
| Total current liabilities | 35,909 | 24,432 | 25,739 | 24,364 | 19,851 | 26,525 | 25,350 | 30,028 |
| Long-term debt | 0 | 0 | 0 | 0 | 0 | 0 | 0 | 0 |
| Other non-current liabilities | 14,233 | 10,544 | 11,487 | 10,113 | 9,775 | 9,775 | 9,775 | 9,775 |
| Total liabilities | 50,142 | 34,976 | 37,226 | 34,477 | 29,627 | 36,300 | 35,125 | 39,804 |
| Share capital | 6,085 | 6,085 | 6,085 | 6,085 | 6,085 | 6,085 | 6,085 | 6,085 |
| Reserves/R.E./others | 64,366 | 59,485 | 61,132 | 61,838 | 61,654 | 69,725 | 78,030 | 86,639 |
| Shareholders' equity | 70,451 | 65,570 | 67,217 | 67,923 | 67,739 | 75,810 | 84,115 | 92,724 |
| Minority interests | 0 | 0 | 0 | 0 | 0 | 0 | 0 | 0 |
| Total equity & liabilities | 120,593 | 100,546 | 104,443 | 102,401 | 97,366 | 112,110 | 119,240 | 132,527 |
| EV | 268,716 | 278,904 | 275,650 | 281,339 | 287,691 | 272,643 | 276,692 | 259,222 |
| Net debt/(cash) | (61,672) | (51,483) | (54,738) | (49,048) | (42,697) | (57,745) | (53,695) | (71,165) |
| BVPS (TWD) | 115.776 | 107.755 | 110.461 | 111.622 | 111.319 | 124.596 | 138.246 | 152.394 |
Key ratios (%)
| Year to 31 Dec | 2021 | 2022 | 2023 | 2024 | 2025 | 2026E | 2027E | 2028E |
|---|---|---|---|---|---|---|---|---|
| Sales (YoY) | 69.3 | (18.8) | 0.4 | (6.9) | (2.1) | 12.5 | 19.3 | 11.6 |
| EBITDA (YoY) | 209.7 | (30.5) | (69.8) | 125.3 | (15.3) | 29.3 | 14.7 | 10.5 |
| Operating profit (YoY) | 223.3 | (31.5) | (72.7) | 144.4 | (16.4) | 30.8 | 14.8 | 10.5 |
| Net profit (YoY) | 228.9 | (28.0) | (84.0) | 349.9 | (18.6) | 35.0 | 8.0 | 10.2 |
| Core EPS (fully-diluted) (YoY) | 228.7 | (28.1) | (84.0) | 350.0 | (18.6) | 35.0 | 8.0 | 10.2 |
| Gross-profit margin | 49.8 | 46.3 | 29.2 | 40.3 | 37.7 | 40.7 | 39.5 | 39.7 |
| EBITDA margin | 36.1 | 30.9 | 9.3 | 22.5 | 19.4 | 22.4 | 21.5 | 21.3 |
| Operating-profit margin | 35.3 | 29.8 | 8.1 | 21.2 | 18.1 | 21.1 | 20.3 | 20.1 |
| Net profit margin | 28.7 | 25.4 | 4.0 | 19.5 | 16.2 | 19.5 | 17.6 | 17.4 |
| ROAE | 70.4 | 41.1 | 6.7 | 29.7 | 24.1 | 30.7 | 29.8 | 29.7 |
| ROAA | 43.5 | 25.3 | 4.4 | 19.4 | 16.4 | 21.1 | 20.6 | 20.9 |
| ROCE | 86.5 | 48.1 | 13.4 | 32.3 | 26.9 | 33.2 | 34.2 | 34.2 |
| ROIC | n.a | n.a | 28.6 | n.a | 69.5 | 92.1 | 94.2 | 97.2 |
| Net debt to equity | n.a. | n.a. | n.a. | n.a. | n.a. | n.a. | n.a. | n.a. |
| Effective tax rate | 19.2 | 19.0 | 57.4 | 15.8 | 16.3 | 16.8 | 16.6 | 16.5 |
| Accounts receivable (days) | 49.8 | 65.3 | 54.0 | 66.1 | 75.0 | 66.0 | 66.0 | 66.0 |
| Current ratio (x) | 2.8 | 3.3 | 3.1 | 3.2 | 3.7 | 3.3 | 3.8 | 3.7 |
| Net interest cover (x) | n.a. | n.a. | n.a. | n.a. | n.a. | n.a. | n.a. | n.a. |
| Net dividend payout | 80.3 | 80.6 | 80.5 | 436.0 | 84.8 | 85.6 | 70.3 | 74.1 |
| Free cash flow yield | 12.4 | 6.6 | 8.8 | 4.7 | 3.8 | 8.9 | 3.5 | 10.7 |
Source: FactSet, Daiwa forecasts
Company profile
Founded in 1997, Novatek is a fabless IC-design company. Its product range encompasses LCD-driver and control ICs, as well as video display, commercial and IM products.
Novatek Microelectronics (3034 TT): 6 August 2026
Daiwa
ESG analysis
ESG risks
| Risks | Management | Analyst comments | |
|---|---|---|---|
| G | Executive/board quality | 1 | Novatek's Board of Directors (BoD) has 9 members with a diverse background, including 3 members who are independent directors, representing 33% of total directors, higher than the regulatory requirement of at least 20%. Its Chairman and President are not the same person and most of its directors are not executive management. It has established the Audit Committee and Remuneration Committee, both of which are composed of independent directors. To strengthen the functionality of the Board, Novatek carries out the performance evaluation of its BoD every year by passing the "Guidelines for Director Performance Evaluation" in 2019, and the internal results of the evaluation were 'Excellent' in 2023. |
| G | Capital management | 1 | In the past 2018-2023 years, Novatek's dividend payout ratios were above 80%. As a fabless company, it does not need high capital expenditures for manufacturing sites. Thus, we see its dividend policy with high payout ratio as appropriate. |
| G | Related party & transaction | 3 | Novatek has related-party transactions with one of its directors, United Microelectronics Corporation (UMC) and its related parties. The transaction amount accounted for 42% and 39% of Novatek's total purchases in 2021 and 2022, respectively, implying Novatek is highly reliant on UMC as a supplier. Thus, Novatek may have limited bargaining power for transactions with UMC, which may increase the possibility of unfair transactions and thus result in corporate governance issues. |
| S | Supply chain management | 2 | Novatek has established a Responsible Business Alliance self-assessment questionnaire and supply chain risk assessment for its suppliers. To improve its supply chain management, it formulated the "Novatek Supplier Code of Conduct" and a total of 45 suppliers completed the signing, with a signing rate of 100% in 2022. |
| E | Water & wastewater management | 2 | As a fabless without manufacturing plants, Novatek does not produce much of wastewater compared to manufacturing companies, and thus has a relatively limited impact to the environment. It has established management procedures for wastewater with effective disposal measures. |
| E | Waste & hazardous materials management | 1 | As a fabless company, Novatek does not manufacture its product but leverages on its suppliers. The company has established a green product management system and requested its suppliers to comply with its "Novatek Hazardous Substances Management Rules". It conducts a regular review of operations to ensure the effectiveness of the management system. It continuously complies with RoHS/halogen-free and REACH requirements. |
| E | GHG emissions | 1 | The major source of Novatek's GHG emissions is externally purchased electricity, which accounted for 98% of its total emissions in 2022. Thus, electricity consumption reduction measures are essential for Novatek to reduce GHG emissions. The company achieved the annual energy-saving target of 1%. To reduce GHG emissions by increasing the percentage of renewable energy, it targets to complete its evaluation of its Plan for the Use of Renewable Energy, and start using renewable energy in 2022. In addition, the company aims to achieve net- zero emission in 2050. |
Note: Management score represents a company's ability to manage/benefit from certain ESG topics. The scores range from 1 to 3, with 1 being the strongest.
Update Date: 6 Feb 2026
Source: Daiwa, Company
Novatek Microelectronics (3034 TT): 6 August 2026
Daiwa