PDF 原檔:報告_Daiwa_統一超2912_20260729_original.pdf
圖片清單(已驗證 2026-07-31)
| 檔名 | size | 分類 | 親眼所見內容 |
|---|---|---|---|
Daiwa-2912 20260729_001.png |
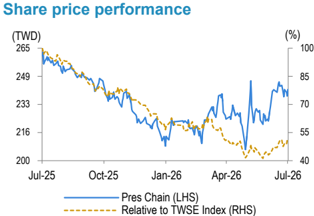
31KB | 真資料圖 | 統一超股價走勢圖(TWD,左軸,藍線「Pres Chain」)+相對 TWSE 指數走勢(%,右軸,橘虛線),Jul-25 至 Jul-26;標題「Share price performance」 |
原始內容
Taiwan
President Chain Store (2912 TT)
Target price:
TWD270.00 (from TWD250.00)
Share price (29 Jul):
TWD241.00 | Up/downside: +12.0%
2Q26 review: fundamentals on track
- 2Q26 EPS beat our estimate slightly; in line with Bloomberg consensus
- Ongoing share gains in Taiwan CVS segment with store expansion
- Reaffirming our Outperform (2) call; raising 12-month TP to TWD270
What's new: PCSC posted its 2Q26 results on 29 July after market hours. We reaffirm our Outperform (2) call as we believe PCSC's share gain potential in the Taiwan consumer market with its aggressive store addition strategy over 2026-28E should bear fruit in the mid to long term. PCSC is likely a better pick in the non-tech space to hedge against stock market volatility.
What's the impact: 2Q26 results review. PCSC's 2Q26 net profit of TWD3,174m (+2.7% QoQ and +4.3% YoY) beat our forecast by 4.5% but missed the Bloomberg consensus by 4.1%. Revenue of TWD92,176m (+4.1% QoQ and +5.5% YoY) was in line with our and consensus forecasts. The YoY expansion was mainly driven by fresh food, up 9-10% YoY (accounting for 26-27% of Taiwan 7-Eleven's revenue in 2Q26), and city café, up by 11-12% YoY (9-10% of Taiwan 7-Eleven's revenue in 2Q26). Its gross margin of 34.6% in 2Q26 slightly beat our forecast of 34.4% but missed the consensus estimate (34.9%). However, its operating profit of TWD3,845m (+1.9% QoQ and -0.8% YoY) missed our and consensus forecasts by 3.7-4.8% due to continued investments in store expansion and logistics. Overall, its 2Q26 EPS finished at TWD3.06, slightly higher than our and consensus estimates of TWD2.92 and TWD3.05, respectively.
Intact 2H26 outlook. PCSC's share in convenience store (CVS) by store count in Taiwan rose further to 52.3% in 1Q26 from 52.2% in 2025 and 51.8% in 2024 vs. Family Mart's 32.1% in 1Q26 and 32.2% in 2025. PCSC maintains its 2026 target of adding 150-200 Taiwan 7-Eleven stores (86 of net additions in 1H26) with per store daily (PSD) revenue growth of a low single digit percentage (0-1% in 1H26) with improving profitability. For Philippines 7-Eleven, PCSC aims to add 400-500 stores in 2026 vs. 159 net additions in 1H26. On Cosmed, PCSC will continue its aggressive store addition in 2026, targeting 50-100 new additions vs. 35 in 1H26 as the company sees demand in cosmetics and healthcare. We believe PCSC's aggressive store expansion strategy will continue to 2027. We keep our 2026-27E EPS almost unchanged and introduce our 2028 forecasts.
What we recommend: We reaffirm our Outperform (2) rating and raise our 12-month TP to TWD270 (from TWD250), still based on a 22x PER (vs. its past-3-year normalised trading PER of 18-27x) applied to our 1-year forward EPS (4Q26-3Q27E EPS). Its dividend yield of 4.1-4.9% over 202628E should support its current share price level. Key downside risks: higher-than-expected opex and competition.
How we differ: We are more positive on its share gain story in the Taiwan consumer space with margin expansion.
→
5
Daiwa
Outperform
Helen Chien
Helen Chien (886) 2 8758 6254
helen.chien@daiwacm-cathay.com.tw
Neil Teng, CFA (886) 2 8758 6256 neil.teng@daiwacm-cathay.com.tw
Forecast revisions (%)
| Year to 31 Dec | 26E | 27E | 28E |
|---|---|---|---|
| Revenue change | (0.3) | (2.2) | n.a. |
| Net profit change | 1.2 | (0.5) | n.a. |
| Core EPS (FD) change | 1.1 | (0.5) | n.a. |
Source: Daiwa forecasts
| 12-month range | 206.50-262.50 |
|---|---|
| Market cap (USDbn) | 7.73 |
| 3m avg daily turnover (USDm) | 35.02 |
| Shares outstanding (m) | 1,040 |
| Major shareholder | Uni-President Enterprises (45.4%) |
Financial summary (TWD)
| Year to 31 Dec | 26E | 27E | 28E |
|---|---|---|---|
| Revenue (m) | 369,575 | 386,753 | 404,581 |
| Operating profit (m) | 14,751 | 15,865 | 17,377 |
| Net profit (m) | 11,991 | 13,000 | 14,439 |
| Core EPS (fully-diluted) | 11.506 | 12.474 | 13.854 |
| EPS change (%) | 7.0 | 8.4 | 11.1 |
| Daiwa vs Cons. EPS (%) | (1.1) | 1.3 | 1.3 |
| PER (x) | 20.9 | 19.3 | 17.4 |
| Dividend yield (%) | 4.1 | 4.4 | 4.9 |
| DPS | 9.8 | 10.6 | 11.8 |
| PBR (x) | 5.1 | 4.6 | 4.1 |
| EV/EBITDA (x) | 7.8 | 7.7 | 6.8 |
| ROE (%) | 26.2 | 25.1 | 25.1 |
Source: FactSet, Daiwa forecasts
PCSC: P&L statement
| 2026E | 2026E | 2026E | 2026E | 2027E | 2026E | 2027E | 2028E | ||||
|---|---|---|---|---|---|---|---|---|---|---|---|
| (TWDm) | 1Q | 2QE | 3QE | 4QE | 1QE | 2QE | 3QE | 4QE | |||
| Net sales | 88,528 | 92,176 | 94,547 | 94,325 | 95,180 | 96,141 | 97,169 | 98,263 | 369,575 | 386,753 | 404,581 |
| COGS | -57,917 | -60,295 | -61,639 | -61,928 | -62,256 | -62,807 | -63,228 | -64,530 | -241,779 | -252,821 | -264,098 |
| Gross profit | 30,610 | 31,881 | 32,908 | 32,397 | 32,924 | 33,334 | 33,941 | 33,733 | 127,796 | 133,932 | 140,483 |
| Operating costs | -26,837 | -28,036 | -28,837 | -29,335 | -28,840 | -29,227 | -29,539 | -30,461 | -113,045 | -118,067 | -123,105 |
| Operating profit | 3,773 | 3,845 | 4,071 | 3,062 | 4,084 | 4,107 | 4,402 | 3,272 | 14,751 | 15,865 | 17,377 |
| Non-operating profit | 848 | 862 | 793 | 756 | 866 | 1,013 | 867 | 831 | 3,258 | 3,577 | 3,923 |
| Pre-tax profit | 4,621 | 4,708 | 4,864 | 3,817 | 4,951 | 5,120 | 5,269 | 4,102 | 18,010 | 19,442 | 21,300 |
| Tax / minority int. | -1,530 | -1,533 | -1,517 | -1,438 | -1,599 | -1,731 | -1,609 | -1,502 | -6,019 | -6,441 | -6,861 |
| Net profit | 3,091 | 3,174 | 3,347 | 2,379 | 3,352 | 3,389 | 3,660 | 2,600 | 11,991 | 13,000 | 14,439 |
| Basic EPS (TWD) | 2.97 | 3.05 | 3.22 | 2.29 | 3.22 | 3.26 | 3.52 | 2.50 | 11.53 | 12.51 | 13.89 |
| Operating Ratios | |||||||||||
| Gross margins | 34.6% | 34.6% | 34.8% | 34.3% | 34.6% | 34.7% | 34.9% | 34.3% | 34.6% | 34.6% | 34.7% |
| Operating margin | 4.3% | 4.2% | 4.3% | 3.2% | 4.3% | 4.3% | 4.5% | 3.3% | 4.0% | 4.1% | 4.3% |
| Pre-tax margin | 5.2% | 5.1% | 5.1% | 4.0% | 5.2% | 5.3% | 5.4% | 4.2% | 4.9% | 5.0% | 5.3% |
| Net margin | 3.5% | 3.4% | 3.5% | 2.5% | 3.5% | 3.5% | 3.8% | 2.6% | 3.2% | 3.4% | 3.6% |
| Year-on-Year% | |||||||||||
| Net revenue | 4.6% | 5.5% | 6.3% | 5.1% | 7.5% | 4.3% | 2.8% | 4.2% | 5.4% | 4.6% | 4.6% |
| Gross profit | 6.5% | 6.0% | 5.7% | 5.9% | 7.6% | 4.6% | 3.1% | 4.1% | 6.0% | 4.8% | 4.9% |
| Operating income | 4.2% | -0.8% | 7.5% | 15.6% | 8.2% | 6.8% | 8.1% | 6.8% | 5.9% | 7.5% | 9.5% |
| Pre-tax income | 6.7% | 2.2% | 11.4% | 4.8% | 7.1% | 8.7% | 8.3% | 7.5% | 6.3% | 8.0% | 9.6% |
| Net income | 6.7% | 4.3% | 12.9% | 3.0% | 8.4% | 6.7% | 9.4% | 9.3% | 7.0% | 8.4% | 11.1% |
| Qtr-on-Qtr% | |||||||||||
| Net revenue | -1.4% | 4.1% | 2.6% | -0.2% | 0.9% | 1.0% | 1.1% | 1.1% | |||
| Gross profit | 0.1% | 4.2% | 3.2% | -1.6% | 1.6% | 1.2% | 1.8% | -0.6% | |||
| Operating income | 42.5% | 1.9% | 5.9% | -24.8% | 33.4% | 0.6% | 7.2% | -25.7% | |||
| Pre-tax income | 26.9% | 1.9% | 3.3% | -21.5% | 29.7% | 3.4% | 2.9% | -22.1% | |||
| Net income | 33.9% | 2.7% | 5.4% | -28.9% | 40.9% | 1.1% | 8.0% | -29.0% |
Source: Company, Daiwa forecasts
PCSC: earnings forecasts revisions
| 2026E | 2026E | 2026E | 2027E | 2027E | 2027E | 2028E | 2028E | 2028E | |
|---|---|---|---|---|---|---|---|---|---|
| (TWDm) | Previous | New | Consensus | Previous | New | Consensus | Previous | New | Consensus |
| Revenue | 370,611 | 369,575 | 367,406 | 395,416 | 386,753 | 383,469 | n.a. | 404,581 | 401,594 |
| Diff (%) | -0.3% | 0.6% | -2.2% | 0.9% | n.a. | 0.7% | |||
| Gross Margin (%) | 34.5% | 34.6% | 34.6% | 34.5% | 34.6% | 34.8% | n.a. | 34.7% | 35.1% |
| Operating profit | 14,871 | 14,751 | 15,287 | 16,168 | 15,865 | 16,159 | n.a. | 17,377 | 16,914 |
| Operating Margin (%) | 4.0% | 4.0% | 4.2% | 4.1% | 4.1% | 4.2% | n.a. | 4.3% | 4.2% |
| Net profit | 11,854 | 11,991 | 12,103 | 13,065 | 13,000 | 12,739 | n.a. | 14,439 | 14,114 |
| Diluted EPS | 11.38 | 11.51 | 11.63 | 12.54 | 12.47 | 12.31 | n.a. | 13.85 | 13.68 |
| Diff (%) | 1.1% | -1.1% | -0.5% | 1.3% | n.a. | 1.3% |
Source: Company, Bloomberg, Daiwa forecasts
PCSC: 2Q26 results
| Actual | Actual | Actual | |||||
|---|---|---|---|---|---|---|---|
| TWDm | QoQ% | YoY% | Daiwa | Diff% | Consensus | Diff% | |
| Revenue | 92,176 | 4.1% | 5.5% | 91,392 | 0.9% | 91,635 | 0.6% |
| Gross profit | 31,881 | 4.2% | 6.0% | 31,411 | 1.5% | 31,944 | -0.2% |
| Gross margin (%) | 34.6% | 34.4% | 0.2pp | 34.9% | -0.3pp | ||
| Operating profit | 3,845 | 1.9% | -0.8% | 3,994 | -3.7% | 4,038 | -4.8% |
| Operating margin (%) | 4.2% | 4.4% | -0.2pp | 4.4% | -0.2pp | ||
| Pre-tax profit | 4,708 | 1.9% | 2.2% | 4,729 | -0.4% | 4,915 | -4.2% |
| Pre-tax margin (%) | 5.1% | 5.2% | -0.1pp | 5.4% | -0.3pp | ||
| Net profit | 3,174 | 2.7% | 4.3% | 3,036 | 4.5% | 3,309 | -4.1% |
| Basic EPS (TWD) | 3.06 | 2.8% | 4.5% | 2.92 | 4.7% | 3.05 | 0.3% |
Source: Company, Bloomberg, Daiwa forecasts
President Chain Store (2912 TT): 29 July 2026
Daiwa
Financial summary
Key assumptions
| Year to 31 Dec | 2021 | 2022 | 2023 | 2024 | 2025 | 2026E | 2027E | 2028E |
|---|---|---|---|---|---|---|---|---|
| Number of Taiwan 7-Eleven stores | 6,379 | 6,631 | 6,859 | 7,077 | 7,248 | 7,399 | 7,559 | 7,679 |
| SSSG in Taiwan 7-Eleven (%) | (5.9) | 3.8 | 4.2 | 3.2 | 1.6 | (1.2) | 5.2 | 8.2 |
| Consolidated operating margin (%) | 4.1 | 4.2 | 4.3 | 4.1 | 4.0 | 4.0 | 4.1 | 4.3 |
Profit and loss (TWDm)
| Year to 31 Dec | 2021 | 2022 | 2023 | 2024 | 2025 | 2026E | 2027E | 2028E |
|---|---|---|---|---|---|---|---|---|
| CVS | 168,010 | 182,872 | 197,664 | 210,705 | 220,046 | 222,332 | 238,972 | 263,504 |
| Retail | 76,161 | 87,177 | 96,773 | 104,993 | 108,201 | 115,402 | 116,523 | 116,523 |
| Other Revenue | 18,564 | 20,385 | 22,605 | 22,234 | 22,487 | 31,841 | 31,257 | 24,554 |
| Total Revenue | 262,735 | 290,434 | 317,042 | 337,932 | 350,735 | 369,575 | 386,753 | 404,581 |
| Other income | 0 | 0 | 0 | 0 | 0 | 0 | 0 | 0 |
| COGS | (174,612) | (192,580) | (208,870) | (222,505) | (230,193) | (241,779) | (252,821) | (264,098) |
| SG&A | (77,454) | (85,515) | (94,422) | (101,455) | (106,611) | (113,045) | (118,067) | (123,105) |
| Other op.expenses | 0 | 0 | 0 | 0 | 0 | 0 | 0 | 0 |
| Operating profit | 10,670 | 12,340 | 13,750 | 13,973 | 13,930 | 14,751 | 15,865 | 17,377 |
| Net-interest inc./(exp.) | (1,021) | (690) | 190 | 134 | (617) | (693) | (283) | 55 |
| Assoc/forex/extraord./others | 2,423 | 2,420 | 2,417 | 3,255 | 3,632 | 3,952 | 3,860 | 3,868 |
| Pre-tax profit | 12,072 | 14,070 | 16,357 | 17,362 | 16,945 | 18,010 | 19,442 | 21,300 |
| Tax | (2,053) | (3,000) | (3,696) | (3,620) | (3,611) | (3,971) | (4,394) | (4,814) |
| Min. int./pref. div./others | (1,157) | (1,788) | (2,047) | (2,203) | (2,124) | (2,047) | (2,047) | (2,047) |
| Net profit (reported) | 8,862 | 9,282 | 10,614 | 11,539 | 11,210 | 11,991 | 13,000 | 14,439 |
| Net profit (adjusted) | 8,862 | 9,282 | 10,614 | 11,539 | 11,210 | 11,991 | 13,000 | 14,439 |
| EPS (reported)(TWD) | 8.524 | 8.928 | 10.209 | 11.099 | 10.783 | 11.534 | 12.505 | 13.889 |
| EPS (adjusted)(TWD) | 8.524 | 8.928 | 10.209 | 11.099 | 10.783 | 11.534 | 12.505 | 13.889 |
| EPS (adjusted fully-diluted)(TWD) | 8.507 | 8.910 | 10.185 | 11.071 | 10.751 | 11.506 | 12.474 | 13.854 |
| DPS (TWD) | 9.000 | 9.000 | 9.000 | 9.000 | 9.000 | 9.804 | 10.629 | 11.805 |
| EBIT | 10,670 | 12,340 | 13,750 | 13,973 | 13,930 | 14,751 | 15,865 | 17,377 |
| EBITDA | 31,808 | 34,680 | 37,507 | 38,958 | 40,510 | 32,517 | 31,407 | 34,099 |
Cash flow (TWDm)
| Year to 31 Dec | 2021 | 2022 | 2023 | 2024 | 2025 | 2026E | 2027E | 2028E |
|---|---|---|---|---|---|---|---|---|
| Profit before tax | 12,072 | 14,070 | 16,357 | 17,362 | 16,945 | 18,010 | 19,442 | 21,300 |
| Depreciation and amortisation | 21,138 | 22,340 | 23,757 | 24,985 | 26,580 | 17,766 | 15,542 | 16,722 |
| Tax paid | (2,053) | (3,000) | (3,696) | (3,620) | (3,611) | (3,971) | (4,394) | (4,814) |
| Change in working capital | 6,508 | 2,388 | (2,155) | 7,753 | (1,658) | (2,562) | (226) | (269) |
| Other operational CF items | (1,681) | (1,561) | 8,126 | (9,719) | (1,747) | (1,042) | (2,434) | (2,442) |
| Cash flow from operations | 35,984 | 34,238 | 42,389 | 36,761 | 36,510 | 28,200 | 27,930 | 30,497 |
| Capex | (8,635) | (11,517) | (12,866) | (19,752) | (21,357) | (13,022) | (10,442) | (10,924) |
| Net (acquisitions)/disposals | 240 | (320) | (12,137) | 7,460 | 190 | 58 | 0 | 0 |
| Other investing CF items | (992) | (747) | (2,006) | (546) | (672) | (174) | 0 | 0 |
| Cash flow from investing | (9,388) | (12,584) | (27,009) | (12,838) | (21,839) | (13,138) | (10,442) | (10,924) |
| Change in debt | (2,761) | 3,454 | 9,791 | 3,618 | 12,093 | (11,362) | 0 | 0 |
| Net share issues/(repurchases) | 0 | 0 | 0 | 0 | 0 | 0 | 0 | 0 |
| Dividends paid | (10,654) | (10,706) | (10,590) | (12,066) | (10,672) | (9,357) | (9,876) | (9,876) |
| Other financing CF items | (13,128) | (13,729) | (14,139) | (14,884) | (15,777) | (4,002) | 0 | 0 |
| Cash flow from financing | (26,543) | (20,981) | (14,938) | (23,332) | (14,356) | (24,721) | (9,876) | (9,876) |
| Forex effect/others | (968) | 2,219 | (53) | 1,747 | (1,401) | 434 | 0 | 0 |
| Change in cash | (914) | 2,892 | 389 | 2,338 | (1,086) | (9,224) | 7,611 | 9,697 |
| Free cash flow | 27,349 | 22,721 | 29,523 | 17,009 | 15,153 | 15,179 | 17,487 | 19,573 |
Source: FactSet, Daiwa forecasts
President Chain Store (2912 TT): 29 July 2026
Daiwa
Financial summary continued …
Balance sheet (TWDm)
| Year to 31 Dec | 2021 | 2022 | 2023 | 2024 | 2025 | 2026E | 2027E | 2028E |
|---|---|---|---|---|---|---|---|---|
| Cash & short-term investment | 46,309 | 49,072 | 56,851 | 53,012 | 51,882 | 42,972 | 50,583 | 60,280 |
| Inventory | 18,440 | 21,670 | 23,427 | 23,632 | 26,709 | 26,474 | 27,586 | 28,917 |
| Accounts receivable | 9,148 | 9,283 | 10,270 | 11,157 | 11,132 | 12,522 | 13,044 | 13,669 |
| Other current assets | 5,515 | 5,063 | 4,324 | 4,794 | 4,825 | 5,298 | 5,298 | 5,298 |
| Total current assets | 79,412 | 85,087 | 94,873 | 92,595 | 94,547 | 87,265 | 96,511 | 108,163 |
| Fixed assets | 29,141 | 34,408 | 37,505 | 49,670 | 62,291 | 60,319 | 55,219 | 49,421 |
| Goodwill & intangibles | 9,814 | 9,665 | 9,508 | 9,197 | 9,250 | 9,142 | 9,142 | 9,142 |
| Other non-current assets | 96,137 | 104,050 | 115,466 | 118,320 | 126,543 | 130,421 | 130,808 | 131,202 |
| Total assets | 214,504 | 233,210 | 257,352 | 269,782 | 292,631 | 287,147 | 291,680 | 297,928 |
| Short-term debt | 5,630 | 9,570 | 13,502 | 9,254 | 20,701 | 16,043 | 16,043 | 16,043 |
| Accounts payable | 28,330 | 31,048 | 34,277 | 35,179 | 31,960 | 33,530 | 34,939 | 36,624 |
| Other current liabilities | 54,638 | 57,091 | 61,104 | 63,339 | 67,938 | 65,747 | 65,747 | 65,747 |
| Total current liabilities | 88,598 | 97,709 | 108,884 | 107,771 | 120,599 | 115,321 | 116,729 | 118,415 |
| Long-term debt | 963 | 493 | 6,352 | 14,730 | 15,165 | 19,468 | 19,468 | 19,468 |
| Other non-current liabilities | 82,151 | 89,360 | 94,270 | 95,261 | 103,941 | 94,000 | 94,000 | 94,000 |
| Total liabilities | 171,713 | 187,562 | 209,505 | 217,762 | 239,704 | 228,789 | 230,197 | 231,883 |
| Share capital | 10,396 | 10,396 | 10,396 | 10,396 | 10,396 | 10,396 | 10,396 | 10,396 |
| Reserves/R.E./others | 23,767 | 26,063 | 27,448 | 31,881 | 32,165 | 38,722 | 43,893 | 50,503 |
| Shareholders' equity | 34,163 | 36,459 | 37,845 | 42,278 | 42,561 | 49,118 | 54,289 | 60,899 |
| Minority interests | 8,628 | 9,189 | 10,003 | 9,743 | 10,365 | 9,241 | 7,193 | 5,146 |
| Total equity & liabilities | 214,504 | 233,210 | 257,352 | 269,782 | 292,631 | 287,147 | 291,680 | 297,928 |
| EV | 219,463 | 220,729 | 223,554 | 231,263 | 244,898 | 252,329 | 242,670 | 230,926 |
| Net debt/(cash) | (39,715) | (39,009) | (36,997) | (29,028) | (16,016) | (7,461) | (15,072) | (24,769) |
| BVPS (TWD) | 32.861 | 35.070 | 36.402 | 40.666 | 40.939 | 47.246 | 52.220 | 58.578 |
Key ratios (%)
| Year to 31 Dec | 2021 | 2022 | 2023 | 2024 | 2025 | 2026E | 2027E | 2028E |
|---|---|---|---|---|---|---|---|---|
| Sales (YoY) | 1.6 | 10.5 | 9.2 | 6.6 | 3.8 | 5.4 | 4.6 | 4.6 |
| EBITDA (YoY) | (1.3) | 9.0 | 8.2 | 3.9 | 4.0 | (19.7) | (3.4) | 8.6 |
| Operating profit (YoY) | (12.1) | 15.7 | 11.4 | 1.6 | (0.3) | 5.9 | 7.5 | 9.5 |
| Net profit (YoY) | (13.4) | 4.7 | 14.4 | 8.7 | (2.8) | 7.0 | 8.4 | 11.1 |
| Core EPS (fully-diluted) (YoY) | (13.4) | 4.7 | 14.3 | 8.7 | (2.9) | 7.0 | 8.4 | 11.1 |
| Gross-profit margin | 33.5 | 33.7 | 34.1 | 34.2 | 34.4 | 34.6 | 34.6 | 34.7 |
| EBITDA margin | 12.1 | 11.9 | 11.8 | 11.5 | 11.6 | 8.8 | 8.1 | 8.4 |
| Operating-profit margin | 4.1 | 4.2 | 4.3 | 4.1 | 4.0 | 4.0 | 4.1 | 4.3 |
| Net profit margin | 3.4 | 3.2 | 3.3 | 3.4 | 3.2 | 3.2 | 3.4 | 3.6 |
| ROAE | 25.3 | 26.3 | 28.6 | 28.8 | 26.4 | 26.2 | 25.1 | 25.1 |
| ROAA | 4.2 | 4.1 | 4.3 | 4.4 | 4.0 | 4.1 | 4.5 | 4.9 |
| ROCE | 20.6 | 23.5 | 22.3 | 19.4 | 16.9 | 16.2 | 16.6 | 17.5 |
| ROIC | n.a | n.a | n.a | 65.4 | 36.6 | 26.2 | 25.2 | 30.7 |
| Net debt to equity | n.a. | n.a. | n.a. | n.a. | n.a. | n.a. | n.a. | n.a. |
| Effective tax rate | 17.0 | 21.3 | 22.6 | 20.9 | 21.3 | 22.1 | 22.6 | 22.6 |
| Accounts receivable (days) | 12.0 | 11.6 | 11.3 | 11.6 | 11.6 | 11.7 | 12.1 | 12.0 |
| Current ratio (x) | 0.9 | 0.9 | 0.9 | 0.9 | 0.8 | 0.8 | 0.8 | 0.9 |
| Net interest cover (x) | 10.4 | 17.9 | n.a. | n.a. | 22.6 | 21.3 | 56.1 | n.a. |
| Net dividend payout | 105.6 | 100.8 | 88.2 | 81.1 | 83.5 | 85.0 | 85.0 | 85.0 |
| Free cash flow yield | 10.9 | 9.1 | 11.8 | 6.8 | 6.0 | 6.1 | 7.0 | 7.8 |
Source: FactSet, Daiwa forecasts
Company profile
President Chain Store is the operator of 7-Eleven Taiwan, the largest convenience-store chain in Taiwan, with over 7,200 stores at the end of 2025 and a dominant market share. In addition, the company has invested in Philippine 7-Eleven, Shanghai 7-Eleven, Taiwan Starbucks and Cosmed, among other investments in Greater China and overseas.
President Chain Store (2912 TT): 29 July 2026
Daiwa
ESG analysis
ESG risks
| Risks | Management | Analyst comments | |
|---|---|---|---|
| G | Executive/board quality | 2 | The CEO and Chairperson of PCSC are not the same individual. The company has scored an overall "AA" in MSCI ESG ratings since 2017, indicating its strong ESG performance during the past 8 years. Its corporate governance and corporate behaviour performance is at a moderate level compared with peers. |
| Capital management | 2 | PCSC's maintained its dividend payout ratio at 81-106% over 2015-25, which we consider as reasonable as it has a solid position in Taiwan's CVS market. However, we note that PCSC plans to adopt a relatively aggressive store expansion strategy. Thus, its payout ratio in the coming few years may depend on its expansion results. | |
| S | Related party & transaction Product quality & | 2 | Revenue from related-party transactions only accounts for 1% of PCSC's revenue in 2025, with no suspicious activity observed. |
| safety | 1 | PCSC's domestic OEM factories (total: 45) have received ISO 22000 certification. New suppliers are tested based on PCSC's quality control standards. Also, PCSC has established its own Material and Quality Assurance System to ensure the source of each material is trackable. We note that PSCS leads its peers on the MSCI ESG rating for product safety and quality. PCSC has established its own recycling platform to manage its waste and material, providing | |
| E | Waste & hazardous materials management | 1 | TWD3-120 discount coupons to the public as incentives to recycle. In addition to reducing straw production, PCSC has also introduced bio-based PLA materials and FSC-certified recycled cup holders and packages to reduce plastic use. |
Note: Management score represents a company's ability to manage/benefit from certain ESG topics. The scores range from 1 to 3, with 1 being the strongest.
Update Date: 29 Jul 2026
Source: Daiwa, Company
President Chain Store (2912 TT): 29 July 2026
Daiwa