PDF 原檔:報告_Daiwa_智原3035_20260728_original.pdf
圖片清單(已驗證 2026-07-29)
| 檔名 | size | 分類 | 親眼所見內容 |
|---|---|---|---|
報告_Daiwa_智原3035_20260728_003.png |
51KB | 真資料圖 | 股價(TWD)與歷史 P/E 倍數帶(10x–35x)疊圖,橫軸 2010年至2027年,來源標示「Company, TEJ, Daiwa forecasts」 |
<40KB未逐張 Read 者(001/002)預設為 logo/裝飾圖,未列入清單。
原始內容
Taiwan
Faraday Technology (3035 TT)
Target price:
TWD220.00 (from TWD195.00)
Share price (28 Jul): TWD185.50
|
Up/downside:
+18.6%
Turnaround confirmed
- 2Q26 results upbeat, yet 3Q26 guidance a mixed bag
- Near-term rebalancing no harm to structural turnaround
- Reaffirming Buy (1) rating with a higher 12M TP of TWD220
What's new: Faraday disclosed upbeat 2Q26 results but mixed 3Q26 guidance due to stronger-than-expected MCU sales , which will likely be followed by a rebalancing on some demand pull-in. We view this as just seasonal and see no harm to our positive stance on Faraday which has, as expected , enjoyed a turnaround in profitability. We leave our forecasts little changed, raise our 12M TP and reaffirm our Buy (1) call on the counter.
What's the impact: Results upbeat; guidance a mixed bag. Faraday released 2Q26 EPS of TWD0.76, beating our/consensus estimates by 49%/37% thanks to: 1) higher revenue that beat our/consensus estimates by 19%/17% on stronger mass-production (MP) due to better MCU sales from its 50% owned Artery Tech (6907 TT, not rated); 2) better core operation where operating profit finished 54%/110% above our/consensus estimates on better opex control, helping offset the lower gross margin (GM) as a result of a less favourable product mix due to higher MP sales; and 3) higher non-operating gains mainly on dividend income. Guided metrics for 3Q26 were mixed, with GM and opex roughly intact but revenue a miss due to demand rebalancing as MCU strength in 2Q26 was partly from customers' order pull-in on price hikes and supply-chain uncertainties.
Positive on MCU, negative on AP ramp. Our takeaways from today's call were mixed, positive on Artery but negative on an advanced packaging (AP) ramp. Focusing on 32-bit MCUs, Artery targets high-end applications such as robot, drone, smart industry and 3D printer, to capture a fastgrowing trend of physical AI where demand looks less price-sensitive vs. consumers amid the 'silicon inflation'. Despite seeing demand rebalancing in 3Q26, management expects Artery to double its revenue YoY this year. On the other hand, owing to prolonged development times for AI ASIC due to increased design complexity and a supply-chain bottleneck, which affect the timing of NRE recognition, Faraday expects its AP revenue ramp to be delayed into 2027. That said, it is positive on a cooperation with Intel for the A18 process, and with Intel/UMC for the 12nmFF process, which should help gain traction with customers on localised manufacturing in the US.
What we recommend: Given the mixed dynamics mentioned above, we leave our forecasts little changed but raise our 12M TP for Faraday to TWD220 (previous: TWD195), based on our fine-tuned 4-quarter PER target of 37x (previous: 38x). We reiterate our Buy (1) rating with key downside risk of any geopolitical overhang (war, FX, interest rate) weighing on end-demand and prolonging a non-AI recovery.
How we differ: Our 2026E EPS is 13% below the consensus as we believe the street has yet to factor in a lower GM on higher MP contribution.
Daiwa
5
3
→
2
1
Buy
Rick Hsu
Rick Hsu
(886) 2 8758 6261 rick.hsu@daiwacm-cathay.com.tw
Sharon Kao (886) 2 8758 6255 sharon.kao@daiwacm-cathay.com.tw
Forecast revisions (%)
| Year to 31 Dec | 26E | 27E | 28E |
|---|---|---|---|
| Revenue change | 2.1 | (0.2) | 1.2 |
| Net profit change | (0.1) | (0.2) | 0.7 |
| Core EPS (FD) change | (0.1) | (0.2) | 0.7 |
Source: Daiwa forecasts
Share price performance
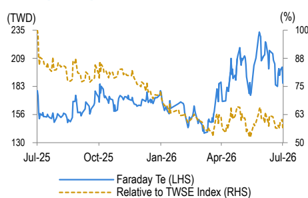
| 12-month range | 139.00-233.00 |
|---|---|
| Market cap (USDbn) | 1.50 |
| 3m avg daily turnover (USDm) | 76.11 |
| Shares outstanding (m) | 261 |
| Major shareholder | UMC (13.8%) |
Financial summary (TWD)
| Year to 31 Dec | 26E | 27E | 28E |
|---|---|---|---|
| Revenue (m) | 12,736 | 15,475 | 17,419 |
| Operating profit (m) | 1,137 | 2,284 | 2,812 |
| Net profit (m) | 889 | 1,759 | 2,172 |
| Core EPS (fully-diluted) | 3.412 | 6.749 | 8.336 |
| EPS change (%) | 21.5 | 97.8 | 23.5 |
| Daiwa vs Cons. EPS (%) | (12.9) | 1.7 | (7.5) |
| PER (x) | 54.4 | 27.5 | 22.3 |
| Dividend yield (%) | 1.0 | 1.3 | 2.4 |
| DPS | 1.8 | 2.5 | 4.5 |
| PBR (x) | 3.6 | 3.2 | 3.0 |
| EV/EBITDA (x) | 18.9 | 11.2 | 8.9 |
| ROE (%) | 6.7 | 12.4 | 14.0 |
Source: FactSet, Daiwa forecasts
Faraday: quarterly P&L estimates and forecasts
Daiwa
| TWDm | 1Q26 | 2Q26 | 3Q26E | 4Q26E | 1Q27E | 2Q27E | 3Q27E | 4Q27E | 2025 | 2026E | 2027E | 2028E |
|---|---|---|---|---|---|---|---|---|---|---|---|---|
| Revenue | 2,589 | 3,314 | 3,194 | 3,639 | 3,551 | 3,625 | 4,075 | 4,223 | 17,993 | 12,736 | 15,475 | 17,419 |
| COGS | -1,364 | -1,815 | -1,746 | -1,990 | -1,944 | -1,945 | -2,190 | -2,269 | -13,135 | -6,916 | -8,349 | -9,435 |
| Gross profit | 1,224 | 1,499 | 1,448 | 1,649 | 1,607 | 1,680 | 1,885 | 1,954 | 4,857 | 5,820 | 7,126 | 7,985 |
| Opex | 1,129 | 1,228 | 1,115 | 1,212 | 1,190 | 1,200 | 1,202 | 1,250 | 4,305 | 4,683 | 4,842 | 5,173 |
| Operating profit | 96 | 271 | 333 | 437 | 418 | 480 | 683 | 704 | 552 | 1,137 | 2,284 | 2,812 |
| Non-op gains (losses) | 83 | 111 | 21 | 21 | 22 | 24 | 26 | 26 | 449 | 236 | 98 | 123 |
| Pretax profit | 179 | 382 | 354 | 458 | 440 | 504 | 709 | 730 | 1,002 | 1,373 | 2,382 | 2,935 |
| Income taxes & MI | -75 | -184 | -99 | -126 | -97 | -111 | -156 | -161 | -270 | -485 | -524 | -763 |
| Net profit | 104 | 198 | 255 | 332 | 321 | 373 | 525 | 540 | 731 | 889 | 1,759 | 2,172 |
| EPS (TWD, fully diluted) | 0.40 | 0.76 | 0.98 | 1.27 | 1.23 | 1.43 | 2.01 | 2.07 | 2.81 | 3.41 | 6.75 | 8.34 |
| Revenue mix | ||||||||||||
| MP | 63% | 73% | 73% | 75% | 74% | 72% | 72% | 72% | 79% | 72% | 72% | 72% |
| NRE | 21% | 14% | 13% | 13% | 14% | 14% | 14% | 15% | 13% | 15% | 14% | 15% |
| IP | 16% | 13% | 14% | 12% | 12% | 14% | 13% | 13% | 8% | 14% | 13% | 13% |
| Margin | ||||||||||||
| Gross | 47.3% | 45.2% | 45.3% | 45.3% | 45.3% | 46.3% | 46.3% | 46.3% | 27.0% | 45.7% | 46.1% | 45.8% |
| Opex | 43.6% | 37.0% | 34.9% | 33.3% | 33.5% | 33.1% | 29.5% | 29.6% | 23.9% | 36.8% | 31.3% | 29.7% |
| Operating | 3.7% | 8.2% | 10.4% | 12.0% | 11.8% | 13.2% | 16.8% | 16.7% | 3.1% | 8.9% | 14.8% | 16.1% |
| Pretax | 6.9% | 11.5% | 11.1% | 12.6% | 12.4% | 13.9% | 17.4% | 17.3% | 5.6% | 10.8% | 15.4% | 16.8% |
| Net | 4.0% | 6.0% | 8.0% | 9.1% | 9.0% | 10.3% | 12.9% | 12.8% | 4.1% | 7.0% | 11.4% | 12.5% |
| Growth (QoQ) | ||||||||||||
| Revenue | -8% | 28% | -4% | 14% | -2% | 2% | 12% | 4% | ||||
| Gross profit | 3% | 22% | -3% | 14% | -3% | 5% | 12% | 4% | ||||
| Operating profit | 19% | 182% | 23% | 31% | -4% | 15% | 42% | 3% | ||||
| Net profit | -50% | 90% | 29% | 30% | -3% | 16% | 41% | 3% | ||||
| EPS (FD) | -50% | 90% | 29% | 30% | -3% | 16% | 41% | 3% | ||||
| Growth (YoY) | ||||||||||||
| Revenue | -65% | -27% | -1% | 30% | 37% | 9% | 28% | 16% | 63% | -29% | 22% | 13% |
| Gross profit | -19% | 37% | 35% | 39% | 31% | 12% | 30% | 18% | -4% | 20% | 22% | 12% |
| Operating profit | -74% | 324% | nm | 444% | 336% | 77% | 105% | 61% | -48% | 106% | 101% | 23% |
| Net profit | -70% | 666% | 68% | 60% | 208% | 89% | 106% | 63% | -30% | 22% | 98% | 24% |
| EPS (FD) | -70% | 666% | 68% | 60% | 208% | 89% | 106% | 63% | -31% | 22% | 98% | 24% |
Source: Company, Daiwa estimates and forecasts
Note: * MP = mass-production, which includes HBM consigned revenue in 1H25, thus deflating organic GM; NRE = non-recurrent engineering; IP = intellectual property
Faraday: 2Q26 results review and 3Q26 guidance check
| 2Q26 | 2Q26 | 2Q26 | Variance | Variance | Growth | Growth | |||
|---|---|---|---|---|---|---|---|---|---|
| TWDm | Actual | Daiwa | Consensus | Daiwa | Consensus | QoQ | YoY | Guidance | Daiwa (previous) |
| Revenue | 3,314 | 2,795 | 2,836 | 19% | 17% | 28% | -27% | down a single-digit %QoQ | up 2% QoQ (TWD3.4bn) |
| MP | 2,430 | 1,824 | na | 33% | na | 48% | -36% | ||
| NRE | 451 | 524 | na | -14% | na | -16% | 9% | ||
| IP | 433 | 448 | na | -3% | na | 5% | 50% | ||
| Gross profit | 1,499 | 1,322 | 1,276 | 13% | 17% | 22% | 37% | GM c.45% | GM = 46% |
| Opex | 1,228 | 1,146 | 1,147 | 7% | 7% | 9% | 20% | opex up single-digit %QoQ | opex up 3% QoQ |
| Operating profit | 271 | 176 | 129 | 54% | 110% | 183% | 325% | ||
| Pretax profit | 382 | 196 | 192 | 95% | 99% | 113% | 756% | ||
| Net profit | 198 | 133 | 145 | 49% | 37% | 90% | 666% | ||
| FD EPS (TWD) | 0.76 | 0.51 | 0.56 | 49% | 37% | 90% | 667% | ||
| Margin | |||||||||
| Gross | 45.2% | 47.3% | 45.0% | -2.0% | 0.2% | ||||
| Operating | 8.2% | 6.3% | 4.6% | 1.9% | 3.6% | ||||
| Net | 6.0% | 4.7% | 5.1% | 1.2% | 0.9% | ||||
| Revenue mix* | |||||||||
| IP | 13% | 16% | |||||||
| NRE | 14% | 19% | |||||||
| MP | 73% | 65% |
Source: Company, Daiwa estimates and forecasts
Note: * IP = intellectual property, NRE = non-recurrent engineering, MP = mass-production
Faraday: revenue mix by business
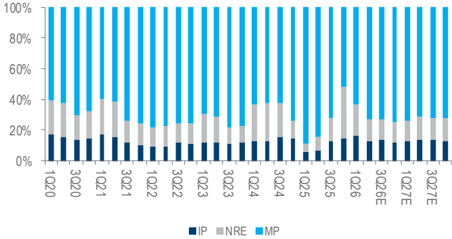
Source: Company, Daiwa estimates and forecasts
Note: * IP = intellectual property, NRE = non-recurrent engineering, MP = mass-production
Faraday Technology (3035 TT): 28 July 2026
Faraday: 4-quarter forward PER band
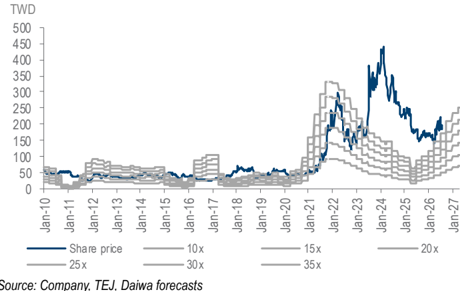
Source: Company, TEJ, Daiwa forecasts
Financial summary
Key assumptions
| Year to 31 Dec | 2021 | 2022 | 2023 | 2024 | 2025 | 2026E | 2027E | 2028E |
|---|---|---|---|---|---|---|---|---|
| IP revenue growth (%) | 26.5 | 26.4 | 4.5 | 11.3 | (2.8) | 14.5 | 17.6 | 11.3 |
| NRE revenue growth (%) | 32.4 | 22.1 | 0.2 | 30.4 | 1.7 | (17.8) | 17.9 | 18.1 |
| MP revenue growth (%) | 56.3 | 78.2 | (11.6) | (17.9) | 95.6 | (35.7) | 23 | 11.7 |
Profit and loss (TWDm)
| Year to 31 Dec | 2021 | 2022 | 2023 | 2024 | 2025 | 2026E | 2027E | 2028E |
|---|---|---|---|---|---|---|---|---|
| NRE | 1,410 | 1,721 | 1,725 | 2,250 | 2,289 | 1,881 | 2,217 | 2,618 |
| MP | 5,614 | 10,002 | 8,839 | 7,255 | 14,188 | 9,119 | 11,215 | 12,528 |
| Other Revenue | 1,062 | 1,342 | 1,402 | 1,560 | 1,516 | 1,736 | 2,042 | 2,274 |
| Total Revenue | 8,085 | 13,065 | 11,966 | 11,065 | 17,993 | 12,736 | 15,475 | 17,419 |
| Other income | 0 | 0 | 0 | 0 | 0 | 0 | 0 | 0 |
| COGS | (3,995) | (6,690) | (6,658) | (6,013) | (13,135) | (6,916) | (8,349) | (9,435) |
| SG&A | (726) | (1,018) | (983) | (989) | (1,114) | (1,253) | (1,222) | (1,257) |
| Other op.expenses | (1,962) | (2,436) | (2,369) | (2,991) | (3,191) | (3,430) | (3,620) | (3,916) |
| Operating profit | 1,402 | 2,921 | 1,956 | 1,071 | 552 | 1,137 | 2,284 | 2,812 |
| Net-interest inc./(exp.) | 7 | 27 | 52 | 100 | 83 | 83 | 98 | 123 |
| Assoc/forex/extraord./others | 93 | 109 | 63 | 173 | 366 | 153 | 0 | 0 |
| Pre-tax profit | 1,502 | 3,057 | 2,070 | 1,343 | 1,002 | 1,373 | 2,382 | 2,935 |
| Tax | (212) | (547) | (509) | (271) | (229) | (312) | (524) | (646) |
| Min. int./pref. div./others | (134) | (56) | 28 | (30) | (42) | (173) | (100) | (117) |
| Net profit (reported) | 1,156 | 2,455 | 1,589 | 1,041 | 731 | 889 | 1,759 | 2,172 |
| Net profit (adjusted) | 1,156 | 2,455 | 1,589 | 1,041 | 731 | 889 | 1,759 | 2,172 |
| EPS (reported)(TWD) | 4.651 | 9.876 | 6.395 | 4.042 | 2.807 | 3.412 | 6.749 | 8.336 |
| EPS (adjusted)(TWD) | 4.651 | 9.876 | 6.395 | 4.042 | 2.807 | 3.412 | 6.749 | 8.336 |
| EPS (adjusted fully-diluted)(TWD) | 4.651 | 9.791 | 6.379 | 3.995 | 2.807 | 3.412 | 6.749 | 8.336 |
| DPS (TWD) | 1.000 | 3.300 | 5.000 | 4.341 | 3.000 | 1.800 | 2.500 | 4.500 |
| EBIT | 1,402 | 2,921 | 1,956 | 1,071 | 552 | 1,137 | 2,284 | 2,812 |
| EBITDA | 1,807 | 3,394 | 2,457 | 1,880 | 1,481 | 2,214 | 3,537 | 4,227 |
Cash flow (TWDm)
| Year to 31 Dec | 2021 | 2022 | 2023 | 2024 | 2025 | 2026E | 2027E | 2028E |
|---|---|---|---|---|---|---|---|---|
| Profit before tax | 1,502 | 3,057 | 2,070 | 1,343 | 1,002 | 1,373 | 2,382 | 2,935 |
| Depreciation and amortisation | 405 | 473 | 502 | 810 | 929 | 1,077 | 1,252 | 1,415 |
| Tax paid | (212) | (547) | (509) | (271) | (229) | (312) | (524) | (646) |
| Change in working capital | (256) | (2,368) | 1,487 | 1,331 | (1,123) | (748) | (61) | (137) |
| Other operational CF items | 1,067 | 584 | (543) | (312) | 351 | (0) | (0) | (0) |
| Cash flow from operations | 2,506 | 1,200 | 3,007 | 2,901 | 930 | 1,391 | 3,050 | 3,568 |
| Capex | (41) | (86) | (49) | (148) | (162) | (127) | (155) | (174) |
| Net (acquisitions)/disposals | (842) | 1,082 | (670) | 0 | 0 | 0 | 0 | 0 |
| Other investing CF items | 295 | (1,373) | 16 | (2,414) | (938) | 0 | 0 | 0 |
| Cash flow from investing | (588) | (377) | (704) | (2,562) | (1,100) | (127) | (155) | (174) |
| Change in debt | 0 | 127 | (30) | (70) | 0 | (46) | (37) | (29) |
| Net share issues/(repurchases) | 0 | 0 | 0 | 3,720 | 0 | 0 | 0 | 0 |
| Dividends paid | (249) | (820) | (1,243) | (1,118) | (782) | (469) | (651) | (1,172) |
| Other financing CF items | 49 | (89) | (148) | (354) | (50) | (564) | (46) | (37) |
| Cash flow from financing | (200) | (782) | (1,421) | 2,178 | (832) | (1,078) | (734) | (1,238) |
| Forex effect/others | (3) | 69 | (40) | 80 | (28) | 0 | 0 | 0 |
| Change in cash | 1,715 | 110 | 842 | 2,596 | (1,030) | 185 | 2,161 | 2,156 |
| Free cash flow | 2,465 | 1,114 | 2,958 | 2,752 | 768 | 1,263 | 2,895 | 3,394 |
Source: FactSet, Daiwa forecasts
Faraday Technology (3035 TT): 28 July 2026
Daiwa
Financial summary continued …
Balance sheet (TWDm)
| Year to 31 Dec | 2021 | 2022 | 2023 | 2024 | 2025 | 2026E | 2027E | 2028E |
|---|---|---|---|---|---|---|---|---|
| Cash & short-term investment | 4,823 | 4,899 | 5,741 | 8,337 | 7,293 | 7,478 | 9,639 | 11,795 |
| Inventory | 1,321 | 3,017 | 1,187 | 1,074 | 955 | 1,319 | 1,426 | 1,676 |
| Accounts receivable | 939 | 1,354 | 1,559 | 1,054 | 1,726 | 1,275 | 2,117 | 1,701 |
| Other current assets | 310 | 485 | 386 | 560 | 1,227 | 1,227 | 1,227 | 700 |
| Total current assets | 7,392 | 9,754 | 8,873 | 11,024 | 11,201 | 11,299 | 14,409 | 15,872 |
| Fixed assets | 518 | 514 | 553 | 582 | 617 | 582 | 549 | 724 |
| Goodwill & intangibles | 505 | 615 | 683 | 2,115 | 1,761 | 1,115 | 363 | 80 |
| Other non-current assets | 3,621 | 2,629 | 3,309 | 4,609 | 5,354 | 5,354 | 5,354 | 5,354 |
| Total assets | 12,037 | 13,513 | 13,418 | 18,330 | 18,932 | 18,350 | 20,676 | 22,030 |
| Short-term debt | 0 | 127 | 95 | 448 | 589 | 71 | 62 | 54 |
| Accounts payable | 1,372 | 1,129 | 999 | 1,675 | 1,649 | 814 | 1,702 | 1,400 |
| Other current liabilities | 2,134 | 2,899 | 2,142 | 1,750 | 2,447 | 2,447 | 2,447 | 2,447 |
| Total current liabilities | 3,506 | 4,156 | 3,236 | 3,872 | 4,685 | 3,331 | 4,210 | 3,901 |
| Long-term debt | 0 | 0 | 0 | 416 | 228 | 183 | 146 | 117 |
| Other non-current liabilities | 376 | 388 | 328 | 569 | 491 | 600 | 700 | 1,000 |
| Total liabilities | 3,881 | 4,544 | 3,564 | 4,857 | 5,403 | 4,114 | 5,056 | 5,018 |
| Share capital | 2,486 | 2,486 | 2,486 | 2,606 | 2,606 | 2,606 | 2,606 | 2,606 |
| Reserves/R.E./others | 5,354 | 6,114 | 7,048 | 10,469 | 10,451 | 10,985 | 12,269 | 13,545 |
| Shareholders' equity | 7,840 | 8,599 | 9,533 | 13,075 | 13,056 | 13,591 | 14,874 | 16,150 |
| Minority interests | 315 | 369 | 321 | 399 | 472 | 645 | 745 | 862 |
| Total equity & liabilities | 12,037 | 13,513 | 13,418 | 18,330 | 18,932 | 18,350 | 20,676 | 22,030 |
| EV | 43,825 | 43,930 | 43,007 | 41,257 | 42,328 | 41,752 | 39,645 | 37,570 |
| Net debt/(cash) | (4,823) | (4,772) | (5,646) | (7,473) | (6,476) | (7,225) | (9,432) | (11,624) |
| BVPS (TWD) | 31.543 | 34.597 | 38.356 | 50.743 | 50.111 | 52.162 | 57.089 | 61.984 |
Key ratios (%)
| Year to 31 Dec | 2021 | 2022 | 2023 | 2024 | 2025 | 2026E | 2027E | 2028E |
|---|---|---|---|---|---|---|---|---|
| Sales (YoY) | 47.1 | 61.6 | (8.4) | (7.5) | 62.6 | (29.2) | 21.5 | 12.6 |
| EBITDA (YoY) | 210.0 | 87.8 | (27.6) | (23.5) | (21.2) | 49.5 | 59.7 | 19.5 |
| Operating profit (YoY) | 840.3 | 108.4 | (33.1) | (45.3) | (48.4) | 105.9 | 100.9 | 23.1 |
| Net profit (YoY) | 330.6 | 112.3 | (35.2) | (34.5) | (29.8) | 21.5 | 97.8 | 23.5 |
| Core EPS (fully-diluted) (YoY) | 332.1 | 110.5 | (34.8) | (37.4) | (29.7) | 21.5 | 97.8 | 23.5 |
| Gross-profit margin | 50.6 | 48.8 | 44.4 | 45.7 | 27.0 | 45.7 | 46.1 | 45.8 |
| EBITDA margin | 22.4 | 26.0 | 20.5 | 17.0 | 8.2 | 17.4 | 22.9 | 24.3 |
| Operating-profit margin | 17.3 | 22.4 | 16.3 | 9.7 | 3.1 | 8.9 | 14.8 | 16.1 |
| Net profit margin | 14.3 | 18.8 | 13.3 | 9.4 | 4.1 | 7.0 | 11.4 | 12.5 |
| ROAE | 16.4 | 29.9 | 17.5 | 9.2 | 5.6 | 6.7 | 12.4 | 14.0 |
| ROAA | 11.4 | 19.2 | 11.8 | 6.6 | 3.9 | 4.8 | 9.0 | 10.2 |
| ROCE | 19.3 | 33.9 | 20.5 | 8.8 | 3.9 | 7.9 | 15.1 | 17.0 |
| ROIC | 37.3 | 63.7 | 35.1 | 16.7 | 6.5 | 12.5 | 27.0 | 37.9 |
| Net debt to equity | net cash | net cash | net cash | net cash | net cash | net cash | net cash | net cash |
| Effective tax rate | 14.1 | 17.9 | 24.6 | 20.2 | 22.8 | 22.7 | 22.0 | 22.0 |
| Accounts receivable (days) | 36.8 | 32.0 | 44.4 | 43.1 | 28.2 | 43.0 | 40.0 | 40.0 |
| Current ratio (x) | 2.1 | 2.3 | 2.7 | 2.8 | 2.4 | 3.4 | 3.4 | 4.1 |
| Net interest cover (x) | n.a. | n.a. | n.a. | n.a. | n.a. | n.a. | n.a. | n.a. |
| Net dividend payout | 92.6 | 71.0 | 50.6 | 69.7 | 75.1 | 64.1 | 73.3 | 66.7 |
| Free cash flow yield | 5.1 | 2.3 | 6.1 | 5.7 | 1.6 | 2.6 | 6.0 | 7.0 |
Source: FactSet, Daiwa forecasts
Company profile
Founded in 1993, Faraday is a hybrid design service provider offering IP and ASIC design services to fabless, foundry and system houses. It has R&D and marketing locations in the US, Japan, China, India, and Vietnam.
Faraday Technology (3035 TT): 28 July 2026
Daiwa
ESG analysis
ESG risks
| Risks | Management | Analyst comments |
|---|---|---|
| Executive/board quality | 2 | Faraday's Board of Directors (BoD) consists of 10 members, including 4 independent directors, representing 40% of the board-significantly above the regulatory minimum of 20%. Three of the 10 directors are female, reflecting progress toward gender diversity at the board level. The roles of Chairman and President are separated, supporting stronger governance checks and balances. However, most non independent directors concurrently serve as executive managers, which may elevate concerns regarding board independence and management oversight from an ESG governance perspective. |
| Capital management | 1 | Over the past 10 years, Faraday has kept its dividend payout ratio at above 70% most of the time, in spite of an up or down cycle. As an IC design service company without capex for manufacturing fabs, Faraday's high dividend payout is appropriate, in our view. |
| Related party & transaction | 1 | UMC, which is Faraday's largest shareholder, is Faraday's major foundry for its turnkey business. For IC design service companies, a close relationship with foundries is essential since their design should build on a foundry's process node and their turnkey businesses also require a foundry's capacity support. UMC's support offers Faraday a competitive advantage, in our view. Faraday has developed many standard cell and I/O libraries for UMC, covering logic and mixed-signal specialty processes across 0.5μ to 22nm. |
| Supply chain management | 1 | Faraday has set several evaluation standards for its existing and new suppliers and it requires all suppliers to get ISO9001 and ISO14001 certifications for quality and environmental management. In 2024, 100% of its wafer, packaging and testing providers had ISO9001 and ISO14001 certifications. In addition, Faraday also has on-site audits (quality system and process quality audit, CSR evaluation and environment management system) for its suppliers with a mid- to-long term target of conducting annual onsite audits for 100% of its suppliers. |
| Water & wastewater management | 1 | As an IC design service company, Faraday outsources its manufacturing and thus has no own production sites. As such, Faraday's water use is primarily for general operations, not for production. Faraday continues to conduct several water reduction measures to manage water usage. |
| Waste & hazardous materials management | 1 | Faraday has established a green supply chain in accordance with the EU Directive on the Restriction of the Use of Certain Hazardous Substances in Electrical and Electronic Equipment (RoHS) and with the EU Chemicals Policy (REACH). Faraday has a mid-to-long term target of carefully evaluating and selecting raw materials with low hazard levels to comply with the Hazardous Substance-Free Product Standard. All of its packaging materials are 100% lead-free and halogen-free. |
| GHG emissions | 1 | With Faraday's energy saving measures, it reduced the GHG emissions intensity gradually. As an IC design service company without onsite production, Faraday's GHG emissions are much lower than other semiconductor manufacturing companies. Faraday's low power design also helps reduce GHG emissions. In 2019, Faraday completed the development of its ultra-low power consumption 22nm IP solution. |
Note: Management score represents a company's ability to manage/benefit from certain ESG topics. The scores range from 1 to 3, with 1 being the strongest.
Update Date: 10 Feb 2026
Source: Daiwa, Company
Faraday Technology (3035 TT): 28 July 2026
Daiwa