PDF 原檔:報告_Daiwa_景碩3189_20260731_original.pdf
圖片清單(已驗證 2026-08-03)
| 檔名 | size | 分類 | 親眼所見內容 |
|---|---|---|---|
260731_daiwa_Kinsus_003.png |
35KB | 未 Read(<40KB,預設 logo) | — |
260731_daiwa_Kinsus_004.png |
25KB | 未 Read(<40KB,預設 logo) | — |
260731_daiwa_Kinsus_001.png |
22KB | 未 Read(<40KB,預設 logo) | — |
260731_daiwa_Kinsus_002.png |
20KB | 未 Read(<40KB,預設 logo) | — |
本份報告 4 張抽圖皆低於 40KB 候選門檻(Daiwa 股價表現圖/PER 走勢圖/營收拆解圖等版面圖表通常較小),依規則未逐張 Read,預設非真資料圖,不供 lib/ 嵌入。
原始內容
Taiwan
Kinsus Interconnect Technology (3189 TT)
Target price:
TWD1,068.00 (from TWD588.00)
Share price (31 Jul): TWD635.00 | Up/downside: +68.2%
2Q26 results: gross margin expansion story continues
- Riding on a favourable pricing environment for both ABF/BT substrate
- New upsides from CPU market share and optical transceivers
- Reaffirming Buy (1) call; raising 12M TP to TWD1,068 (from TWD588)
What's new: We provide our latest view on Kinsus after its 2Q26 results.
What's the impact: 2Q26 results beat on profitability. Kinsus released its results on 31 July, with net income of TWD1.31bn (EPS: TWD2.80), beating our estimate and consensus by 25%/11%, respectively. 2Q26 sales (TWD12.5bn; up 13% QoQ; 31% YoY) were on track with the street's expectations; we attribute the QoQ growth to price hikes and rising utilisation rates, given solid AI server demand. Hence, gross margin rose by 4.9pp QoQ to 26.1%, mainly on price hikes, while operating margin further rose by 5.4pp QoQ to 13.4% on gross margin expansion and better opex control.
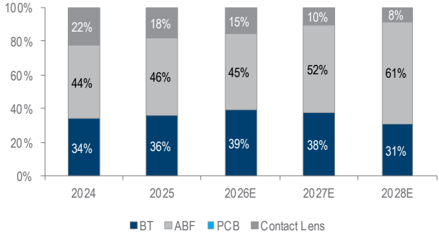
Business outlook. We hold a positive view on the substrate industry given the enlarging body-size trend and the slower capacity expansion plan, which should lead to a positive pricing trend ahead. Currently, we expect a c.10% price hike per quarter for both ABF/BT substrate from 2H26 to 2027. The higher-than-expected price hike would be key reasons why we lift GM by 1.9/5.0/7.4pp in 2026/27/28E, respectively. In terms of near-term outlook, we expect revenue to grow another 10% in both 3Q26 and 4Q26, due mainly to price hikes, while the new capacity will gradually ramp up from 2027. Based on our current understanding, Kinsus will have 40/50/65/80m ABF unit capacity in 2026-29E, respectively, with YoY growth of c.20%/30%/23%, while Kinsus targets to invest c.TWD14/16/18bn in 2026-28 to boost capacity. From 2028, 4-5 key end customers would purchase additional equipment for Kinsus to produce ABF substrates as Kinsus believes the equipment subsidy method will be better than longterm agreement (LTA) to maintain profitability. In terms of key products, we believe Kinsus controls c.50% market share in Nvidia's CPU product, which may increase to 100%, given the capacity constraints in the industry. Also, due to supply shortage of mSAP HDI, optical transceiver makers would also consider adopting BT substrate to facilitate DSP and optics chipsets. As of now, optical transceivers only account for 1-2% of its revenue but is likely to grow 10x and account for c.5% of revenue in 2027, we estimate.
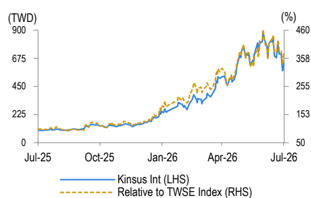
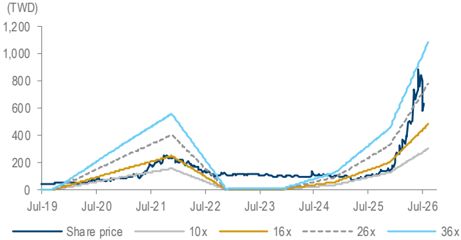
What we recommend: We lift our 2026-28E earnings by 14-66% YoY to reflect higher-than-expected price hikes for substrates. We reaffirm our Buy (1) rating and raise our 12M TP to TWD1,068, based on a target PER of 36x (prior: 32x; high end of its past-3-year trading range of 10-36x), applied to 1-year-forward EPS, to reflect the improving pricing environment and c.134% earnings CAGR in 2026-2028E. Key downside risks: weaker-thanexpected demand for memory/PCs/gaming GPUs/AI servers.
How we differ: Our 2026-28E EPS are 4-31% above the Bloomberg consensus, likely due to our more bullish view on price hikes.
31 July 2026
5
Daiwa
3
2
1
→
Buy
Sheng Cheng (886) 2 8758 6253 sheng.cheng@daiwacm-cathay.com.tw
Allan Wang (886) 2 8758 6249 allan.wang@daiwacm-cathay.com.tw
Forecast revisions (%)
| Year to 31 Dec | 26E | 27E | 28E |
|---|---|---|---|
| Revenue change | (4.8) | 7.6 | 19.3 |
| Net profit change | 16.9 | 49.1 | 70.6 |
| Core EPS (FD) change | 13.6 | 44.9 | 65.8 |
Source: Daiwa forecasts
Share price performance
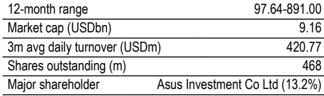
| 12-month range | 97.64-891.00 |
|---|---|
| Market cap (USDbn) | 9.16 |
| 3m avg daily turnover (USDm) | 420.77 |
| Shares outstanding (m) | 468 |
| Major shareholder | Asus Investment Co Ltd (13.2%) |
Financial summary (TWD)
| Year to 31 Dec | 26E | 27E | 28E |
|---|---|---|---|
| Revenue (m) | 53,385 | 88,484 | 122,920 |
| Operating profit (m) | 7,578 | 20,449 | 38,330 |
| Net profit (m) | 5,855 | 17,344 | 33,395 |
| Core EPS (fully-diluted) | 12.498 | 37.023 | 71.287 |
| EPS change (%) | 256.5 | 196.2 | 92.5 |
| Daiwa vs Cons. EPS (%) | 3.8 | 31.4 | 27.5 |
| PER (x) | 50.8 | 17.2 | 8.9 |
| Dividend yield (%) | 0.6 | 0.7 | 0.7 |
| DPS | 3.5 | 4.5 | 4.5 |
| PBR (x) | 7.3 | 5.4 | 3.6 |
| EV/EBITDA (x) | 18.0 | 9.0 | 4.7 |
| ROE (%) | 12.1 | 27.1 | 37.6 |
Source: FactSet, Daiwa forecasts
Kinsus: revenue and earnings forecast revisions
| 2026E | 2026E | 2026E | 2027E | 2027E | 2027E | 2028E | 2028E | 2028E | |
|---|---|---|---|---|---|---|---|---|---|
| (TWDm) | Previous | New | Consensus | Previous | New | Consensus | Previous | New | Consensus |
| Revenue | 56,055 | 53,385 | 54,064 | 82,270 | 88,484 | 79,330 | 103,073 | 122,920 | 121,719 |
| Diff (%) | -4.8% | -1.3% | 7.6% | 11.5% | 19.3% | 1.0% | |||
| Gross Margin (%) | 25.0% | 27.0% | 26.4% | 30.6% | 35.6% | 32.0% | 35.8% | 43.2% | 36.9% |
| Operating profit | 6,663 | 7,578 | 7,555 | 14,122 | 20,449 | 16,510 | 22,999 | 38,330 | 30,846 |
| Op Margin (%) | 11.9% | 14.2% | 14.0% | 17.2% | 23.1% | 20.8% | 22.3% | 31.2% | 25.3% |
| Net profit | 5,010 | 5,855 | 5,641 | 11,635 | 17,344 | 13,203 | 19,579 | 33,395 | 26,182 |
| EPS | 11.00 | 12.50 | 12.04 | 25.55 | 37.02 | 28.18 | 43.00 | 71.29 | 55.89 |
| Diff (%) | 13.6% | 3.8% | 44.9% | 31.4% | 65.8% | 27.5% |
Source: Bloomberg, Daiwa forecasts
Kinsus: quarterly and annual P&L statement
| 2026E | 2026E | 2026E | 2026E | 2027E | 2027E | 2027E | 2027E | 2025 | 2026E | 2027E | 2028E | |
|---|---|---|---|---|---|---|---|---|---|---|---|---|
| (TWDm) | 1Q | 2Q | 3QE | 4QE | 1QE | 2QE | 3QE | 4QE | ||||
| Net revenue | 11,105 | 12,496 | 14,137 | 15,646 | 17,624 | 20,789 | 24,135 | 25,936 | 39,351 | 53,385 | 88,484 | 122,920 |
| COGS | (8,755) | (9,235) | (10,059) | (10,907) | (11,852) | (13,562) | (15,436) | (16,107) | (31,037) | (38,956) | (56,957) | (69,840) |
| Gross profit | 2,349 | 3,261 | 4,079 | 4,739 | 5,772 | 7,226 | 8,700 | 9,829 | 8,314 | 14,428 | 31,527 | 53,080 |
| Operating expenses | 1,459 | 1,582 | 1,838 | 1,971 | 2,221 | 2,599 | 3,017 | 3,242 | 5,645 | 6,850 | 11,078 | 14,750 |
| Operating profit | 891 | 1,679 | 2,241 | 2,768 | 3,552 | 4,628 | 5,683 | 6,587 | 2,670 | 7,578 | 20,449 | 38,330 |
| Non-operating profit | 74 | 106 | 87 | 89 | 92 | 84 | 89 | 92 | 417 | 355 | 357 | 356 |
| Pre-tax profit | 964 | 1,784 | 2,328 | 2,857 | 3,644 | 4,712 | 5,772 | 6,679 | 3,087 | 7,933 | 20,806 | 38,686 |
| Income taxes | (89) | (101) | (233) | (286) | (364) | (471) | (577) | (668) | (370) | (708) | (2,081) | (3,869) |
| Net profit | 549 | 1,311 | 1,784 | 2,211 | 2,965 | 3,904 | 4,848 | 5,627 | 1,596 | 5,855 | 17,344 | 33,395 |
| Net EPS (TWD) | 1.17 | 2.80 | 3.81 | 4.72 | 6.33 | 8.33 | 10.35 | 12.01 | 3.5 | 12.5 | 37.0 | 71.3 |
| Operating Ratios | ||||||||||||
| Gross margin | 21.2% | 26.1% | 28.9% | 30.3% | 32.8% | 34.8% | 36.0% | 37.9% | 21.1% | 27.0% | 35.6% | 43.2% |
| Operating margin | 8.0% | 13.4% | 15.9% | 17.7% | 20.2% | 22.3% | 23.5% | 25.4% | 6.8% | 14.2% | 23.1% | 31.2% |
| Pre-tax margin | 8.7% | 14.3% | 16.5% | 18.3% | 20.7% | 22.7% | 23.9% | 25.8% | 7.8% | 14.9% | 23.5% | 31.5% |
| Net margin | 4.9% | 10.5% | 12.6% | 14.1% | 16.8% | 18.8% | 20.1% | 21.7% | 4.1% | 11.0% | 19.6% | 27.2% |
| YoY (%) | ||||||||||||
| Net revenue | 29% | 31% | 37% | 45% | 59% | 66% | 71% | 66% | 29% | 36% | 66% | 39% |
| Gross profit | 21% | 62% | 108% | 98% | 146% | 122% | 113% | 107% | -4% | 74% | 119% | 68% |
| Operating profit | 78% | 171% | 257% | 201% | 299% | 176% | 154% | 138% | 144% | 184% | 170% | 87% |
| Pre-tax profit | 38% | 188% | 227% | 171% | 278% | 164% | 148% | 134% | 93% | 157% | 162% | 86% |
| Net profit | 99% | 288% | 426% | 244% | 440% | 198% | 172% | 154% | 3164% | 267% | 196% | 93% |
| QoQ (%) | ||||||||||||
| Net revenue | 3% | 13% | 13% | 11% | 13% | 18% | 16% | 7% | ||||
| Gross profit | -2% | 39% | 25% | 16% | 22% | 25% | 20% | 13% | ||||
| Operating profit | -3% | 88% | 33% | 24% | 28% | 30% | 23% | 16% | ||||
| Pre-tax profit | -9% | 85% | 30% | 23% | 28% | 29% | 22% | 16% | ||||
| Net profit | -14% | 139% | 36% | 24% | 34% | 32% | 24% | 16% |
Source: Company, Daiwa forecasts
Kinsus: 2Q26 results vs. Daiwa and Bloomberg estimates
| (TWDm) | Actual | QoQ% | YoY% | Daiwa | Diff% | Consensus | Diff% |
|---|---|---|---|---|---|---|---|
| Revenue | 12,496 | 13% | 31% | 13,083 | -4% | 12,529 | 0% |
| Gross profit | 3,261 | 39% | 62% | 3,123 | 4% | 3,221 | 1% |
| Gross margin (%) | 26.1% | 23.9% | 25.7% | ||||
| Operating profit | 1,679 | 88% | 171% | 1,404 | 20% | 1,623 | 3% |
| Operating margin (%) | 13.4% | 10.7% | 13.0% | ||||
| Pre-tax profit | 1,784 | 85% | 188% | 1,488 | 20% | 1,691 | 6% |
| Net profit | 1,311 | 139% | 288% | 1,048 | 25% | 1,183 | 11% |
| EPS (TWD) | 2.80 | 139% | 288% | 2.30 | 25% | 2.52 | 11% |
Source: Company data, Daiwa forecasts, Bloomberg
Kinsus: 1-year forward PER bands
Source: TEJ, Daiwa forecasts
Kinsus Interconnect Technology (3189 TT): 31 July 2026
Kinsus: revenue breakdown by product
Source: Company, Daiwa forecasts
Daiwa
Financial summary
Key assumptions
| Year to 31 Dec | 2021 | 2022 | 2023 | 2024 | 2025 | 2026E | 2027E | 2028E |
|---|---|---|---|---|---|---|---|---|
| Global PC shipment (mn) | 361 | 301 | 260 | 263 | 287 | 244 | 244 | 244 |
| Regular server shipmnet (mn) | 14 | 15 | 12 | 14 | 16 | 18 | 22 | 26 |
| Global smartphone shipment (mn) | 1,655 | 1,437 | 1,380 | 1,437 | 1,429 | 1,249 | 1,255 | 1,300 |
Profit and loss (TWDm)
| Year to 31 Dec | 2021 | 2022 | 2023 | 2024 | 2025 | 2026E | 2027E | 2028E |
|---|---|---|---|---|---|---|---|---|
| ABF | 10,191 | 16,526 | 11,978 | 13,319 | 17,998 | 24,103 | 46,191 | 74,811 |
| BT | 17,565 | 18,796 | 8,065 | 10,398 | 14,314 | 21,010 | 33,194 | 38,101 |
| Other Revenue | 5,580 | 6,336 | 6,790 | 6,817 | 7,039 | 8,272 | 9,098 | 10,008 |
| Total Revenue | 33,336 | 41,658 | 26,832 | 30,535 | 39,351 | 53,385 | 88,484 | 122,920 |
| Other income | 0 | 0 | 0 | 0 | 0 | 0 | 0 | 0 |
| COGS | (22,583) | (25,771) | (20,075) | (21,867) | (31,037) | (38,956) | (56,957) | (69,840) |
| SG&A | (2,879) | (3,532) | (3,301) | (5,010) | (3,433) | (4,218) | (6,963) | (9,108) |
| Other op.expenses | (2,413) | (2,484) | (2,397) | (2,612) | (2,212) | (2,632) | (4,115) | (5,642) |
| Operating profit | 5,456 | 9,851 | 1,042 | 1,095 | 2,670 | 7,578 | 20,449 | 38,330 |
| Net-interest inc./(exp.) | (68) | (172) | (332) | (394) | (391) | (394) | (391) | (393) |
| Assoc/forex/extraord./others | 253 | 607 | 716 | 902 | 809 | 749 | 748 | 749 |
| Pre-tax profit | 5,641 | 10,287 | 1,426 | 1,603 | 3,087 | 7,933 | 20,806 | 38,686 |
| Tax | (672) | (2,158) | (256) | (272) | (370) | (708) | (2,081) | (3,869) |
| Min. int./pref. div./others | (633) | (957) | (1,123) | (1,282) | (1,121) | (1,370) | (1,381) | (1,422) |
| Net profit (reported) | 4,336 | 7,172 | 48 | 49 | 1,596 | 5,855 | 17,344 | 33,395 |
| Net profit (adjusted) | 4,336 | 7,172 | 48 | 49 | 1,596 | 5,855 | 17,344 | 33,395 |
| EPS (reported)(TWD) | 9.622 | 15.901 | 0.105 | 0.108 | 3.505 | 12.498 | 37.023 | 71.287 |
| EPS (adjusted)(TWD) | 9.622 | 15.901 | 0.105 | 0.108 | 3.505 | 12.498 | 37.023 | 71.287 |
| EPS (adjusted fully-diluted)(TWD) | 9.622 | 15.901 | 0.105 | 0.108 | 3.505 | 12.498 | 37.023 | 71.287 |
| DPS (TWD) | 4.500 | 6.476 | 1.000 | 1.000 | 1.500 | 3.500 | 4.500 | 4.500 |
| EBIT | 5,456 | 9,851 | 1,042 | 1,095 | 2,670 | 7,578 | 20,449 | 38,330 |
| EBITDA | 9,833 | 14,958 | 6,394 | 7,228 | 9,914 | 15,646 | 29,324 | 48,092 |
Cash flow (TWDm)
| Year to 31 Dec | 2021 | 2022 | 2023 | 2024 | 2025 | 2026E | 2027E | 2028E |
|---|---|---|---|---|---|---|---|---|
| Profit before tax | 5,641 | 10,287 | 1,426 | 1,603 | 3,087 | 7,933 | 20,806 | 38,686 |
| Depreciation and amortisation | 4,377 | 5,107 | 5,351 | 6,133 | 7,244 | 8,068 | 8,875 | 9,762 |
| Tax paid | (672) | (2,158) | (256) | (272) | (370) | (708) | (2,081) | (3,869) |
| Change in working capital | (1,347) | (176) | 1,528 | (906) | (1,959) | (2,075) | (3,148) | (3,551) |
| Other operational CF items | 2,575 | 2,901 | (1,793) | 1,147 | 91 | (829) | 0 | (0) |
| Cash flow from operations | 10,574 | 15,961 | 6,256 | 7,705 | 8,093 | 12,389 | 24,452 | 41,028 |
| Capex | (13,384) | (17,094) | (10,136) | (10,408) | (6,117) | (5,436) | (3,805) | (2,664) |
| Net (acquisitions)/disposals | 0 | 0 | 0 | 0 | 0 | 0 | 0 | 0 |
| Other investing CF items | 489 | 559 | (2,351) | 1,301 | (1,752) | (4,115) | (104) | (175) |
| Cash flow from investing | (12,895) | (16,535) | (12,486) | (9,107) | (7,869) | (9,551) | (3,909) | (2,839) |
| Change in debt | 6,544 | 1,903 | 6,043 | 1,624 | (1,333) | (8,836) | (529) | (222) |
| Net share issues/(repurchases) | 0 | 0 | 0 | 0 | 0 | 0 | 0 | 0 |
| Dividends paid | (451) | (2,443) | (3,438) | (454) | (457) | (288) | (1,640) | (2,108) |
| Other financing CF items | (94) | 2,411 | 2,730 | (173) | (1,481) | 7,728 | 0 | 0 |
| Cash flow from financing | 6,000 | 1,870 | 5,335 | 996 | (3,270) | (1,397) | (2,169) | (2,330) |
| Forex effect/others | (12) | 56 | (88) | 71 | (39) | 41 | 33 | 28 |
| Change in cash | 3,667 | 1,352 | (983) | (335) | (3,084) | 1,483 | 18,407 | 35,888 |
| Free cash flow | (2,809) | (1,133) | (3,880) | (2,703) | 1,976 | 6,953 | 20,647 | 38,365 |
Source: FactSet, Daiwa forecasts
Kinsus Interconnect Technology (3189 TT): 31 July 2026
Daiwa
Financial summary continued …
Balance sheet (TWDm)
| Year to 31 Dec | 2021 | 2022 | 2023 | 2024 | 2025 | 2026E | 2027E | 2028E |
|---|---|---|---|---|---|---|---|---|
| Cash & short-term investment | 15,968 | 17,923 | 21,013 | 16,676 | 16,336 | 22,267 | 40,674 | 76,563 |
| Inventory | 3,466 | 3,481 | 2,612 | 2,981 | 4,828 | 6,675 | 9,858 | 11,306 |
| Accounts receivable | 5,679 | 5,050 | 4,299 | 5,284 | 6,804 | 9,630 | 15,962 | 20,963 |
| Other current assets | 1,312 | 1,647 | 1,445 | 4,735 | 970 | 1,076 | 1,076 | 1,076 |
| Total current assets | 26,424 | 28,100 | 29,369 | 29,677 | 28,938 | 39,648 | 67,570 | 109,907 |
| Fixed assets | 31,586 | 44,101 | 48,209 | 49,658 | 50,897 | 48,154 | 43,084 | 35,985 |
| Goodwill & intangibles | 0 | 0 | 0 | 0 | 0 | 0 | 0 | 0 |
| Other non-current assets | 376 | 432 | 489 | 100 | 138 | 312 | 417 | 592 |
| Total assets | 58,386 | 72,633 | 78,067 | 79,435 | 79,973 | 88,115 | 111,071 | 146,484 |
| Short-term debt | 1,100 | 377 | 1,409 | 2,452 | 3,053 | 979 | 450 | 346 |
| Accounts payable | 10,150 | 10,798 | 8,457 | 7,521 | 10,030 | 13,356 | 19,723 | 22,620 |
| Other current liabilities | 2,733 | 4,199 | 4,393 | 7,018 | 7,023 | 5,816 | 5,816 | 5,816 |
| Total current liabilities | 13,983 | 15,374 | 14,259 | 16,990 | 20,106 | 20,151 | 25,989 | 28,783 |
| Long-term debt | 9,387 | 10,770 | 15,280 | 13,779 | 11,197 | 5,735 | 5,735 | 5,617 |
| Other non-current liabilities | 2,027 | 7,674 | 9,369 | 8,788 | 7,297 | 6,805 | 6,805 | 6,805 |
| Total liabilities | 25,397 | 33,818 | 38,908 | 39,557 | 38,600 | 32,691 | 38,529 | 41,205 |
| Share capital | 4,508 | 4,528 | 4,544 | 4,566 | 4,568 | 5,269 | 5,269 | 5,269 |
| Reserves/R.E./others | 28,481 | 34,288 | 34,615 | 35,312 | 36,805 | 50,154 | 67,272 | 100,010 |
| Shareholders' equity | 32,989 | 38,816 | 39,159 | 39,878 | 41,373 | 55,423 | 72,542 | 105,279 |
| Minority interests | 0 | 0 | 0 | 0 | 0 | 0 | 0 | 0 |
| Total equity & liabilities | 58,386 | 72,633 | 78,067 | 79,435 | 79,973 | 88,115 | 111,071 | 146,484 |
| EV | 291,995 | 290,700 | 293,151 | 297,031 | 295,391 | 281,923 | 262,986 | 226,876 |
| Net debt/(cash) | (5,481) | (6,776) | (4,325) | (445) | (2,085) | (15,553) | (34,490) | (70,600) |
| BVPS (TWD) | 64.478 | 75.804 | 69.748 | 69.314 | 71.656 | 87.418 | 117.285 | 176.717 |
Key ratios (%)
| Year to 31 Dec | 2021 | 2022 | 2023 | 2024 | 2025 | 2026E | 2027E | 2028E |
|---|---|---|---|---|---|---|---|---|
| Sales (YoY) | 23.0 | 25.0 | (35.6) | 13.8 | 28.9 | 35.7 | 65.7 | 38.9 |
| EBITDA (YoY) | 70.8 | 52.1 | (57.3) | 13.1 | 37.1 | 57.8 | 87.4 | 64.0 |
| Operating profit (YoY) | 307.0 | 80.6 | (89.4) | 5.1 | 143.7 | 183.8 | 169.8 | 87.4 |
| Net profit (YoY) | 700.2 | 65.4 | (99.3) | 2.9 | 3,164.4 | 266.9 | 196.2 | 92.5 |
| Core EPS (fully-diluted) (YoY) | 698.1 | 65.3 | (99.3) | 2.5 | 3,153.4 | 256.5 | 196.2 | 92.5 |
| Gross-profit margin | 32.3 | 38.1 | 25.2 | 28.4 | 21.1 | 27.0 | 35.6 | 43.2 |
| EBITDA margin | 29.5 | 35.9 | 23.8 | 23.7 | 25.2 | 29.3 | 33.1 | 39.1 |
| Operating-profit margin | 16.4 | 23.6 | 3.9 | 3.6 | 6.8 | 14.2 | 23.1 | 31.2 |
| Net profit margin | 13.0 | 17.2 | 0.2 | 0.2 | 4.1 | 11.0 | 19.6 | 27.2 |
| ROAE | 13.9 | 20.0 | 0.1 | 0.1 | 3.9 | 12.1 | 27.1 | 37.6 |
| ROAA | 8.6 | 10.9 | 0.1 | 0.1 | 2.0 | 7.0 | 17.4 | 25.9 |
| ROCE | 14.0 | 21.1 | 2.0 | 2.0 | 4.8 | 12.9 | 29.0 | 40.4 |
| ROIC | 19.9 | 26.1 | 2.6 | 2.4 | 6.0 | 17.4 | 47.2 | 94.9 |
| Net debt to equity | net cash | net cash | 2.5 | 4.6 | 4.8 | net cash | net cash | net cash |
| Effective tax rate | 11.9 | 21.0 | 17.9 | 17.0 | 12.0 | 8.9 | 10.0 | 10.0 |
| Accounts receivable (days) | 55.2 | 47.0 | 63.6 | 57.3 | 56.1 | 56.2 | 52.8 | 54.8 |
| Current ratio (x) | 1.9 | 1.8 | 2.1 | 1.7 | 1.4 | 2.0 | 2.6 | 3.8 |
| Net interest cover (x) | 84.0 | 61.0 | 5.3 | 5.1 | 8.9 | 21.2 | 54.2 | 99.6 |
| Net dividend payout | 52.6 | 41.9 | 909.2 | 909.2 | 42.7 | 28.0 | 12.2 | 6.3 |
| Free cash flow yield | n.a. | n.a. | n.a. | n.a. | 0.7 | 2.3 | 6.9 | 12.9 |
Source: FactSet, Daiwa forecasts
Company profile
Kinsus was founded in 2000 as a subsidiary of Asustek. The company mainly focus on niche ball grid array (BGA) substrates to avoid price competition among mainstream products like graphics card and chipsets, and it has become top-3 flip chip manufacturer in global. Besides, its manufacturing sites are based in Taiwan and China.
Kinsus Interconnect Technology (3189 TT): 31 July 2026
Daiwa
ESG analysis
ESG risks
| Risks | Management | Analyst comments |
|---|---|---|
| Executive/board quality | 2 | Kinsus's leadership team comprises experienced professionals dedicated to steering the company towards sustainable growth. This diverse board composition ensures a comprehensive range of expertise and perspectives, contributing to Kinsus's strategic decision-making and corporate governamce. |
| G | Capital management 2 | Kinsus maintains a robust financial framework, ensuring the availability of resources necessary for operational efficiency and strategic investments. The company's financial health is regularly disclosed through annual reports, providing transparency to stakeholders. |
| Supply chain | Related party & transaction 1 | The company adheres to stringent corporate governance policies to manage related party transactions, ensuring transparency and compliance with regulatory standards. The company discloses such transactions in its financial reports, maintaining accountability and stakeholder trust. For instance, the company's annual general meeting documents provide details on related party transactions, ensuring transparency and accountability. |
| S | management 1 | Kinsus is committed to sustainable supply chain practices, emphasizing environmental, social, and governance considerations. The company has established comprehensive ESG policies, including commitments to labor standards, environmental health and safety, ethics, and conflict- free minerals. These policies guide the company's interactions with suppliers and partners, promoting sustainability throughout the supply chain. |
| E | Data security 3 | The company recognizes the importance of information security in its operations. As part of its corporate governance framework, Kinsus is likely to implement standard data protection practices to safeguard sensitive information and ensure compliance with relevant regulations. Stakeholders are encouraged to consult the company's official communications or contact the company directly for detailed information on data security policies. |
Note: Management score represents a company's ability to manage/benefit from certain ESG topics. The scores range from 1 to 3, with 1 being the strongest.
Update Date: 31 Jan 2026
Source: Daiwa, Company
Kinsus Interconnect Technology (3189 TT): 31 July 2026
Daiwa