PDF 原檔:報告_Daiwa_川湖2059_20260806_original.pdf
圖片清單(已驗證 2026-08-07)
| 檔名 | size | 分類 | 親眼所見內容 |
|---|---|---|---|
報告_Daiwa_川湖2059_20260806_001.png |
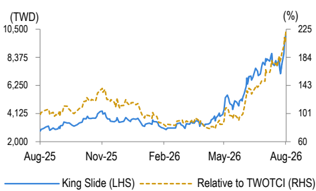
25KB | 真資料圖 | 雙折線圖,橫軸 Aug-25 至 Aug-26;藍線 King Slide 股價(左軸 2,000-10,500 TWD),橙虛線為相對 TWOTCI 表現(右軸 60-225%);2026 年中起兩線同步大幅走揚 |
報告_Daiwa_川湖2059_20260806_002.png |
21KB | 真資料圖 | 資料表格截圖:12-month range 2,855.00-10,100.00;Market cap USDbn 29.80;3m avg daily turnover USDm 135.53;Shares outstanding (m) 95;Major shareholder Ming Wei Global Co., Ltd. (6.7%) |
報告_Daiwa_川湖2059_20260806_003.png |
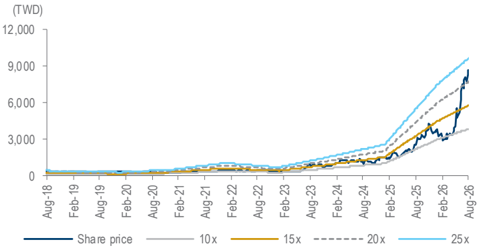
36KB | 真資料圖 | 折線圖「King Slide: 1-year forward PER bands」,橫軸 Aug-18 至 Aug-26,縱軸 TWD 0-12,000;深藍線為實際股價,另有 10x/15x/20x/25x 四條本益比帶(灰/金/虛線/淺藍),2026 年股價突破所有本益比帶上緣 |
報告_Daiwa_川湖2059_20260806_004.png |
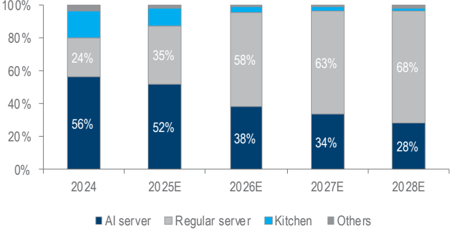
24KB | 真資料圖 | 堆疊柱狀圖「King Slide: revenue breakdown」,橫軸 2024/2025E/2026E/2027E/2028E;深藍 AI server(56%→52%→38%→34%→28%)、灰 Regular server(24%→35%→58%→63%→68%)、藍 Kitchen、灰黑 Others;顯示一般伺服器占比逐年超越 AI 伺服器 |
原始內容
Taiwan
King Slide Works (2059 TT)
Target price:
TWD15,000.00 (from TWD5,888.00)
Share price (6 Aug):
TWD10,100.00
|
Up/downside:
+48.5%
2Q26 results: strong beat and an improving outlook
- Share gains in regular servers were the key growth driver in 2Q26
- Increasing ASP trend is key to gross margin expansion
- Reaffirming our Buy (1) rating; lifting 12M TP to TWD15,000
What's new: We provide updates after 2Q26 results released on 6 August.
What's the impact: 2Q26 results beat on revenue and gross margin. King Slide's 2Q26 earnings came in at TWD7.1bn (EPS: TWD74.4), 72% and 45% above our and street expectations, respectively, driven by the higher-than-expected revenue and gross margin. Revenue was TWD10.8bn (up 99% QoQ and 156% YoY), beating expectations by 2351% on increasing market share in the regular server segment and higherthan-expected ASPs per rail kit due to spec upgrades. The gross margin increased by 9.7pp QoQ on an improved ASP trend. The operating margin improved 15.0pp to 82.1% on the gross margin increase and opex control. Lastly, net profit was slightly impacted by the FX loss and higher tax rate.
Business outlook. After a strong beat in 2Q26, we believe King Slide is proving its dominance in the server market, even though we believe hyperscalers and key AI OEMs will likely introduce new suppliers in the rail kit market. We expect King Slide to still control a c.75% market share in Nvidia's supply chain and other ASIC-based AI servers, although we expect its share in Nvidia to decline from c.100% to c.75% from 2027. However, we lift our assumption for King Slide's market share for regular servers from c.60% to c.80%, especially from one particular CSP client, from 2Q26. We also lift the regular server rail kit ASP from USD30-40 to USD60-70, given the new CPU platform launch and an improving product mix, which raises our gross margin assumptions to 85-90% from 70% for 2026-28E. Given the upward revisions to ASP and market share assumptions in the regular server market, we lift our earnings forecasts by 73-149%. We see some new AI server and relevant racks as key growth drivers, and include c.10,000 CPU racks for Nvidia and c.8,000 Helios racks for AMD in our 2027 forecasts. We also believe that within the current trend, we will see switch rack, power rack and BBU rack volumes gradually picking up, but quantifying the volumes is difficult so we have not factored them into our model; therefore, these items (i.e. switch rack, power rack, BBU rack) would offer upside to our current forecasts.
What we recommend: We raise our 2026-27E EPS by 73-149% to factor in the 2Q26 results. We raise our 12M TP to TWD15,000, based on a PER of 36x (prior: 30x; higher than its past-3-year range of 9-23x) on our 4quarter forward EPS forecast, to reflect a higher earnings trajectory. Thus, we reaffirm our Buy (1) rating. Key downside risk: weaker-than-expected AI server demand.
How we differ: Our 2026-28E EPS are 47-65% above the Bloomberg consensus as we are more positive on its revenue and profitability.
5
Daiwa
3
→
2
1
Buy
Sheng Cheng
(886) 2 8758 6253
sheng.cheng@daiwacm-cathay.com.tw
Allan Wang
(886) 2 8758 6249 allan.wang@daiwacm-cathay.com.tw
Forecast revisions (%)
| Year to 31 Dec | 26E | 27E | 28E |
|---|---|---|---|
| Revenue change | 55.4 | 86.1 | 107.4 |
| Net profit change | 73.1 | 118.9 | 149.3 |
| Core EPS (FD) change | 73.1 | 118.9 | 149.3 |
Source: Daiwa forecasts
Share price performance
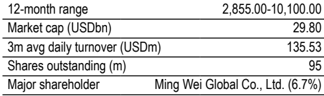
| 12-month range | 2,855.00-10,100.00 |
|---|---|
| Market cap (USDbn) | 29.80 |
| 3m avg daily turnover (USDm) | 135.53 |
| Shares outstanding (m) | 95 |
| Major shareholder | Ming Wei Global Co., Ltd. (6.7%) |
Financial summary (TWD)
| Year to 31 Dec | 26E | 27E | 28E |
|---|---|---|---|
| Revenue (m) | 42,873 | 62,370 | 79,189 |
| Operating profit (m) | 34,463 | 51,755 | 65,974 |
| Net profit (m) | 28,452 | 42,096 | 53,480 |
| Core EPS (fully-diluted) | 298.566 | 441.735 | 561.190 |
| EPS change (%) | 189.2 | 48.0 | 27.0 |
| Daiwa vs Cons. EPS (%) | 46.7 | 65.0 | 47.2 |
| PER (x) | 33.8 | 22.9 | 18.0 |
| Dividend yield (%) | 0.5 | 0.6 | 0.7 |
| DPS | 51.0 | 60.0 | 66.0 |
| PBR (x) | 18.6 | 10.9 | 7.1 |
| EV/EBITDA (x) | 26.3 | 16.9 | 12.6 |
| ROE (%) | 71.4 | 60.3 | 47.9 |
Source: FactSet, Daiwa forecasts
King Slide Works (2059 TT): 6 August 2026
King Slide: Daiwa revenue and earnings forecasts revisions vs. consensus
| 2026E | 2026E | 2026E | 2027E | 2027E | 2027E | 2028E | 2028E | 2028E | |
|---|---|---|---|---|---|---|---|---|---|
| (TWDm) | Previous | New | Consensus | Previous | New | Consensus | Previous | New | Consensus |
| Revenue | 27,589 | 42,873 | 33,604 | 33,514 | 62,370 | 44,861 | 38,185 | 79,189 | 62,715 |
| Diff (%) | 55.4% | 27.6% | 86.1% | 39.0% | 107.4% | 26.3% | |||
| Gross Margin (%) | 76.1% | 86.2% | 77.5% | 75.1% | 87.6% | 77.3% | 75.1% | 87.7% | 76.4% |
| Operating profit | 18,855 | 34,463 | 23,105 | 22,841 | 51,755 | 31,242 | 26,018 | 65,974 | 43,325 |
| Op Margin (%) | 68.3% | 80.4% | 68.8% | 68.2% | 83.0% | 69.6% | 68.1% | 83.3% | 69.1% |
| Net profit | 16,442 | 28,452 | 19,391 | 19,227 | 42,096 | 25,518 | 21,453 | 53,480 | 36,332 |
| EPS (TWD) | 172.53 | 298.57 | 203.48 | 201.76 | 441.73 | 267.77 | 225.11 | 561.19 | 381.25 |
| Diff (%) | 73.1% | 46.7% | 118.9% | 65.0% | 149.3% | 47.2% |
Source: Bloomberg, Daiwa forecasts
King Slide: quarterly and annual P&L statement
| 2026E | 2026E | 2026E | 2026E | 2027E | 2027E | 2027E | 2027E | 2025 | 2026E | 2027E | 2028E | |
|---|---|---|---|---|---|---|---|---|---|---|---|---|
| (TWDm) | 1Q | 2Q | 3QE | 4QE | 1QE | 2QE | 3QE | 4QE | ||||
| Net revenue | 5,450 | 10,830 | 12,991 | 13,602 | 13,899 | 14,673 | 16,563 | 17,236 | 17,501 | 42,873 | 62,370 | 79,189 |
| COGS | -1,213 | -1,362 | -1,571 | -1,773 | -1,739 | -1,772 | -2,050 | -2,143 | -4,192 | -5,919 | -7,704 | -9,777 |
| Gross profit | 4,237 | 9,468 | 11,420 | 11,829 | 12,160 | 12,901 | 14,512 | 15,093 | 13,309 | 36,953 | 54,666 | 69,412 |
| Operating expenses | -582 | -578 | -650 | -680 | -667 | -697 | -754 | -793 | -1,220 | -2,490 | -2,911 | -3,438 |
| Operating profit | 3,654 | 8,890 | 10,770 | 11,149 | 11,492 | 12,204 | 13,759 | 14,300 | 12,089 | 34,463 | 51,755 | 65,974 |
| Non-operating profit | 697 | 229 | 212 | 215 | 214 | 213 | 215 | 216 | 335 | 1,353 | 858 | 868 |
| Pre-tax profit | 4,352 | 9,118 | 10,982 | 11,364 | 11,707 | 12,418 | 13,974 | 14,516 | 12,423 | 35,816 | 52,614 | 66,842 |
| Income taxes | -866 | -2,030 | -2,195 | -2,272 | -2,340 | -2,482 | -2,793 | -2,902 | -2,586 | -7,363 | -10,518 | -13,362 |
| Net profit | 3,486 | 7,088 | 8,787 | 9,092 | 9,367 | 9,935 | 11,180 | 11,614 | 9,837 | 28,452 | 42,096 | 53,480 |
| Net EPS (TWD) | 36.58 | 74.38 | 92.20 | 95.41 | 98.29 | 104.26 | 117.32 | 121.87 | 103.23 | 298.57 | 441.73 | 561.19 |
| Operating Ratios | ||||||||||||
| Gross margin | 77.7% | 87.4% | 87.9% | 87.0% | 87.5% | 87.9% | 87.6% | 87.6% | 76.0% | 86.2% | 87.6% | 87.7% |
| Operating margin | 67.1% | 82.1% | 82.9% | 82.0% | 82.7% | 83.2% | 83.1% | 83.0% | 69.1% | 80.4% | 83.0% | 83.3% |
| Pre-tax margin | 79.9% | 84.2% | 84.5% | 83.5% | 84.2% | 84.6% | 84.4% | 84.2% | 71.0% | 83.5% | 84.4% | 84.4% |
| Net margin | 64.0% | 65.4% | 67.6% | 66.8% | 67.4% | 67.7% | 67.5% | 67.4% | 56.2% | 66.4% | 67.5% | 67.5% |
| YoY (%) | ||||||||||||
| Net revenue | 38% | 156% | 197% | 175% | 155% | 35% | 27% | 27% | 73% | 145% | 45% | 27% |
| Gross profit | 41% | 189% | 251% | 214% | 187% | 36% | 27% | 28% | 90% | 178% | 48% | 27% |
| Operating profit | 34% | 200% | 262% | 226% | 214% | 37% | 28% | 28% | 98% | 185% | 50% | 27% |
| Pre-tax profit | 39% | 916% | 175% | 159% | 169% | 36% | 27% | 28% | 59% | 188% | 47% | 27% |
| Net profit | 39% | 1054% | 175% | 159% | 169% | 40% | 27% | 28% | 60% | 189% | 48% | 27% |
| QoQ (%) | ||||||||||||
| Net revenue | 10% | 99% | 20% | 5% | 2% | 6% | 13% | 4% | ||||
| Gross profit | 12% | 123% | 21% | 4% | 3% | 6% | 12% | 4% | ||||
| Operating profit | 7% | 143% | 21% | 4% | 3% | 6% | 13% | 4% | ||||
| Pre-tax profit | -1% | 110% | 20% | 3% | 3% | 6% | 13% | 4% | ||||
| Net profit | -1% | 103% | 24% | 3% | 3% | 6% | 13% | 4% |
Source: Company, Daiwa forecasts
King Slide: 2Q26 comparison table
| (TWDm) | Actual | QoQ% | YoY% | Daiwa | Diff% | Consensus | Diff% |
|---|---|---|---|---|---|---|---|
| Revenue | 10,830 | 99% | 156% | 7,195 | 51% | 8,772 | 23% |
| Gross profit | 9,468 | 123% | 189% | 5,449 | 74% | 6,795 | 39% |
| Gross margin (%) | 87.4% | 75.7% | 77.5% | ||||
| Operating profit | 8,890 | 143% | 200% | 4,945 | 80% | 5,974 | 49% |
| Operating margin (%) | 82.1% | 68.7% | 68.1% | ||||
| Pre-tax profit | 9,118 | 110% | 916% | 5,139 | 77% | 6,192 | 47% |
| Net profit | 7,088 | 103% | 1054% | 4,112 | 72% | 4,884 | 45% |
| EPS (TWD) | 74.38 | 103% | 1054% | 43.15 | 72% | 51.25 | 45% |
Source: Company data, Daiwa forecasts, Bloomberg
King Slide: 1-year forward PER bands
Source: TEJ, Daiwa forecasts
King Slide: revenue breakdown
Source: Company, Daiwa forecasts
Daiwa
Financial summary
Key assumptions
| Year to 31 Dec | 2021 | 2022 | 2023 | 2024 | 2025 | 2026E | 2027E | 2028E |
|---|---|---|---|---|---|---|---|---|
| Server railkit shipment (k) | 3,938.0 | 4,477.0 | 3,556.9 | 2,711.9 | 6,021.2 | 13,568.7 | 19,055.5 | 23,782.4 |
| HGX railkit shipment (k) | 0.0 | 0.0 | 90.0 | 360.0 | 270.0 | 248.5 | 180.0 | 85.0 |
| NVL railkit shipment (k) | 0.0 | 0.0 | 0.0 | 0.0 | 636.7 | 1,572.8 | 1,736.3 | 1,522.5 |
Profit and loss (TWDm)
| Year to 31 Dec | 2021 | 2022 | 2023 | 2024 | 2025 | 2026E | 2027E | 2028E |
|---|---|---|---|---|---|---|---|---|
| Regular server railkit sales | 4,489 | 5,081 | 2,678 | 2,451 | 6,126 | 24,738 | 39,145 | 53,753 |
| AI server railkit sales | 0 | 0 | 982 | 5,668 | 9,122 | 16,303 | 20,954 | 22,497 |
| Other Revenue | 1,853 | 2,717 | 2,103 | 2,011 | 2,252 | 1,832 | 2,271 | 2,939 |
| Total Revenue | 6,342 | 7,799 | 5,763 | 10,129 | 17,501 | 42,873 | 62,370 | 79,189 |
| Other income | 0 | 0 | 0 | 0 | 0 | 0 | 0 | 0 |
| COGS | (2,987) | (3,333) | (2,231) | (3,128) | (4,192) | (5,919) | (7,704) | (9,777) |
| SG&A | (386) | (474) | (408) | (550) | (743) | (1,650) | (1,884) | (2,293) |
| Other op.expenses | (250) | (239) | (235) | (351) | (477) | (840) | (1,027) | (1,145) |
| Operating profit | 2,720 | 3,753 | 2,888 | 6,101 | 12,089 | 34,463 | 51,755 | 65,974 |
| Net-interest inc./(exp.) | 10 | 159 | 495 | 653 | 692 | 758 | 755 | 755 |
| Assoc/forex/extraord./others | (134) | 1,162 | 43 | 1,035 | (358) | 595 | 103 | 113 |
| Pre-tax profit | 2,596 | 5,073 | 3,426 | 7,789 | 12,423 | 35,816 | 52,614 | 66,842 |
| Tax | (523) | (1,017) | (721) | (1,633) | (2,586) | (7,363) | (10,518) | (13,362) |
| Min. int./pref. div./others | 0 | 0 | 0 | 0 | 0 | 0 | 0 | 0 |
| Net profit (reported) | 2,073 | 4,056 | 2,704 | 6,156 | 9,837 | 28,452 | 42,096 | 53,480 |
| Net profit (adjusted) | 2,073 | 4,056 | 2,704 | 6,156 | 9,837 | 28,452 | 42,096 | 53,480 |
| EPS (reported)(TWD) | 21.748 | 42.563 | 28.378 | 64.594 | 103.225 | 298.566 | 441.735 | 561.190 |
| EPS (adjusted)(TWD) | 21.748 | 42.563 | 28.378 | 64.594 | 103.225 | 298.566 | 441.735 | 561.190 |
| EPS (adjusted fully-diluted)(TWD) | 21.748 | 42.563 | 28.378 | 64.594 | 103.225 | 298.566 | 441.735 | 561.190 |
| DPS (TWD) | 6.120 | 10.880 | 20.000 | 14.190 | 32.200 | 51.000 | 60.000 | 66.000 |
| EBIT | 2,720 | 3,753 | 2,888 | 6,101 | 12,089 | 34,463 | 51,755 | 65,974 |
| EBITDA | 2,934 | 3,977 | 3,157 | 6,429 | 12,449 | 34,966 | 52,601 | 67,169 |
Cash flow (TWDm)
| Year to 31 Dec | 2021 | 2022 | 2023 | 2024 | 2025 | 2026E | 2027E | 2028E |
|---|---|---|---|---|---|---|---|---|
| Profit before tax | 2,596 | 5,073 | 3,426 | 7,789 | 12,423 | 35,816 | 52,614 | 66,842 |
| Depreciation and amortisation | 214 | 224 | 269 | 328 | 360 | 502 | 845 | 1,195 |
| Tax paid | (523) | (1,017) | (721) | (1,633) | (2,586) | (7,363) | (10,518) | (13,362) |
| Change in working capital | (997) | (209) | 52 | (1,598) | (1,230) | 811 | (1,953) | (1,709) |
| Other operational CF items | 228 | (133) | 252 | 301 | 2,366 | 0 | 0 | (0) |
| Cash flow from operations | 1,518 | 3,938 | 3,278 | 5,187 | 11,334 | 29,766 | 40,989 | 52,965 |
| Capex | (768) | (824) | (375) | (354) | (922) | (4,287) | (4,366) | (5,543) |
| Net (acquisitions)/disposals | (1,495) | 389 | 215 | 884 | 2 | 0 | 0 | 0 |
| Other investing CF items | 1 | (1) | (0) | (0) | (8) | 0 | 0 | 0 |
| Cash flow from investing | (2,261) | (436) | (161) | 530 | (927) | (4,287) | (4,366) | (5,543) |
| Change in debt | 257 | 448 | (32) | (130) | (268) | 0 | 0 | 0 |
| Net share issues/(repurchases) | 0 | 0 | 0 | 0 | 0 | 0 | 0 | 0 |
| Dividends paid | (583) | (1,037) | (1,906) | (1,352) | (3,069) | (4,860) | (5,718) | (6,290) |
| Other financing CF items | (33) | (35) | (28) | (26) | (26) | 0 | 0 | 0 |
| Cash flow from financing | (359) | (624) | (1,966) | (1,508) | (3,363) | (4,860) | (5,718) | (6,290) |
| Forex effect/others | (22) | 788 | (141) | 676 | (452) | 0 | 0 | 0 |
| Change in cash | (1,124) | 3,666 | 1,010 | 4,886 | 6,591 | 20,619 | 30,905 | 41,132 |
| Free cash flow | 751 | 3,114 | 2,903 | 4,833 | 10,412 | 25,479 | 36,623 | 47,422 |
Source: FactSet, Daiwa forecasts
King Slide Works (2059 TT): 6 August 2026
Daiwa
Financial summary continued …
Balance sheet (TWDm)
| Year to 31 Dec | 2021 | 2022 | 2023 | 2024 | 2025 | 2026E | 2027E | 2028E |
|---|---|---|---|---|---|---|---|---|
| Cash & short-term investment | 9,421 | 12,698 | 13,494 | 17,495 | 24,084 | 44,703 | 75,608 | 116,740 |
| Inventory | 926 | 920 | 1,012 | 1,231 | 1,165 | 1,297 | 1,689 | 2,143 |
| Accounts receivable | 1,774 | 1,866 | 1,656 | 3,180 | 4,687 | 4,111 | 5,981 | 7,593 |
| Other current assets | 31 | 36 | 40 | 43 | 54 | 54 | 54 | 54 |
| Total current assets | 12,151 | 15,520 | 16,202 | 21,949 | 29,990 | 50,165 | 83,331 | 126,530 |
| Fixed assets | 2,446 | 2,955 | 3,192 | 3,287 | 3,882 | 7,666 | 11,187 | 15,535 |
| Goodwill & intangibles | 3 | 2 | 3 | 2 | 6 | 6 | 6 | 6 |
| Other non-current assets | 832 | 759 | 1,184 | 1,234 | 1,206 | 1,206 | 1,206 | 1,206 |
| Total assets | 15,433 | 19,236 | 20,581 | 26,472 | 35,083 | 59,043 | 95,729 | 143,277 |
| Short-term debt | 0 | 0 | 0 | 0 | 0 | 0 | 0 | 0 |
| Accounts payable | 469 | 374 | 309 | 441 | 654 | 1,022 | 1,330 | 1,688 |
| Other current liabilities | 1,211 | 1,599 | 1,866 | 2,708 | 4,713 | 4,713 | 4,713 | 4,713 |
| Total current liabilities | 1,680 | 1,973 | 2,174 | 3,149 | 5,367 | 5,734 | 6,042 | 6,400 |
| Long-term debt | 452 | 895 | 741 | 615 | 377 | 377 | 377 | 377 |
| Other non-current liabilities | 698 | 730 | 1,229 | 1,416 | 1,313 | 1,313 | 1,313 | 1,313 |
| Total liabilities | 2,830 | 3,598 | 4,145 | 5,180 | 7,057 | 7,425 | 7,733 | 8,091 |
| Share capital | 953 | 953 | 953 | 953 | 953 | 953 | 953 | 953 |
| Reserves/R.E./others | 11,650 | 14,685 | 15,483 | 20,339 | 27,073 | 50,665 | 87,043 | 134,234 |
| Shareholders' equity | 12,603 | 15,638 | 16,436 | 21,292 | 28,026 | 51,618 | 87,996 | 135,187 |
| Minority interests | 0 | 0 | 0 | 0 | 0 | 0 | 0 | 0 |
| Total equity & liabilities | 15,433 | 19,236 | 20,581 | 26,472 | 35,083 | 59,043 | 95,729 | 143,277 |
| EV | 953,532 | 950,697 | 949,748 | 945,620 | 938,794 | 918,175 | 887,270 | 846,138 |
| Net debt/(cash) | (8,969) | (11,804) | (12,753) | (16,880) | (23,707) | (44,326) | (75,230) | (116,363) |
| BVPS (TWD) | 132.253 | 164.101 | 172.473 | 223.431 | 294.090 | 541.656 | 923.391 | 1,418.581 |
Key ratios (%)
| Year to 31 Dec | 2021 | 2022 | 2023 | 2024 | 2025 | 2026E | 2027E | 2028E |
|---|---|---|---|---|---|---|---|---|
| Sales (YoY) | 32.1 | 23.0 | (26.1) | 75.8 | 72.8 | 145.0 | 45.5 | 27.0 |
| EBITDA (YoY) | 36.0 | 35.5 | (20.6) | 103.6 | 93.6 | 180.9 | 50.4 | 27.7 |
| Operating profit (YoY) | 38.6 | 38.0 | (23.0) | 111.2 | 98.2 | 185.1 | 50.2 | 27.5 |
| Net profit (YoY) | 78.0 | 95.7 | (33.3) | 127.6 | 59.8 | 189.2 | 48.0 | 27.0 |
| Core EPS (fully-diluted) (YoY) | 78.0 | 95.7 | (33.3) | 127.6 | 59.8 | 189.2 | 48.0 | 27.0 |
| Gross-profit margin | 52.9 | 57.3 | 61.3 | 69.1 | 76.0 | 86.2 | 87.6 | 87.7 |
| EBITDA margin | 46.3 | 51.0 | 54.8 | 63.5 | 71.1 | 81.6 | 84.3 | 84.8 |
| Operating-profit margin | 42.9 | 48.1 | 50.1 | 60.2 | 69.1 | 80.4 | 83.0 | 83.3 |
| Net profit margin | 32.7 | 52.0 | 46.9 | 60.8 | 56.2 | 66.4 | 67.5 | 67.5 |
| ROAE | 17.5 | 28.7 | 16.9 | 32.6 | 39.9 | 71.4 | 60.3 | 47.9 |
| ROAA | 14.4 | 23.4 | 13.6 | 26.2 | 32.0 | 60.5 | 54.4 | 44.8 |
| ROCE | 22.3 | 25.4 | 17.1 | 31.2 | 48.1 | 85.7 | 73.7 | 58.9 |
| ROIC | 73.5 | 80.3 | 60.7 | n.a | n.a | n.a | n.a | n.a |
| Net debt to equity | n.a. | n.a. | n.a. | n.a. | n.a. | n.a. | n.a. | n.a. |
| Effective tax rate | 20.2 | 20.0 | 21.1 | 21.0 | 20.8 | 20.6 | 20.0 | 20.0 |
| Accounts receivable (days) | 83.0 | 85.2 | 111.6 | 87.1 | 82.0 | 37.5 | 29.5 | 31.3 |
| Current ratio (x) | 7.2 | 7.9 | 7.5 | 7.0 | 5.6 | 8.7 | 13.8 | 19.8 |
| Net interest cover (x) | n.a. | n.a. | n.a. | n.a. | n.a. | n.a. | n.a. | n.a. |
| Net dividend payout | 50.1 | 50.0 | 47.0 | 50.0 | 49.9 | 49.4 | 20.1 | 14.9 |
| Free cash flow yield | 0.1 | 0.3 | 0.3 | 0.5 | 1.1 | 2.6 | 3.8 | 4.9 |
Source: FactSet, Daiwa forecasts
Company profile
Founded in 1986, King Slide Works started as a rail kit manufacturer. Leveraging its years of mechanism design experience, the company soon started manufacturing server rail kit in 2000. With 40 years of development, King Slide's product portfolio now comprises server rail kit, kitchen rail kit and hinge. The company is headquartered in Kaohsiung city with two production sites including King Slide Works Co., LTD (ball bearing slide and hinge) and King Slide Technology Co., LTD (server rail kit and functional kitchen rail kit). King Slide also owns sales offices in the US and China. It was listed on the Taiwan Stock Exchange in 2008.
King Slide Works (2059 TT): 6 August 2026
Daiwa
ESG analysis
ESG risks
| Risks | Management | Analyst comments | |
|---|---|---|---|
| G | Executive/board quality | 2 | King Slide's board consists of 7 directors, including 4 independent directors. The total number of directors is lower than that of other listed companies in our coverage. King Slide held 6 board meetings in 2024; the actual attendee rate was 100%. Most of the board members are King Slide's founder's family members, which we believe presents downside risks to independent governance. However, the independent directors have diversified backgrounds with expertise in accounting and management, a positive for the board's quality. |
| Capital management | 2 | King Slide declared a DPS of TWD32.2 in 2024, representing a payout ratio of 50%. The payout ratio was in line with the level of 46-53% during 2012-22. As a rail kit manufacturer, King Slide is set to deliver solid revenue growth and FCF over our forecast horizon amidst strong ASP increase in the AI server market. | |
| Related party & transaction | 1 | The company did not report any related-party transactions in 2024. We see limited risks from related party transactions. | |
| S | Product design & lifecycle management | 2 | King Slide applies life cycle thinking and the 3R principle (Reduce/Reuse/Recycle) across its product design to minimise environmental impact. Its green designs focus on controlling environmentally sensitive substances, using non toxic materials, and enabling easy assembly/disassembly to extend product lifespans. The company continues to advance its green product program. Based on 2024 shipments, carbon reductions amounted to 68,067 metric tons of CO2e versus 2023, underscoring progress in lowering the environmental footprint of its products. |
| S | GHG emissions | 2 | King Slide is cutting greenhouse-gas emissions through targeted energy-efficient upgrades and process improvements. Across its Works and Technology sites, the company is replacing older motors and lighting with more efficient alternatives, introducing a formal GHG-reducing inventory, and refining equipment controls to eliminate unnecessary idling. These practical measures reduce electricity use, improve operational efficiency and lower the company's carbon footprint in a cost-effective, scalable way. |
Note: Management score represents a company's ability to manage/benefit from certain ESG topics. The scores range from 1 to 3, with 1 being the strongest.
Update Date: 3 Feb 2026
Source: Daiwa, Company
King Slide Works (2059 TT): 6 August 2026
Daiwa