PDF 原檔:報告_Daiwa_南俊國際6584_20260819_original.pdf
已驗證圖片清單(Step 2.5,2026-08-20 逐張 Read)
| 檔名 | size | 分類 | 親眼所見內容 |
|---|---|---|---|
報告_Daiwa_南俊國際6584_20260819_003.png |
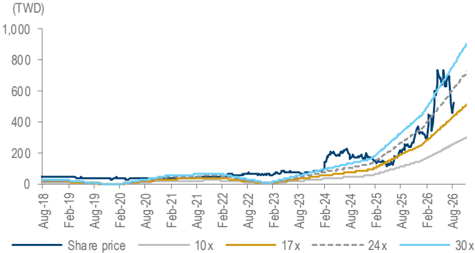
40KB | 真資料圖 | 1-year-forward PER bands,2018/8-2026/8 股價(深藍)疊 10x/17x/24x/30x 帶,2026 年股價在 24x-30x 帶間震盪、高點逾 800 元 |
報告_Daiwa_南俊國際6584_20260819_004.png |
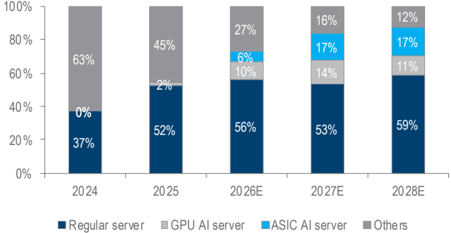
30KB | 真資料圖 | 營收結構堆疊柱狀圖(Regular server/GPU AI server/ASIC AI server/Others):2024 年 37%/0%/—/63%;2025 年 52%/2%/—/45%;2026E 56%/10%/6%/27%;2027E 53%/14%/17%/16%;2028E 59%/11%/17%/12% |
原始內容
Taiwan
Nan Juen International (6584 TT)
Target price:
TWD1,022.00 (from TWD1,022.00)
Share price (19 Aug): TWD600.00 | Up/downside: +70.3%
2Q26 review: structural growth intact
- 2Q26 earnings beat on non-op gains, but core margins softened
- Regular server weakness offset by AI server rail kit
- Reaffirming our Buy (1) rating with 12-month TP of TWD1,022
What's new: Nan Juen released its 2Q26 results on 12 August. We provide our views in this report.
What's the impact: 2Q26 results beat on non-op gain. Nan Juen's 2Q26 earnings came in at TWD219m (EPS: TWD3.1), which was 5% higher than our estimate but 6% lower than consensus. Revenue was slightly below expectations, while gross margin edged up 0.2pp QoQ to 41.8%, which was modestly below both our and the street's estimates, mainly due to lower-than-expected revenue contribution from high-ASP regular server rail kits. Operating margin similarly rose 0.2pp QoQ to 29.7%, following the gross margin trend. Net profit was boosted by a higher-than-expected nonoperating gain of c.TWD21m, mainly driven by FX gains and government subsidies.
Business outlook. Looking into 3Q26, we expect shipments of one of its CSP client's regular server rail kits to remain weak, with 2Q26 monthly shipment declining to below 30k sets per month (vs. over 80k sets per month in 1Q26), while shipments to other CSP client should remain stable. As a result, we lower our 2026E regular server revenue forecast to TWD2.0bn from TWD2.4bn previously. That said, with Nan Juen now in mass production for both its GPU and ASIC projects, we expect AI server rail kit shipments to drive further revenue growth in 3Q26 and also lift margins, consistent with our previous expectations. Nan Juen's own Vera Rubin shipment schedule remains on track, targeting late-3Q26 shipments to its primary CSP customer. On ASIC, the mass production status by the CSP further solidifies our conviction. We maintain our 20-30% supply share assumption for this generation of ASIC in 2H26E and 2027E. Combined with the structural margin improvement from Vietnam, a regular server rebound could push gross margins above our current estimates, reinforcing our positive view on the stock. We remain positive on Nan Juen's product mix shift toward higher-margin server rail kits and its expanding AI server contribution. Overall, we believe its EPS growth trajectory over 2026-28E remains firmly on track.
What we recommend: We cut our 2026-27E EPS by 11-13% to reflect the current weakness in its regular server rail kit orders, but raise our 2028E EPS by c.2% to factor in the latest positive update on ASIC and AI margin contribution. We reaffirm Buy (1) and 12M TP of TWD1,022, based on a PER of 36x (vs. its past-3-year range of 11-90x), applied to our 4-quarterforward EPS forecast. Key downside risk: worse-than-expected AI server demand.
How we differ: Our 2027-28E EPS are 3-8% above the Bloomberg consensus, likely as we are more positive on Nan Juen's gross margin.
19 August 2026
Daiwa
5
3
→
2
1
Buy
Allan Wang
(886) 2 8758 6249
allan.wang@daiwacm-cathay.com.tw
Sheng Cheng (886) 2 8758 6253 sheng.cheng@daiwacm-cathay.com.tw
Forecast revisions (%)
| Year to 31 Dec | 26E | 27E | 28E |
|---|---|---|---|
| Revenue change | (10.4) | (13.0) | (0.5) |
| Net profit change | (11.3) | (9.6) | 3.2 |
| Core EPS (FD) change | (12.6) | (10.8) | 1.7 |
Source: Daiwa forecasts
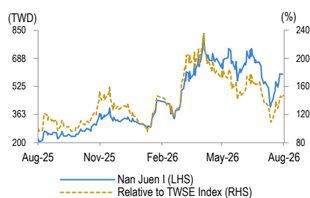
Share price performance
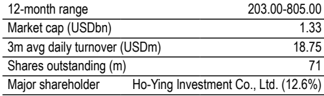
| 12-month range | 203.00-805.00 |
|---|---|
| Market cap (USDbn) | 1.33 |
| 3m avg daily turnover (USDm) | 18.75 |
| Shares outstanding (m) | 71 |
| Major shareholder Ho-Ying | lnvestment Co., Ltd. (12.6%) |
Financial summary (TWD)
| Year to 31 Dec | 26E | 27E | 28E |
|---|---|---|---|
| Revenue (m) | 3,781 | 6,417 | 8,206 |
| Operating profit (m) | 1,247 | 2,825 | 4,023 |
| Net profit (m) | 1,050 | 2,267 | 3,226 |
| Core EPS (fully-diluted) | 14.867 | 32.093 | 45.660 |
| EPS change (%) | 179.9 | 115.9 | 42.3 |
| Daiwa vs Cons. EPS (%) | (10.6) | 8.4 | 3.2 |
| PER (x) | 40.4 | 18.7 | 13.1 |
| Dividend yield (%) | 0.4 | 1.5 | 2.8 |
| DPS | 2.5 | 9.0 | 17.0 |
| PBR (x) | 10.5 | 7.5 | 5.5 |
| EV/EBITDA (x) | 27.5 | 12.9 | 8.8 |
| ROE (%) | 29.3 | 46.8 | 48.3 |
Source: FactSet, Daiwa forecasts
Nan Juen International (6584 TT): 19 August 2026
Nan Juen: Daiwa revenue and earnings forecasts revisions vs. the consensus
| 2026E | 2026E | 2026E | 2027E | 2027E | 2027E | 2028E | 2028E | 2028E | |
|---|---|---|---|---|---|---|---|---|---|
| (TWDm) | Previous | New | Consensus | Previous | New | Consensus | Previous | New | Consensus |
| Revenue | 4,220 | 3,781 | 4,049 | 7,376 | 6,417 | 6,258 | 8,245 | 8,206 | 8,245 |
| Diff (%) | -10.4% | -6.6% | -13.0% | 2.5% | -0.5% | -0.5% | |||
| Gross Margin (%) | 46.1% | 45.0% | 42.1% | 54.3% | 55.9% | 52.8% | 59.1% | 60.8% | 59.1% |
| Operating profit | 1,439 | 1,248 | 1,413 | 3,129 | 2,826 | 2,582 | 3,904 | 4,024 | 3,904 |
| Op Margin (%) | 34.1% | 33.0% | 34.9% | 42.4% | 44.0% | 41.3% | 47.3% | 49.0% | 47.3% |
| Net profit | 1,185 | 1,050 | 1,175 | 2,507 | 2,268 | 2,092 | 3,126 | 3,226 | 3,127 |
| EPS (TWD) | 17.00 | 14.87 | 16.63 | 35.98 | 32.10 | 29.61 | 44.88 | 45.67 | 44.26 |
| Diff (%) | -12.6% | -10.6% | -10.8% | 8.4% | 1.7% | 3.2% |
Source: Bloomberg, Daiwa forecasts
Nan Juen: quarterly and annual P&L statement
| 2026E | 2026E | 2026E | 2026E | 2027E | 2027E | 2027E | 2027E | 2025 | 2026E | 2027E | 2028E | |
|---|---|---|---|---|---|---|---|---|---|---|---|---|
| (TWDm) | 1Q | 2Q | 3QE | 4QE | 1QE | 2QE | 3QE | 4QE | ||||
| Net revenue | 867 | 846 | 898 | 1,169 | 1,329 | 1,618 | 1,774 | 1,696 | 2,433 | 3,781 | 6,417 | 8,206 |
| COGS | -507 | -492 | -495 | -585 | -570 | -717 | -784 | -758 | -1,582 | -2,079 | -2,829 | -3,221 |
| Gross profit | 360 | 354 | 403 | 585 | 759 | 901 | 990 | 937 | 851 | 1,702 | 3,588 | 4,985 |
| Operating expenses | -105 | -102 | -108 | -140 | -160 | -191 | -208 | -203 | -367 | -455 | -762 | -962 |
| Operating profit | 255 | 251 | 295 | 444 | 600 | 710 | 783 | 734 | 484 | 1,248 | 2,826 | 4,024 |
| Non-operating profit | 39 | 21 | 2 | 3 | 2 | 2 | 2 | 2 | 48 | 65 | 9 | 8 |
| Pre-tax profit | 294 | 273 | 297 | 447 | 602 | 712 | 785 | 736 | 532 | 1,312 | 2,835 | 4,033 |
| Income taxes | -59 | -54 | -59 | -89 | -120 | -142 | -157 | -147 | -162 | -262 | -567 | -806 |
| Net profit | 235 | 219 | 238 | 358 | 482 | 569 | 628 | 589 | 370 | 1,050 | 2,268 | 3,226 |
| Net EPS (TWD) | 3.33 | 3.10 | 3.37 | 5.06 | 6.82 | 8.06 | 8.89 | 8.34 | 5.31 | 14.87 | 32.10 | 45.67 |
| Operating Ratios | ||||||||||||
| Gross margin | 41.6% | 41.8% | 44.9% | 50.0% | 57.1% | 55.7% | 55.8% | 55.3% | 35.0% | 45.0% | 55.9% | 60.8% |
| Operating margin | 29.5% | 29.7% | 32.9% | 38.0% | 45.1% | 43.9% | 44.1% | 43.3% | 19.9% | 33.0% | 44.0% | 49.0% |
| Pre-tax margin | 34.0% | 32.2% | 33.1% | 38.2% | 45.3% | 44.0% | 44.2% | 43.4% | 21.9% | 34.7% | 44.2% | 49.1% |
| Net margin | 27.1% | 25.9% | 26.5% | 30.6% | 36.2% | 35.2% | 35.4% | 34.7% | 15.2% | 27.8% | 35.3% | 39.3% |
| YoY (%) | ||||||||||||
| Net revenue | 74% | 41% | 44% | 65% | 53% | 91% | 98% | 45% | 26% | 55% | 70% | 28% |
| Gross profit | 139% | 81% | 77% | 110% | 111% | 154% | 146% | 60% | 69% | 100% | 111% | 39% |
| Operating profit | 255% | 159% | 119% | 147% | 135% | 182% | 165% | 65% | 138% | 158% | 127% | 42% |
| Pre-tax profit | 259% | 490% | 82% | 86% | 104% | 161% | 164% | 65% | 121% | 147% | 116% | 42% |
| Net profit | 260% | 2515% | 83% | 115% | 105% | 160% | 164% | 65% | 92% | 184% | 116% | 42% |
| QoQ (%) | ||||||||||||
| Net revenue | 22% | -2% | 6% | 30% | 14% | 22% | 10% | -4% | ||||
| Gross profit | 30% | -2% | 14% | 45% | 30% | 19% | 10% | -5% | ||||
| Operating profit | 42% | -2% | 18% | 50% | 35% | 18% | 10% | -6% | ||||
| Pre-tax profit | 23% | -7% | 9% | 50% | 35% | 18% | 10% | -6% | ||||
| Net profit | 42% | -7% | 9% | 50% | 35% | 18% | 10% | -6% |
Source: Company, Daiwa forecasts
Nan Juen: 1-year-forward PER bands
Source: TEJ, Daiwa forecasts
Nan Juen: revenue breakdown
Source: Company, Daiwa forecasts
Daiwa
Financial summary
Key assumptions
| Year to 31 Dec | 2021 | 2022 | 2023 | 2024 | 2025 | 2026E | 2027E | 2028E |
|---|---|---|---|---|---|---|---|---|
| Server rail kit revenue | 0 | 479.7 | 357.6 | 712.1 | 1,327.1 | 2,711.8 | 5,395.1 | 7,184.7 |
| Regular server rail kit revenue | 0 | 479.7 | 357.6 | 712.1 | 1,270.6 | 2,096.3 | 3,422.0 | 4,815.9 |
| AI server rail kit revenue | 0 | 0 | 0 | 0 | 56.6 | 615.4 | 1,973.1 | 2,368.8 |
Profit and loss (TWDm)
| Year to 31 Dec | 2021 | 2022 | 2023 | 2024 | 2025 | 2026E | 2027E | 2028E |
|---|---|---|---|---|---|---|---|---|
| Regular server railkit sales | 0 | 480 | 358 | 712 | 1,271 | 2,096 | 3,422 | 4,816 |
| AI server railkit sales | 0 | 0 | 0 | 0 | 57 | 615 | 1,973 | 2,369 |
| Other Revenue | 2,041 | 1,519 | 967 | 1,212 | 1,106 | 1,069 | 1,021 | 1,021 |
| Total Revenue | 2,041 | 1,999 | 1,324 | 1,924 | 2,433 | 3,781 | 6,417 | 8,206 |
| Other income | 0 | 0 | 0 | 0 | 0 | 0 | 0 | 0 |
| COGS | (1,669) | (1,636) | (1,085) | (1,422) | (1,582) | (2,079) | (2,829) | (3,221) |
| SG&A | (208) | (230) | (191) | (237) | (301) | (378) | (633) | (797) |
| Other op.expenses | (31) | (48) | (38) | (62) | (66) | (77) | (129) | (165) |
| Operating profit | 133 | 85 | 9 | 203 | 484 | 1,247 | 2,825 | 4,023 |
| Net-interest inc./(exp.) | (22) | (22) | (17) | (17) | (12) | (6) | (6) | (6) |
| Assoc/forex/extraord./others | (6) | 110 | 12 | 54 | 60 | 71 | 15 | 14 |
| Pre-tax profit | 105 | 172 | 5 | 240 | 532 | 1,312 | 2,834 | 4,032 |
| Tax | (18) | (42) | 4 | (48) | (162) | (262) | (567) | (806) |
| Min. int./pref. div./others | 0 | 0 | 0 | 0 | 0 | 0 | 0 | 0 |
| Net profit (reported) | 87 | 131 | 8 | 192 | 370 | 1,050 | 2,267 | 3,226 |
| Net profit (adjusted) | 87 | 131 | 8 | 192 | 370 | 1,050 | 2,267 | 3,226 |
| EPS (reported)(TWD) | 1.653 | 2.234 | 0.127 | 2.914 | 5.311 | 14.867 | 32.093 | 45.660 |
| EPS (adjusted)(TWD) | 1.653 | 2.234 | 0.127 | 2.914 | 5.311 | 14.867 | 32.093 | 45.660 |
| EPS (adjusted fully-diluted)(TWD) | 1.653 | 2.234 | 0.127 | 2.914 | 5.311 | 14.867 | 32.093 | 45.660 |
| DPS (TWD) | 0.000 | 1.000 | 1.200 | 1.005 | 1.500 | 2.500 | 9.000 | 17.000 |
| EBIT | 133 | 85 | 9 | 203 | 484 | 1,247 | 2,825 | 4,023 |
| EBITDA | 267 | 218 | 125 | 322 | 628 | 1,500 | 3,101 | 4,332 |
Cash flow (TWDm)
| Year to 31 Dec | 2021 | 2022 | 2023 | 2024 | 2025 | 2026E | 2027E | 2028E |
|---|---|---|---|---|---|---|---|---|
| Profit before tax | 105 | 172 | 5 | 240 | 532 | 1,312 | 2,834 | 4,032 |
| Depreciation and amortisation | 134 | 133 | 116 | 119 | 143 | 253 | 275 | 309 |
| Tax paid | (18) | (42) | 4 | (48) | (162) | (262) | (567) | (806) |
| Change in working capital | (238) | 64 | (10) | (133) | (251) | 322 | (288) | (190) |
| Other operational CF items | 57 | 43 | (34) | 117 | 78 | 0 | 0 | 0 |
| Cash flow from operations | 40 | 370 | 80 | 295 | 341 | 1,625 | 2,255 | 3,344 |
| Capex | (68) | (70) | (29) | (113) | (122) | (284) | (417) | (246) |
| Net (acquisitions)/disposals | 0 | 0 | 0 | 0 | 0 | 0 | 0 | 0 |
| Other investing CF items | (7) | (4) | (3) | (21) | (9) | 0 | 0 | 0 |
| Cash flow from investing | (76) | (74) | (32) | (134) | (131) | (284) | (417) | (246) |
| Change in debt | 226 | (383) | (328) | 111 | 84 | 0 | 0 | 0 |
| Net share issues/(repurchases) | 45 | 171 | 413 | 0 | 0 | 10 | 0 | 0 |
| Dividends paid | 0 | (52) | (70) | (66) | (99) | (177) | (636) | (1,201) |
| Other financing CF items | (23) | (24) | (21) | (285) | (47) | 0 | 0 | 0 |
| Cash flow from financing | 248 | (289) | (7) | (240) | (62) | (167) | (636) | (1,201) |
| Forex effect/others | (0) | 1 | 0 | (3) | (2) | 0 | 0 | 0 |
| Change in cash | 212 | 9 | 42 | (82) | 145 | 1,175 | 1,202 | 1,897 |
| Free cash flow | (29) | 300 | 52 | 181 | 219 | 1,342 | 1,838 | 3,098 |
Source: FactSet, Daiwa forecasts
Nan Juen International (6584 TT): 19 August 2026
Daiwa
Financial summary continued …
Balance sheet (TWDm)
| Year to 31 Dec | 2021 | 2022 | 2023 | 2024 | 2025 | 2026E | 2027E | 2028E |
|---|---|---|---|---|---|---|---|---|
| Cash & short-term investment | 363 | 384 | 414 | 327 | 496 | 1,671 | 2,874 | 4,772 |
| Inventory | 330 | 288 | 262 | 298 | 487 | 456 | 620 | 706 |
| Accounts receivable | 432 | 280 | 297 | 436 | 536 | 363 | 615 | 787 |
| Other current assets | 40 | 13 | 12 | 23 | 57 | 57 | 57 | 57 |
| Total current assets | 1,164 | 965 | 984 | 1,084 | 1,577 | 2,546 | 4,166 | 6,322 |
| Fixed assets | 2,530 | 2,492 | 2,430 | 2,454 | 2,464 | 2,495 | 2,637 | 2,574 |
| Goodwill & intangibles | 7 | 7 | 7 | 9 | 11 | 11 | 11 | 11 |
| Other non-current assets | 58 | 50 | 78 | 394 | 334 | 334 | 334 | 334 |
| Total assets | 3,759 | 3,513 | 3,499 | 3,941 | 4,386 | 5,386 | 7,148 | 9,242 |
| Short-term debt | 428 | 253 | 419 | 117 | 0 | 0 | 0 | 0 |
| Accounts payable | 305 | 185 | 161 | 204 | 242 | 359 | 488 | 556 |
| Other current liabilities | 319 | 335 | 259 | 301 | 411 | 411 | 411 | 411 |
| Total current liabilities | 1,052 | 773 | 839 | 622 | 653 | 770 | 900 | 967 |
| Long-term debt | 1,388 | 1,166 | 696 | 1,027 | 552 | 552 | 552 | 552 |
| Other non-current liabilities | 11 | 4 | 39 | 61 | 37 | 37 | 37 | 37 |
| Total liabilities | 2,451 | 1,942 | 1,573 | 1,710 | 1,243 | 1,360 | 1,489 | 1,557 |
| Share capital | 525 | 585 | 656 | 660 | 697 | 706 | 706 | 706 |
| Reserves/R.E./others | 784 | 986 | 1,269 | 1,571 | 2,447 | 3,320 | 4,953 | 6,978 |
| Shareholders' equity | 1,309 | 1,571 | 1,925 | 2,231 | 3,144 | 4,027 | 5,659 | 7,685 |
| Minority interests | 0 | 0 | 0 | 0 | 0 | 0 | 0 | 0 |
| Total equity & liabilities | 3,759 | 3,513 | 3,499 | 3,941 | 4,386 | 5,386 | 7,148 | 9,242 |
| EV | 43,839 | 43,421 | 43,086 | 43,203 | 42,442 | 41,268 | 40,065 | 38,166 |
| Net debt/(cash) | 1,453 | 1,035 | 700 | 817 | 56 | (1,118) | (2,321) | (4,220) |
| BVPS (TWD) | 24.931 | 26.864 | 29.333 | 33.826 | 45.126 | 57.003 | 80.109 | 108.782 |
Key ratios (%)
| Year to 31 Dec | 2021 | 2022 | 2023 | 2024 | 2025 | 2026E | 2027E | 2028E |
|---|---|---|---|---|---|---|---|---|
| Sales (YoY) | 40.2 | (2.1) | (33.7) | 45.3 | 26.4 | 55.4 | 69.7 | 27.9 |
| EBITDA (YoY) | 137.5 | (18.6) | (42.5) | 157.3 | 94.8 | 138.8 | 106.8 | 39.7 |
| Operating profit (YoY) | 3,825.2 | (36.2) | (88.8) | 2,042.9 | 138.1 | 157.4 | 126.6 | 42.4 |
| Net profit (YoY) | n.a. | 50.6 | (93.6) | 2,208.0 | 92.5 | 183.9 | 115.9 | 42.3 |
| Core EPS (fully-diluted) (YoY) | n.a. | 35.1 | (94.3) | 2,197.0 | 82.2 | 179.9 | 115.9 | 42.3 |
| Gross-profit margin | 18.2 | 18.1 | 18.0 | 26.1 | 35 | 45.0 | 55.9 | 60.8 |
| EBITDA margin | 13.1 | 10.9 | 9.5 | 16.8 | 25.8 | 39.7 | 48.3 | 52.8 |
| Operating-profit margin | 6.5 | 4.2 | 0.7 | 10.6 | 19.9 | 33.0 | 44.0 | 49.0 |
| Net profit margin | 4.3 | 6.5 | 0.6 | 10.0 | 15.2 | 27.8 | 35.3 | 39.3 |
| ROAE | 7.0 | 9.1 | 0.5 | 9.2 | 13.8 | 29.3 | 46.8 | 48.3 |
| ROAA | 2.5 | 3.6 | 0.2 | 5.2 | 8.9 | 21.5 | 36.2 | 39.4 |
| ROCE | 4.5 | 2.8 | 0.3 | 6.3 | 13.7 | 30.1 | 52.4 | 55.7 |
| ROIC | 4.1 | 2.4 | 0.4 | 5.7 | 10.8 | 32.7 | 72.4 | 94.6 |
| Net debt to equity | 111.0 | 65.9 | 36.4 | 36.6 | 1.8 | n.a. | n.a. | n.a. |
| Effective tax rate | 17.0 | 24.2 | 0.0 | 20.0 | 30.4 | 19.9 | 20.0 | 20.0 |
| Accounts receivable (days) | 61.4 | 65.1 | 79.5 | 69.5 | 72.9 | 43.4 | 27.8 | 31.2 |
| Current ratio (x) | 1.1 | 1.2 | 1.2 | 1.7 | 2.4 | 3.3 | 4.6 | 6.5 |
| Net interest cover (x) | 6.0 | 3.8 | 0.6 | 12.1 | 38.9 | 198.9 | 472.0 | 685.1 |
| Net dividend payout | n.a. | 60.5 | 53.7 | 792.1 | 51.5 | 47.1 | 60.5 | 53.0 |
| Free cash flow yield | n.a. | 0.7 | 0.1 | 0.4 | 0.5 | 3.2 | 4.3 | 7.3 |
Source: FactSet, Daiwa forecasts
Company profile
Founded in 1984, Nan Juen International Co., LTD. is a Taiwan-based slide and rail kit manufacturer headquartered in Taoyuan City. The company began its operations as a producer of furniture and kitchen rail kits, leveraging its mechanical engineering expertise to gradually expand its product portfolio. Building on decades of slide mechanism design experience, Nan Juen extended its capabilities into the server rail kit market, which has since become the primary growth driver of the business.
Nan Juen's current product portfolio spans two core categories: server rail kits and others (including kitchen rail kits, office furniture rail kits, etc.). Within the server rail kit segment, the company produces both regular server rail kits and AI server rail kits, serving major CSPs globally. The company has been listed on the Taiwan Stock Exchange under the ticker 6584 TT.
Nan Juen International (6584 TT): 19 August 2026
Daiwa
ESG analysis
ESG risks
| Risks | Management | Analyst comments | |
|---|---|---|---|
| G | Executive/board quality | 2 | Nan Juen's board consists of 9 directors, including 4 independent directors. The total number of directors is slightly lower than that of other listed companies in our coverage. Nan Juen held 6 board meetings in 2025; the actual attendee rate was 98%. Most of the board members are Nan Juen's founder's family members, which we believe presents downside risks to independent governance. However, the independent directors have diversified backgrounds with expertise in accounting and management, a positive for the board's quality. |
| Capital management | 2 | Nan Juen declared a DPS of TWD2.5 in 2025, representing a payout ratio of 48%. The payout ratio was in line with the level of 45-60% during 2021-24. As a rail kit manufacturer, Nan Juen is set to deliver solid revenue growth and FCF over our forecast horizon amidst strong ASP increase in the server rail kit market. | |
| Related party & transaction | 1 | The company did not report any related-party transactions in 2025. We see limited risks from related-party transactions. | |
| S | Product quality & safety | 2 | Nan Juen has implemented a Project Management Information System (PMIS) to streamline R&D workflows and enhance cross-departmental collaboration. The company is further planning to introduce a Product Lifecycle Management (PLM) system, integrating the full product lifecycle from concept through to manufacturing and after-sales service. Beyond operational efficiency, the PLM adoption reflects Nan Juen's commitment to responsible product stewardship, enabling better oversight of material consumption and environmental impact across its operations. The company continues to advance its green product programme. |
| S | Product design & lifecycle management | 2 | Nan Juen is actively reducing its greenhouse gas emissions under a core commitment to net- zero carbon operations, aligned with Taiwan's 2050 net-zero emission policy. The company has adopted ISO 14064-1 GHG inventory standards and maintains ISO 14001:2015 environmental management system certification, providing a structured framework for monitoring and improving energy use and emissions across its operations. Practical measures include regular audits of high-energy-consuming equipment, employee sustainability training, and collaboration with supply chain partners on green procurement. Progress is tracked through internal audits and external verification, with findings reviewed periodically to refine the company's decarbonisation strategy. |
| Supply chain management |
Note: Management score represents a company's ability to manage/benefit from certain ESG topics. The scores range from 1 to 3, with 1 being the strongest.
Update Date: 19 Aug 2026
Source: Daiwa, Company
Nan Juen International (6584 TT): 19 August 2026
Daiwa