PDF 原檔:報告_Daiwa_南亞科_20260706_original.pdf
圖片清單(已驗證 2026-07-07)
ingest 時建立的「眼見為憑」圖片索引,是 lib/ 嵌圖的唯一真相來源;嵌入時只從這裡挑分類為「真資料圖」的,不照 trimmed 引用順序猜。建立步驟見
ingest_steps.mdStep 2.5。
| 檔名 | size | 分類 | 親眼所見內容 |
|---|---|---|---|
(本報告共 6 張圖,全部 <40KB,預設裝飾 / logo,免逐張 Read,無真資料圖候選。)
原始內容
Taiwan
Nanya Technology (2408 TT)
Target price:
TWD650.00 (from TWD292.00)
Share price (6 Jul): TWD420.50 | Up/downside: +54.6%
Solid 2Q26 revenue: intact earnings momentum
- 2Q26 revenue exceeds Bloomberg consensus on DRAM price hikes
- Further earnings upside in 2H26E; DDR4 price momentum until 2027E
- Reaffirming our Buy (1) rating; raising 12-month TP to TWD650
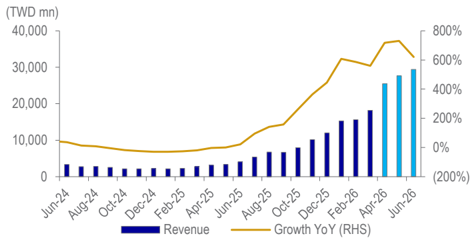
What's new: Nanya announced its June revenue after market hours on 3 July. It posted robust revenue growth in 2Q26 (68% QoQ, 684% YoY) led by DRAM price hikes despite limited bit shipments. With the DDR4 premium over DDR5 maintained, we expect major players' supply reductions to prolong the supply shortage and price uplift into 2027. Nanya will hold its 2Q26 conference call on 10 July. With a positive market outlook and earnings forecasts, we expect the announcement of an enhanced shareholder return plan given the visibility of mid- to long-term demand.
What's the impact: 2Q26 revenue exceeds consensus. Nanya posted revenue of TWD82.5bn (68% QoQ, 684% YoY) in 2Q26, beating the Bloomberg consensus. We also assume its operating profit of TWD49.0bn (101% QoQ, turned positive YoY) was higher than consensus. While we assume limited bit shipments (-3% QoQ) for 2Q26, given a reduced inventory level, we expect an earnings surprise led by a significant increase in DRAM prices of 68% QoQ, driven by sustained strong demand. We expect further earnings improvement in 3Q26, fuelled by continued DRAM price momentum.
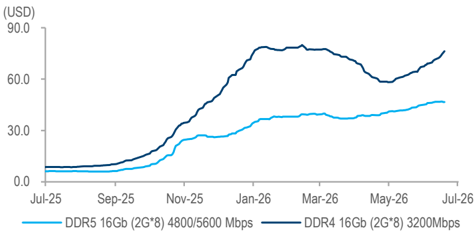
Further earnings upside in 2H26E, with DDR4 price momentum likely to extend into 2027. Per Trendforce's report on 30 June, consumer DRAM remained in shortage through June, extending the price uptrend. Notably, not only DDR4 but DDR3 and DDR2 have also seen significant price hikes. With major DRAM players focusing on HBM and server DRAM, upward pressure on legacy product pricing continues to build. We also expect PC DRAM prices to rise by 20% QoQ in 3Q26. As enterprise SSD demand surges due to rising inference AI demand, we assume strong buffer DRAM demand to be sustained into 2027 and beyond, based on long-term agreements (LTA). Backed by a solid earnings outlook, we expect Nanya to sustain or raise its payout ratio of 50% over 2027-28, despite management having guided for a potential cut due to heavy capex in April. We raise our 2026-2028 EPS by 37-91% reflecting the DRAM price hikes.
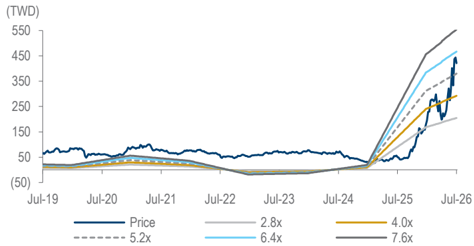
What we recommend: We reiterate our Buy (1) rating and raise our 12month TP to TWD650 (from TWD292), based on a target PER of 9.2x (from 6.8x) on our 2026-27E EPS (from 2026E EPS). Our new multiple applies a 25% premium to the average PER of major DRAM peers, reflecting upside from the buffer DRAM LTA secured via private placement with global customers on 25 March. Downside risk: weaker-than-expected commodity DRAM demand due to delays in data centre build-out.
How we differ: Our 2026-27E EPS are 27-41% above the Bloomberg consensus, likely as we are more positive about the DDR4 price outlook.
6 July 2026
4
Daiwa
5
3
2
1
Buy
SK Kim
SK Kim (82) 2 787 9173 sk.kim@kr.daiwacm.com
Forecast revisions (%)
| Year to 31 Dec | 26E | 27E | 28E |
|---|---|---|---|
| Revenue change | 33.6 | 55.7 | 64.9 |
| Net profit change | 37.3 | 68.6 | 91.3 |
| Core EPS (FD) change | 37.3 | 68.6 | 91.3 |
Source: Daiwa forecasts
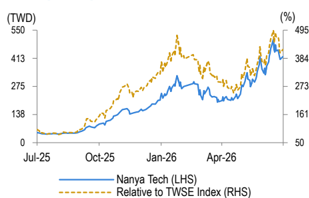
Share price performance
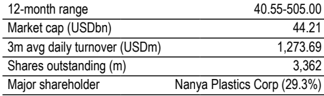
| 12-month range | 40.55-505.00 |
|---|---|
| Market cap (USDbn) | 44.21 |
| 3m avg daily turnover (USDm) | 1,273.69 |
| Shares outstanding (m) | 3,362 |
| Major shareholder | Nanya Plastics Corp (29.3%) |
Financial summary (TWD)
| Year to 31 Dec | 26E | 27E | 28E |
|---|---|---|---|
| Revenue (m) | 331,568 | 471,416 | 480,253 |
| Operating profit (m) | 243,875 | 354,173 | 323,990 |
| Net profit (m) | 198,062 | 285,757 | 261,610 |
| Core EPS (fully-diluted) | 58.907 | 82.823 | 75.824 |
| EPS change (%) | n.a. | 40.6 | (8.5) |
| Daiwa vs Cons. EPS (%) | 27.3 | 41.0 | 47.1 |
| PER (x) | 7.1 | 5.1 | 5.5 |
| Dividend yield (%) | 6.8 | 9.8 | 9.0 |
| DPS | 28.7 | 41.4 | 37.9 |
| PBR (x) | 3.2 | 2.3 | 2.0 |
| EV/EBITDA (x) | 4.6 | 2.9 | 3.0 |
| ROE (%) | 39.2 | 53.8 | 38.2 |
Source: FactSet, Daiwa forecasts
Nanya: 2Q26 preview
| (TWDm) | 2Q26E | 1Q26 | QoQ growth | 2Q25 | YoY growth | BBG consensus | Diff |
|---|---|---|---|---|---|---|---|
| Revenue | 82,549 | 49,087 | 68% | 10,526 | 684% | 71,242 | 16% |
| Operating Profit | 60,570 | 30,111 | 101% | -4,501 | Positive turnaround | 51,850 | 17% |
| OP margin | 73.4% | 61.3% | -42.8% | 72.8% |
Source: Company, Bloomberg
Note: Bloomberg consensus as of 3 July 2026, 2Q26 revenue reflects actual figures (June data announced on 3 July).
Nanya: earnings outlook
| (TWDm) | 1Q26 | 2Q26E | 3Q26E | 4Q26E | 2025E | 2026E | 2027E | 2028E |
|---|---|---|---|---|---|---|---|---|
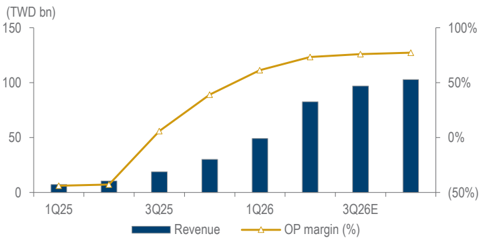
| Revenue | 49,087 | 82,549 | 96,950 | 102,983 | 66,587 | 331,568 | 471,416 | 480,253 |
| Operating profit | 30,111 | 60,570 | 73,627 | 79,567 | 5,243 | 243,875 | 354,173 | 323,990 |
| OP margin (%) | 61.3% | 73.4% | 75.9% | 77.3% | 7.9% | 73.6% | 75.1% | 67.5% |
| Net profit | 26,063 | 48,675 | 59,599 | 63,729 | 7,882 | 198,062 | 285,757 | 261,610 |
Source: Company, Daiwa forecasts
Nanya: key assumptions
| 1Q26 | 2Q26E | 3Q26E | 4Q26E | 2025 | 2026E | 2027E | 2028E | |
|---|---|---|---|---|---|---|---|---|
| DRAM | ||||||||
| Bit growth (q-q%) | 1.0% | -2.9% | 0.0% | -2.0% | 53.8% | 30.8% | -0.8% | 5.0% |
| ASP (q-q%) | 56.3% | 68.0% | 15.0% | 7.0% | 22.7% | 274.5% | 35.0% | -4.3% |
Source: Company, Daiwa forecasts
Nanya: revenue and operating margin forecasts
Source: Company, Daiwa forecasts
DRAM spot price trend
Source: DRAM eXchange, Daiwa
Note: As of 6 July, 2026
Nanya: peers valuation comparison
| Company | Ticker (Bloomberg) | Recom. | Price curr) | Mkt cap (USD $m) | P/E (x) | P/BV (x) | FY26E | ROE (%) | EV/EBITDA | EV/EBITDA | Div yield (%) | Div yield (%) | ||
|---|---|---|---|---|---|---|---|---|---|---|---|---|---|---|
| (Local | FY26E | FY27E | FY26E | FY27E | FY27E | FY26E | FY27E | FY26E | FY27E | |||||
| Coverage | ||||||||||||||
| Nanya Technology | 2408 TT | Buy | 410 | 43,054 | 7.0 | 5.0 | 3.1 | 2.2 | 39.6% | 53.0% | 4.4 | 2.8 | 7.1% | 10.3% |
| Semiconductor | ||||||||||||||
| Samsung Electronics | 005930 KS | Buy | 309,500 | 1,187,439 | 6.5 | 4.4 | 2.8 | 1.8 | 47.2% | 50.6% | 3.4 | 1.8 | 0.6% | 0.6% |
| SK Hynix | 000660 KS | Buy | 2,425,000 | 1,091,139 | 7.4 | 5.0 | 4.9 | 2.6 | 98.4% | 68.1% | 5.1 | 2.9 | 0.2% | 0.2% |
| Micron Technology | MU US | Buy | 976 | 1,101,791 | 14.2 | 6.8 | 8.7 | 4.0 | 74.3% | 72.0% | 10.5 | 4.8 | 0.1% | 0.1% |
| Average | 9.4 | 5.4 | 5.4 | 2.8 | 73.3% | 63.6% | 6.3 | 3.2 | 0.3% | 0.3% |
Source: Bloomberg, Daiwa forecasts
Note: Share price as of 3 July 2026, US company as of 2 July 2026
Nanya Technology (2408 TT): 6 July 2026
Nanya: monthly revenue and growth YoY trend
Source: Company
Nanya: 12-month forward PER band
Source: Company, Bloomberg, Daiwa forecasts
Daiwa
Financial summary
Key assumptions
| Year to 31 Dec | 2021 | 2022 | 2023 | 2024 | 2025 | 2026E | 2027E | 2028E |
|---|---|---|---|---|---|---|---|---|
| DRAM bit growth (%) | (0.5) | (27.4) | (4.3) | 0.9 | 53.8 | 30.8 | (0.8) | 5.0 |
| DRAM ASP (%) | 50.7 | (16.8) | (44.7) | 11.3 | 22.7 | 274.5 | 35.0 | (4.3) |
| Wafer capacity per month | 73.0 | 66.3 | 55.8 | 61.3 | 60 | 70 | 83.8 | 106.3 |
Profit and loss (TWDm)
| Year to 31 Dec | 2021 | 2022 | 2023 | 2024 | 2025 | 2026E | 2027E | 2028E |
|---|---|---|---|---|---|---|---|---|
| DRAM | 85,604 | 56,952 | 29,892 | 34,132 | 66,607 | 333,062 | 471,416 | 480,253 |
| Other Revenue | n.a. | n.a. | n.a. | n.a. | n.a. | n.a. | n.a. | n.a. |
| Total Revenue | 85,604 | 56,952 | 29,892 | 34,132 | 66,587 | 331,568 | 471,416 | 480,253 |
| Other income | 0 | 0 | 0 | 0 | 0 | 0 | 0 | 0 |
| COGS | (48,560) | (35,610) | (34,375) | (34,552) | (51,602) | (77,987) | (108,972) | (148,531) |
| SG&A | (2,358) | (2,498) | (2,401) | (2,449) | (2,700) | (3,052) | (2,734) | (2,829) |
| Other op.expenses | (7,500) | (7,841) | (7,576) | (7,685) | (7,041) | (6,655) | (5,536) | (4,904) |
| Operating profit | 27,186 | 11,002 | (14,460) | (10,555) | 5,243 | 243,875 | 354,173 | 323,990 |
| Net-interest inc./(exp.) | 250 | 1,346 | 3,014 | 2,974 | 1,907 | 2,171 | 2,296 | 2,282 |
| Assoc/forex/extraord./others | 331 | 4,529 | 742 | 1,103 | 337 | 676 | 727 | 741 |
| Pre-tax profit | 27,767 | 16,877 | (10,705) | (6,477) | 7,487 | 246,722 | 357,196 | 327,012 |
| Tax | (4,918) | (2,258) | 3,265 | 1,055 | 395 | (48,660) | (71,439) | (65,402) |
| Min. int./pref. div./others | 0 | 0 | 0 | 0 | 0 | 5 | 5 | 5 |
| Net profit (reported) | 22,849 | 14,619 | (7,440) | (5,422) | 7,882 | 198,062 | 285,757 | 261,610 |
| Net profit (adjusted) | 22,849 | 14,619 | (7,440) | (5,422) | 7,882 | 198,062 | 285,757 | 261,610 |
| EPS (reported)(TWD) | 7.378 | 4.720 | (2.401) | (1.750) | 2.544 | 58.907 | 82.823 | 75.824 |
| EPS (adjusted)(TWD) | 7.378 | 4.720 | (2.401) | (1.750) | 2.544 | 58.907 | 82.823 | 75.824 |
| EPS (adjusted fully-diluted)(TWD) | 7.378 | 4.720 | (2.401) | (1.750) | 2.544 | 58.907 | 82.823 | 75.824 |
| DPS (TWD) | 3.703 | 2.130 | 2.130 | 2.130 | 1.348 | 28.704 | 41.412 | 37.913 |
| EBIT | 27,186 | 11,002 | (14,460) | (10,555) | 5,243 | 243,875 | 354,173 | 323,990 |
| EBITDA | 42,480 | 26,249 | 865 | 5,589 | 19,524 | 257,781 | 370,736 | 342,298 |
Cash flow (TWDm)
| Year to 31 Dec | 2021 | 2022 | 2023 | 2024 | 2025 | 2026E | 2027E | 2028E |
|---|---|---|---|---|---|---|---|---|
| Profit before tax | 27,767 | 16,877 | (10,705) | (6,477) | 7,487 | 246,722 | 357,196 | 327,012 |
| Depreciation and amortisation | 15,294 | 15,247 | 15,326 | 16,144 | 14,281 | 13,906 | 16,563 | 18,308 |
| Tax paid | (4,918) | (2,258) | 3,265 | 1,055 | 395 | (48,660) | (71,439) | (65,402) |
| Change in working capital | 130 | (6,179) | (6,486) | (8,461) | (3,638) | (47,710) | (22,861) | 5,527 |
| Other operational CF items | 6,160 | (2,251) | (7,028) | (182) | 249 | 7,153 | (10,945) | (11,024) |
| Cash flow from operations | 44,433 | 21,436 | (5,628) | 2,079 | 18,774 | 171,411 | 268,513 | 274,421 |
| Capex | (11,260) | (20,711) | (13,245) | (16,143) | (13,446) | (52,410) | (85,083) | (95,656) |
| Net (acquisitions)/disposals | 0 | 0 | 0 | 0 | (612) | 0 | 0 | 0 |
| Other investing CF items | 5 | (511) | (8) | (172) | (257) | (100) | (109) | (109) |
| Cash flow from investing | (11,255) | (21,222) | (13,253) | (16,315) | (14,315) | (52,511) | (85,192) | (95,765) |
| Change in debt | (71) | 2,837 | 11,117 | 14,041 | (6,102) | (2,295) | 420 | 24 |
| Net share issues/(repurchases) | 1,261 | 55 | 5 | 11 | 0 | 78,718 | 0 | 0 |
| Dividends paid | (4,000) | (11,470) | (6,600) | (6,600) | 0 | (6,600) | (99,034) | (142,881) |
| Other financing CF items | (250) | (3,193) | (326) | 6,255 | (215) | (214) | (165) | (160) |
| Cash flow from financing | (3,060) | (11,771) | 4,196 | 13,707 | (6,317) | 69,610 | (98,779) | (143,017) |
| Forex effect/others | 323 | (3,190) | 38 | (697) | 214 | 236 | 225 | 231 |
| Change in cash | 30,441 | (14,748) | (14,647) | (1,226) | (1,644) | 188,746 | 84,767 | 35,870 |
| Free cash flow | 33,173 | 724 | (18,873) | (14,063) | 5,328 | 119,001 | 183,430 | 178,765 |
Source: FactSet, Daiwa forecasts
Nanya Technology (2408 TT): 6 July 2026
Daiwa
Financial summary continued …
Balance sheet (TWDm)
| Year to 31 Dec | 2021 | 2022 | 2023 | 2024 | 2025 | 2026E | 2027E | 2028E |
|---|---|---|---|---|---|---|---|---|
| Cash & short-term investment | 80,700 | 73,593 | 58,812 | 61,903 | 58,074 | 256,855 | 352,675 | 399,654 |
| Inventory | 11,611 | 23,384 | 27,634 | 35,318 | 27,288 | 23,402 | 29,429 | 40,112 |
| Accounts receivable | 11,569 | 4,359 | 5,220 | 4,132 | 16,558 | 77,164 | 109,709 | 111,766 |
| Other current assets | 2,580 | 4,175 | 4,844 | 6,593 | 6,621 | 6,328 | 6,329 | 6,336 |
| Total current assets | 106,460 | 105,512 | 96,510 | 107,946 | 108,541 | 363,748 | 498,142 | 557,868 |
| Fixed assets | 77,914 | 89,421 | 86,263 | 88,677 | 89,257 | 123,101 | 191,621 | 268,969 |
| Goodwill & intangibles | 1,014 | 767 | 927 | 688 | 531 | 872 | 832 | 792 |
| Other non-current assets | 6,034 | 6,536 | 8,650 | 9,396 | 10,124 | 7,241 | 7,241 | 7,241 |
| Total assets | 191,421 | 202,236 | 192,351 | 206,706 | 208,453 | 494,962 | 697,836 | 834,871 |
| Short-term debt | 215 | 361 | 11,574 | 21,687 | 5,517 | 433 | 383 | 339 |
| Accounts payable | 15,477 | 15,818 | 8,544 | 11,093 | 13,503 | 34,628 | 50,341 | 68,615 |
| Other current liabilities | 0 | 0 | 0 | 0 | 0 | 0 | 0 | 0 |
| Total current liabilities | 15,692 | 16,179 | 20,118 | 32,780 | 19,020 | 35,061 | 50,724 | 68,955 |
| Long-term debt | 1,510 | 4,200 | 4,104 | 8,032 | 18,101 | 20,890 | 21,359 | 21,427 |
| Other non-current liabilities | 1,242 | 898 | 1,205 | 841 | 794 | 903 | 917 | 918 |
| Total liabilities | 18,443 | 21,278 | 25,427 | 41,653 | 37,914 | 56,854 | 73,000 | 91,300 |
| Share capital | 30,973 | 30,981 | 30,981 | 30,981 | 30,981 | 34,497 | 34,497 | 34,497 |
| Reserves/R.E./others | 142,005 | 149,977 | 135,943 | 134,072 | 139,419 | 403,474 | 590,202 | 708,936 |
| Shareholders' equity | 172,978 | 180,958 | 166,924 | 165,053 | 170,400 | 437,971 | 624,699 | 743,433 |
| Minority interests | 0 | 0 | 0 | 0 | 139 | 137 | 137 | 137 |
| Total equity & liabilities | 191,421 | 202,236 | 192,351 | 206,706 | 208,453 | 494,962 | 697,836 | 834,871 |
| EV | 1,334,877 | 1,344,820 | 1,370,718 | 1,381,669 | 1,379,534 | 1,178,457 | 1,083,057 | 1,036,102 |
| Net debt/(cash) | (78,975) | (69,032) | (43,134) | (32,183) | (34,457) | (235,532) | (330,932) | (377,887) |
| BVPS (TWD) | 55.856 | 58.426 | 53.881 | 53.274 | 54.992 | 130.259 | 181.061 | 215.475 |
Key ratios (%)
| Year to 31 Dec | 2021 | 2022 | 2023 | 2024 | 2025 | 2026E | 2027E | 2028E |
|---|---|---|---|---|---|---|---|---|
| Sales (YoY) | 40.3 | (33.5) | (47.5) | 14.2 | 95.1 | 398.0 | 42.2 | 1.9 |
| EBITDA (YoY) | 85.6 | (38.2) | (96.7) | 545.8 | 249.3 | 1,220.3 | 43.8 | (7.7) |
| Operating profit (YoY) | 222.3 | (59.5) | n.a. | n.a. | n.a. | 4,551.2 | 45.2 | (8.5) |
| Net profit (YoY) | 197.3 | (36.0) | n.a. | n.a. | n.a. | 1,471.4 | 44.3 | (8.5) |
| Core EPS (fully-diluted) (YoY) | 195.0 | (36.0) | n.a. | n.a. | n.a. | 2,215.8 | 40.6 | (8.5) |
| Gross-profit margin | 43.3 | 37.5 | n.a. | n.a. | 22.5 | 76.5 | 76.9 | 69.1 |
| EBITDA margin | 49.6 | 46.1 | 2.9 | 16.4 | 29.3 | 77.7 | 78.6 | 71.3 |
| Operating-profit margin | 31.8 | 19.3 | (48.4) | (30.9) | 7.9 | 73.6 | 75.1 | 67.5 |
| Net profit margin | 26.7 | 25.7 | n.a. | n.a. | 11.8 | 59.7 | 60.6 | 54.5 |
| ROAE | 14.0 | 8.3 | n.a. | n.a. | 4.7 | 39.2 | 53.8 | 38.2 |
| ROAA | 12.8 | 7.4 | n.a. | n.a. | 3.8 | 56.3 | 47.9 | 34.1 |
| ROCE | 16.5 | 6.1 | n.a. | n.a. | 2.7 | 74.6 | 64.0 | 45.9 |
| ROIC | 22.6 | 9.3 | n.a. | n.a. | 3.8 | n.a | n.a | 96.5 |
| Net debt to equity | n.a. | n.a. | n.a. | n.a. | n.a. | n.a. | n.a. | n.a. |
| Effective tax rate | 17.7 | 13.4 | 30.5 | 16.3 | 2.9 | 1.8 | 1.7 | 1.7 |
| Accounts receivable (days) | 41.5 | 51.0 | 58.5 | 50.0 | 56.7 | 51.6 | 72.3 | 84.2 |
| Current ratio (x) | 6.8 | 6.5 | 4.8 | 3.3 | 5.7 | 10.4 | 9.8 | 8.1 |
| Net interest cover (x) | n.a. | n.a. | n.a. | n.a. | n.a. | n.a. | n.a. | n.a. |
| Net dividend payout | 50.2 | 45.1 | n.a. | n.a. | 53.0 | 48.7 | 50.0 | 50.0 |
| Free cash flow yield | 2.3 | 0.1 | n.a. | n.a. | 0.4 | 8.4 | 13.0 | 12.6 |
Source: FactSet, Daiwa forecasts
Company profile
Nanya manufactures dynamic random access memory (DRAM). Focusing on consumer DRAM market, Nanya had developed its technology through cooperation with other advanced suppliers such as Micron. Recently, as the fourth largest player in the global DRAM market, Nanya plans to apply its own process (1anm, 1bnm) developed to manufacture DRAM, targeting the mobile and server DRAM market. Nanya currently has wafer capacity of c.70k units, of which the 20nm-process accounts for 80% and is centred in Taiwan.
Nanya Technology (2408 TT): 6 July 2026
Daiwa
ESG analysis
ESG risks
| Risks | Management | Analyst comments | |
|---|---|---|---|
| G | Executive/board quality | 2 | Nanya is making an effort to ensure the quality of its board by appointing technology and accounting experts. The Board comprises 9 internal and 3 independent directors, 3 of whom are accounting experts and 6 are technology experts. Two of the directors are female and 4 directors are managerial officers of Nanya, including personnel from Nanya Plastic and Formosa. |
| G | Capital management | 1 | The company plans to increase its capex to TWD16bn for 2025 . |
| G | Related party & transaction | 1 | Nanya has no actual or proposed related-party transaction that exceeds 1% of its revenue. The company commented that the terms and pricing of sales with associates did not significantly differ from its normal selling prices. |
| S | Supply chain management | 1 | Nanya has multiple material suppliers to reduce its purchasing risk. The number of major suppliers increased to 412 in 2024 from 304 in 2020. Nanya is working with suppliers to construct a resilient and stable supply chain. |
| E | Water & wastewater management | 1 | Nanya targets to maintain its water recycling ratio at over 95% through a complete water recycling chain. In 2024, it achieved a 97% water recovery ratio (vs. 87% in 2020), thanks to its wastewater processing effort. Nanya has water supply from its backup wells (400m deep) and water tanks. It maintains 143 days of normal production at its plants with 2,000 CMD of well water. |
| E | Waste & hazardous materials management | 2 | Nanya increased its waste recycling and reuse rate to 99% in 2024 (vs. 89.6% in 2019). The company has conducted on-site audits and assists its suppliers with waste disposal. Also, Nanya reviewed 51 raw material suppliers for RoHS terms, and had a 100% rate of completion in 2024. |
| E | GHG emissions | 2 | The main sources of greenhouse gas (GHG) emissions are purchased electricity, which accounted for c.86% of Nanya's GHG emissions in 2024. Accordingly, Nanya has set a long- term goal of replacing coal-fired electricity with natural gas and implementing a green energy programme by using solar panels to reduce GHG emissions. On 7 October 2022, Science Based Targets initiative (SBTi) approved Nanya's GHG emission reduction target, ensuring its emission reduction roadmap is consistent with the Paris Agreement. With 2020 as the base year, Nanya targets a 25% reduction in GHG emissions (scope 1 and scope 2) and a 27% reduction in emissions per unit product (scope 3) by 2030. |
Note: Management score represents a company's ability to manage/benefit from certain ESG topics. The scores range from 1 to 3, with 1 being the strongest.
Update Date: 2 Jan 2026
Source: Daiwa, Company
Nanya Technology (2408 TT): 6 July 2026
Daiwa