PDF 原檔:報告_Citi_緯穎6669_20260809_original.pdf
圖片清單(已驗證 2026-08-10)
| 檔名 | size | 分類 | 親眼所見內容 |
|---|---|---|---|
報告_Citi_緯穎6669_20260809_001.png |
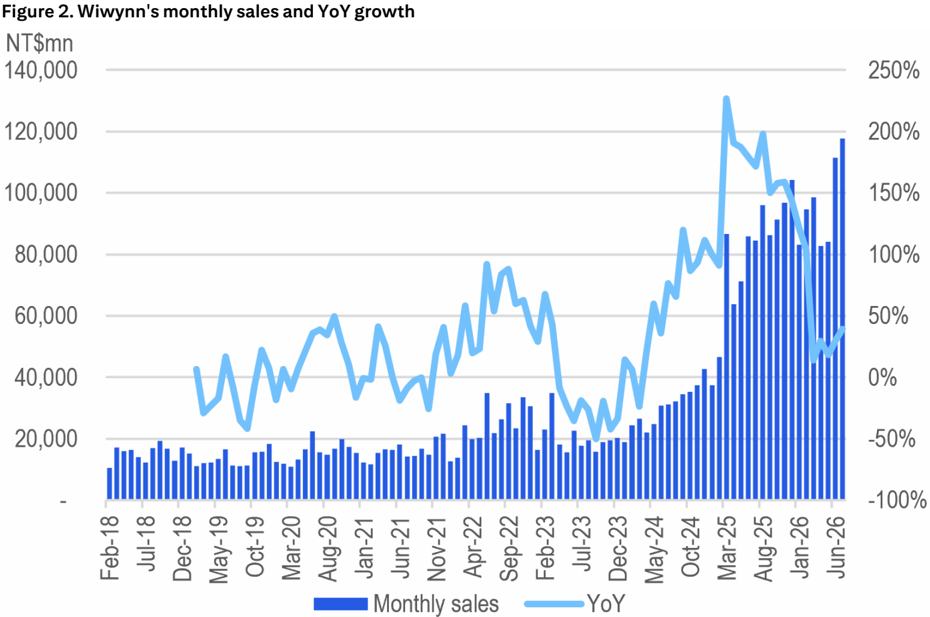
145KB | 真資料圖 | Figure 2:月營收長條圖(NT$mn,左軸)+YoY 折線(右軸),Feb-18 至 Jun-26 |
報告_Citi_緯穎6669_20260809_002.png |
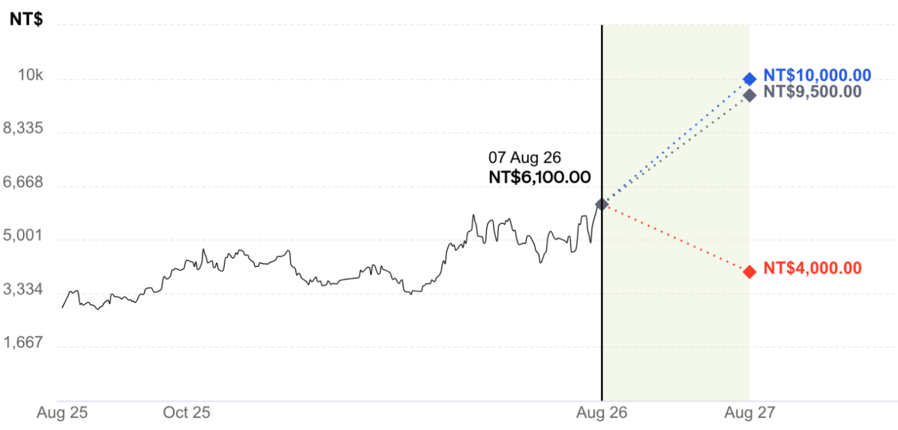
59.9KB | 真資料圖 | Bull/Bear 情境圖:股價走勢圖 + 2026-08-07 收盤 NT$6,100 為分歧點,三條情境虛線分別指向 NT$10,000(藍,未使用於本次 TP)、NT$9,500(灰,Base)、NT$4,000(紅,Bear) |
報告_Citi_緯穎6669_20260809_003.png |
269KB | 真資料圖 | 上:Ratings and Target Price History 股價走勢圖+評等/目標價/收盤價數字表格(12 筆歷史紀錄,最新一筆 2026-07-28 TP NT$9,500、收盤 NT$5,315);下:Short-Term View/Catalyst Watch Research 走勢圖+對應事件表格 |
原始內容
citivelocity.com
09 Aug 2026 17:39:48 ET │ 14 pages
Wiwynn (6669.TW)
2Q26 results beat; ASIC ramping up; Buy
CITI'S TAKE
Wiwynn reported 2Q26 results backed by robust regular server demand (sales mix 65-70%) with GM of 9.3% beating Citi/consensus forecasts of 8.3%/8.4%. The company attributed GM beat to change in accounting method (i.e., memory costs no longer recognized in Sales/COGS) and some NRE recognized. 2Q OPEX ratio posted 2.0% (+0.8ppt QoQ), likely due to rising R&D expenses for upcoming AI projects. 2Q OP levels were 8%/4% higher than Citi/consensus forecasts. Wiwynn also reported its 2026 capex of c.NT$42.4bn for its capacity expansion. Meanwhile, Wiwynn's July sales posted NT$117.7bn (+6% MoM, +39% YoY), which we believe is driven by AWS Trainium 3 server ramp. We expect this momentum to gain more traction, supporting Wiwynn's QoQ growth in 3Q/4Q26E sales. Our thesis on Wiwynn remains unchanged. We expect 1) regular server, 2) Trainium 3 and 3) AMD's Helios to come with a potential order win in Google TPU. Reiterate our Buy rating.
Buy
Price (07 Aug 26 13:30)
NT$6,100.00 NT$9,500.00
Target price
Expected share price return
55.7%
Expected dividend yield
3.3%
Expected total return Market Cap
59.0%
NT$1,133,629M US$35,150M
Jack Chen AC
+886-2-8726-9091 jack1.chen@citi.com
See Appendix A-1 for Analyst Certification, Important Disclosures and Research Analyst Affiliations
Prepared for Kevin Lu
Flash |
Figure 1. Wiwynn's <2<o results comparison
2Q26
(NT$mn)
Revenue
Gross profit
OP profit
Non-op
PBT
Tax
Minority
Net Income
EPS (NT$)
GM
OPEX ratio
OPM
Tax rate
NM
€ 2MNC Citicenun Ina Mla codictribution without Piticeoun'e writton normiccion
25,763
20,218
2Q25
Actual
220,744
18,943
15,899
1Q26
Actual
276,508
20,881
17,458
YoY
26%
36%
27%
Figure 1. Wiwynn's 2Q26 results comparison
18,974
15,720
17,934
21%
20,26
Citi
278,153
23,131
18,680
(191)
18,489
2Q26
diff Consensus
0%
281,009
11%
8%
3%
23,504
19,354
(318)
19,037
| (4,005) | (3,598) | (3,820) | (4,807) | na | ||
|---|---|---|---|---|---|---|
| - | - | - | - | na | ||
| 14,969 | 12,122 | 14,114 23% | 6% | 13,682 | 14,718 | 2% |
| 80.55 | 65.23 | 75.95 23% | 6% | 73.62 | 79.20 | 2% |
| 9.3% | 8.6% | 7.6% 0.7 ppt | 1.7 ppt | 8.3% | 8.4% | 0.9 ppt |
| -2.0% | -1.4% | -1.2% -0.6 ppt | -0.8 ppt | -1.6% -0.4 ppt | -1.5% -0.5 ppt | |
| 7.3% | 7.2% | 6.3% 0.1 ppt | 1.0 ppt | 6.7% | 6.9% 0.4 ppt | |
| 21.1% | 22.9% | 21.3% | 26.0% | na | ||
| 5.4% | 5.5% | 5.1% -0.1 ppt | 0.3 ppt | 4.9% | 5.2% | 0.1 ppt |
Prepared for Kevin Lu
Q0Q
1%
23%
16%
6%
diff
-1%
10%
4%
0%
Figure <. wiwynn's monthly sales and ror growin
NT$mn
140,000
120,000
100,000
80,000
60,000
40,000
20,000
1 2026 Citiornun Ine No radictrikution without Citiornun'e writtan normiccion
250%
200%
© 2026 Citigroup Inc. No redistribution without Citigroup's written permission.
Source: Citi Research, Company Reports
Prepared for Kevin Lu
NT$
10k
8,335
6,668
5,001
3,334
1,667
Aug 25
BULL Assumptions
• Target PE at 25x
BASE Assumptions
• Target PE at 18x
NT$ 9,500.00
4 56% Upside
NT$ 4,000.00
• 34% Downside
NT$10,000.00
NT$9,500.00
Bull/Bear: Wiwynn
BEAR Assumptions
¿j. Sales to grow by 15% in 2026/27E y-o-y with OPM at 5.0%
• Target PE at 12x
Prepared for Kevin Lu
Prepared for Kevin Lu
Prepared for Kevin Lu
Wiwynn
Valuation
Our target price for Wiwynn is NT$9,500. We value Wiwynn based on PE as we believe the company's earnings performance and industry dynamics will be the key focus areas for the market. Our TP is based on 18x 2027E EPS, which is at the top end of the historical trading range since listing and above the average PE multiple of the peer group. We believe our target multiple is justified by the company's 100% exposure to data centers, rising scale, and robust earnings growth, as well as stabilizing ROE.
Risks
Key downside risks that could cause Wiwynn's shares to trade below our target price include: 1) Potential volatility in capex deployment; 2) Component price hike; 3) Peer competition; and 4) FX volatility.
Wiwynn (6669.TW)
Analyst: Jack Chen
TWD
6,000
4,000
If you are visually impaired and would like to speak to a Citi representative regarding the details of the graphics in this document, please call USA 1-888-500-5008 (TTY: 711), from outside the US +1-210-677-3788
2024
Rating
1
2025
Date
[9 307-Nov-25 10:02:34
10 / 08-Jan-26 09:30:10
1 07-May -26 13:30:01
12) 28-Jul-26 12:55:17
Appendix A-1
Date
E2 18-Jan-24 18:10:11
1
*2,845.00
1,880.00
508-Jan-25 08:39:27