PDF 原檔:報告_Citi_穎崴6515_3Q26_20261105_original.pdf
圖片清單(已驗證 2026-11-07)
| 檔名 | size | 分類 | 親眼所見內容 |
|---|---|---|---|
報告_Citi_穎崴6515_3Q26_20261105_002.png |
11KB | 真資料圖 | Citi Figure 3:穎崴自製 spring probe 月產能(m pin/month):2024 3m、2025 3.5-4m、1H26 6m、2H26E 9m、1H27E 14m(藍色長條圖)。11KB<40KB,本批親眼驗證 |
報告_Citi_穎崴6515_3Q26_20261105_003.png |
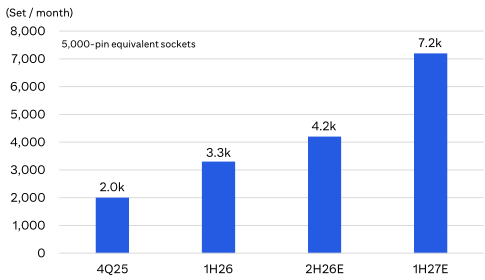
17KB | 真資料圖 | Citi Figure 4:測試座月產能(Set/month,5,000-pin 當量):4Q25 2.0k、1H26 3.3k、2H26E 4.2k、1H27E 7.2k(藍色長條圖)。17KB<40KB,本批親眼驗證;已嵌 6515_穎崴(市) |
報告_Citi_穎崴6515_3Q26_20261105_004.png |
112KB | 真資料圖 | Figure 5 WinWay 遠期 P/E band(10x/30x/50x/70x)與 Figure 6 遠期 P/B band(3x/12x/21x/30x)+Forward ROE(右軸),股價 2020-2026。屬評價圖,不嵌 lib |
報告_Citi_穎崴6515_3Q26_20261105_005.png |
98KB | 真資料圖 | Citi Bull/Base/Bear 情境圖:現價 NT$3,620,Bull NT$7,500(+107%)、Base NT$6,500(+80%)、Bear NT$3,200(-12%)。屬股價情境圖,不嵌 lib |
報告_Citi_穎崴6515_3Q26_20261105_006.png |
160KB | 真資料圖 | Citi 穎崴評等與目標價歷史(Michael Hung):TP 6,000→10,000→13,000→11,500(2026-02 至 2026-08);下半為 Short-Term View/Catalyst Watch 歷史。屬評等歷史,不嵌 lib |
_001.png(15KB)價格表現小圖,未列入;<40KB 未逐張驗證,預設裝飾/小圖,未列入。
原始內容
[讀者資訊已遮蔽] citi
05 Nov 2026 12:47:12 ET │ 14 pages
WinWay Technology (6515.TW)
Margins Recover in 3Q26; Correction Already Reflects Headwinds; Reiterate Buy
CITI'S TAKE
WinWay's 3Q26 results beat on margins and opex. GPM improved QoQ as probe card mix declined, though costs from scaling up test socket capacity remain a near-term headwind. As we previously expected, 4Q26E probe card revenue should fall as key project shipments pause, a trend already visible in Sep-26 revenue. We now model 4Q26E revenue to decline 20% QoQ, with margins bouncing on higher high-end socket mix and a customer rebate reversal. We cut 2026E-28E earnings by 6%-25% to reflect updated guidance and order uncertainty, and lower TP to NT$6,500, in line with its historical average PE since 2023. We believe the recent share price correction already reflects these headwinds. Reiterate Buy/HR.
3Q26 results beat on margins and opex - WinWay reported 3Q26 net profit of NT$1,034m (+54% QoQ/+178% YoY) beat Citi/cons forecasts by 11%/2%, driven by better-than-expected margins and opex control. GPM came in at 40.5% (+2.2ppts QoQ/-1.5ppts YoY), above Citi/cons estimates, mainly on product mix. Probe card contribution, led by MEMS, fell from 28% of total revenue in 2Q26 to 20% in 3Q26. That said, costs from the capacity expansion to scale up high-end test sockets and address the large order backlog remain a near-term headwind for margins.
Top line to soften in 4Q26 while margins set to rebound - As we previously expected, 4Q26E probe card revenue should decline as major project shipments have temporarily wrapped up. While the top line may be pressured, margins should recover gradually on mix improvement. We now model 4Q26E revenue to decline 20% QoQ, with margins seeing a short-term bounce, driven by a higher share of high-end sockets and the reversal of accrued rebates for one of its socket clients. For 2027E, we expect WinWay to keep expanding capacity to meet rising demand, and we look forward to more long-term color at the late Nov analyst meeting.
Implications - We cut our 2026E-28E earnings forecasts by 6%-25%, reflecting updated guidance and concerns over order uncertainty. We lower TP to NT$6,500 (from NT$11,500), implying 30x 2H27E-1H28E EPS (from 41x), in line with its historical average PE since 2023. That said, we believe the recent share price correction has already priced in the headwinds, offering a more attractive valuation entry point. We continue to favor WinWay as a core beneficiary of rising testing complexity for advanced chips across diverse platforms. Reiterate Buy/HR.
Earnings Summary
| Year to 31 Dec | Net Profit (NT$M) | Diluted EPS (NT$) | EPS growth (%) | P/E (x) | P/B (x) | ROE (%) | Yield (%) |
|---|---|---|---|---|---|---|---|
| 2024A | 1,186 | 34.31 | 153.7 | 105.5 | 23.5 | 26.3 | 0.3 |
| 2025A | 1,673 | 46.97 | 36.9 | 77.1 | 20.1 | 27.9 | 0.7 |
| 2026E | 3,224 | 89.59 | 90.8 | 40.4 | 12.7 | 38.1 | 1.4 |
| 2027E | 5,449 | 150.80 | 68.3 | 24.0 | 8.4 | 41.3 | 1.7 |
| 2028E | 9,996 | 276.64 | 83.5 | 13.1 | 5.2 | 47.8 | 2.9 |
Source: Powered by dataCentral
n Buy / High Risk
Price (05 Nov 26 13:30) NT$3,620.00
Target price NT$6,500.00↓
from NT$11,500.00
Expected share price return
79.6%
Expected dividend yield
1.7%
Expected total return
81.3%
Market Cap NT$131,930M US$4,014M
Price Performance (RIC: 6515.TW, BB: 6515 TT)
Michael Hung AC
+886-2-8726-9092 michael.hung@citi.com
Laura (Chia Yi) Chen +886-2-8726-9090 laura.cy.chen@citi.com
Jack Chen +886-2-8726-9091
jack1.chen@citi.com
Nicholas Lai +886-2-8726-9093 nicholas.lai@citi.com
See Appendix A-1 for Analyst Certification, Important Disclosures and Research Analyst Affiliations.
[讀者資訊已遮蔽] [讀者資訊已遮蔽]
| 6515.TW: Fiscal year - Profit & Loss (NT$m) | end 31-Dec - 2024 | 2025 | 2026E | 2027E | 2028E | Price: NT$3,620.00; TP: NT$6,500.00; Market Cap: NT$131,930m; Recomm: Buy/High Risk - Valuation ratios | Price: NT$3,620.00; TP: NT$6,500.00; Market Cap: NT$131,930m; Recomm: Buy/High Risk - 2024 | Price: NT$3,620.00; TP: NT$6,500.00; Market Cap: NT$131,930m; Recomm: Buy/High Risk - 2025 | Price: NT$3,620.00; TP: NT$6,500.00; Market Cap: NT$131,930m; Recomm: Buy/High Risk - 2026E | Price: NT$3,620.00; TP: NT$6,500.00; Market Cap: NT$131,930m; Recomm: Buy/High Risk - 2027E | Price: NT$3,620.00; TP: NT$6,500.00; Market Cap: NT$131,930m; Recomm: Buy/High Risk - 2028E |
|---|---|---|---|---|---|---|---|---|---|---|---|
| Sales revenue | 5,798 | 7,857 | 14,714 | 21,349 | 35,095 | PE (x) | na | 77.1 | 40.4 | 24.0 | 13.1 |
| Cost of sales | -3,265 | -4,301 | -8,659 | -11,911 | -18,890 | PB (x) | 23.5 | 20.1 | 12.7 | 8.4 | 5.2 |
| Gross profit | 2,534 | 3,556 | 6,055 | 9,439 | 16,205 | EV/EBITDA (x) | 85.9 | 57.7 | 31.8 | 18.2 | 9.7 |
| Gross Margin (%) | 43.7 | 45.3 | 41.1 | 44.2 | 46.2 | FCF yield (%) | 0.6 | 1.2 | 1.2 | 0.6 | 3.3 |
| EBITDA (Adj) | 1,528 | 2,256 | 4,030 | 6,988 | 12,820 | Dividend yield (%) | 0.3 | 0.7 | 1.4 | 1.7 | 2.9 |
| EBITDA Margin (Adj) (%) | 26.4 | 28.7 | 27.4 | 32.7 | 36.5 | Payout ratio (%) | 31 | 53 | 55 | 41 | 38 |
| Depreciation | -160 | -186 | -235 | -357 | -576 | ROE (%) | 26.3 | 27.9 | 38.1 | 41.3 | 47.8 |
| Amortisation | 0 | 0 | 0 | 0 | 0 | Cashflow (NT$m) | 2024 | 2025 | 2026E | 2027E | 2028E |
| EBIT (Adj) | 1,368 | 2,070 | 3,796 | 6,631 | 12,244 | EBITDA | 1,528 | 2,256 | 4,030 | 6,988 | 12,820 |
| EBIT Margin (Adj) (%) | 23.6 | 26.3 | 25.8 | 31.1 | 34.9 | Working capital | 951 | -960 | 80 | 0 | 0 |
| Net interest | 9 | 44 | 44 | 44 | 44 | Other | -1,431 | 507 | -1,504 | -3,975 | -6,251 |
| Associates | -1 | 2 | 9 | 0 | 0 | Operating cashflow | 1,049 | 1,803 | 2,606 | 3,012 | 6,569 |
| Non-Op/Except/Other Adj | 59 | -54 | 124 | 0 | 0 | Capex | -299 | -280 | -1,099 | -2,199 | -2,200 |
| Pre-tax profit | 1,435 | 2,061 | 3,973 | 6,675 | 12,288 | Net acq/disposals | 112 | -122 | -419 | 0 | 0 |
| Tax | -249 | -388 | -748 | -1,226 | -2,292 | Other | -898 | 1,124 | 0 | 0 | 0 |
| Extraord./Min.Int./Pref.div. | 0 | 0 | 0 | 0 | 0 | Investing cashflow | -1,084 | 722 | -1,518 | -2,199 | -2,200 |
| Reported net profit | 1,186 | 1,673 | 3,224 | 5,449 | 9,996 | Dividends paid | -382 | -896 | -1,802 | -2,257 | -3,814 |
| Net Margin (%) | 20.5 | 21.3 | 21.9 | 25.5 | 28.5 | Financing cashflow | 516 | -1,057 | 2,064 | 949 | 1,152 |
| Core NPAT | 1,186 | 1,673 | 3,224 | 5,449 | 9,996 | Net change in cash | 485 | 1,470 | 3,152 | 1,762 | 5,521 |
| Per share data | 2024 | 2025 | 2026E | 2027E | 2028E | Free cashflow to s/holders | 750 | 1,523 | 1,506 | 813 | 4,369 |
| Reported EPS ($) | 34.31 | 46.97 | 89.59 | 150.80 | 276.64 | ||||||
| Core EPS ($) | 34.31 | 46.97 | 89.59 | 150.80 | 276.64 | ||||||
| DPS ($) | 10.68 | 24.85 | 49.45 | 61.93 | 104.66 | ||||||
| CFPS ($) | 30.35 | 50.61 | 72.40 | 83.36 | 181.79 | ||||||
| FCFPS | 21.70 | 42.75 | 41.86 | 22.51 | 120.90 | ||||||
| ($) BVPS ($) | 154.25 | 179.95 | 283.93 | 431.63 | 702.60 | ||||||
| Wtd avg ord shares (m) | 34.6 | 35.6 | 36.0 | 36.1 | 36.1 | ||||||
| Wtd avg diluted shares (m) | 34.6 | 35.6 | 36.0 | 36.1 | 36.1 | ||||||
| Growth rates | 2024 | 2025 | 2026E | 2027E | 2028E | ||||||
| Sales revenue (%) | 57.5 | 35.5 | 87.3 | 45.1 | 64.4 | ||||||
| EBIT (Adj) (%) | 145.7 | 51.3 | 83.4 | 74.7 | 84.6 | ||||||
| Core NPAT (%) | 155.5 | 41.1 | 92.8 | 69.0 | 83.5 | ||||||
| Core EPS (%) | 153.7 | 36.9 | 90.8 | 68.3 | 83.5 | ||||||
| Balance Sheet (NT$m) | 2024 | 2025 | 2026E | 2027E | 2028E | ||||||
| Cash & cash equiv. | 1,124 | 2,594 | 5,746 | 7,508 | 13,029 | ||||||
| Accounts receivables | 1,835 | 2,151 | 1,542 | 3,955 | 6,729 | ||||||
| Inventory | 757 | 842 | 561 | 1,422 | 2,182 | ||||||
| Net fixed & other tangibles | 2,497 | 2,562 | 3,577 | 5,319 | 6,781 | ||||||
| Goodwill & intangibles | 38 | 51 | 46 | 46 | 46 | ||||||
| Financial & other assets | 1,329 | 844 | 2,787 | 6,436 | 10,627 | ||||||
| Total assets | 7,580 | 9,044 | 14,258 | 24,685 | 39,394 | ||||||
| Accounts payable | 762 | 1,099 | 656 | 1,713 | 2,646 | ||||||
| Short-term debt | 31 | 0 | 0 | 0 | 0 | ||||||
| Long-term debt | 147 | 0 | 1,241 | 2,190 | 3,342 | ||||||
| Provisions & other liab | 1,100 | 1,500 | 1,887 | 4,860 | 7,486 | ||||||
| Total liabilities | 2,040 | 2,599 | 3,784 | 8,763 | 13,475 | ||||||
| Minority interests | 5,540 | 6,445 | 10,474 0 | 0 | 25,919 | ||||||
| Shareholders' equity | 0 | 0 | 15,923 | 0 | |||||||
| Total equity | 5,540 | 6,445 | 10,474 | 15,923 | 25,919 | ||||||
| Net debt (Adj) | -946 | -2,594 | -4,504 | -5,318 | -9,687 | ||||||
| Net debt to equity (Adj) (%) | -17.1 | ||||||||||
| For definitions of the items in this | table, please click here. | -40.2 | -43.0 | -33.4 | -37.4 |
Figure 1. WinWay - 3Q26 earnings review
| (NT$mn) | 3Q26 Actual | 2Q26 Actual | Q/Q | 3Q25 Actual | Y/ Y | 3Q26 Ci t i | Di ff. | 3Q26 Cons. | Di ff. |
|---|---|---|---|---|---|---|---|---|---|
| Revenue | 4,556 | 3,523 | 29% | 1,804 | 153% | 4,404 | 3% | 4,666 | -2% |
| Gross profit | 1,848 | 1,350 | 37% | 759 | 143% | 1,760 | 5% | 1,873 | -1% |
| Gross margin | 40.5% | 38.3% | +2.2 ppt | 42.1% | -1.5 ppt | 40.0% | +0.6 ppt | 40.2% | +0.4 ppt |
| Op. profit | 1,239 | 825 | 50% | 407 | 204% | 1,125 | 10% | 1,245 | 0% |
| OP margin | 27.2% | 23.4% | +3.8 ppt | 22.6% | +4.6 ppt | 25.6% | +1.6 ppt | 26.7% | +0.5 ppt |
| Net income | 1,034 | 672 | 54% | 372 | 178% | 935 | 11% | 1,015 | 2% |
| EPS (NT$) | 28.61 | 18.70 | 53% | 10.43 | 174% | 26.00 | 10% | 27.95 | 2% |
© 2026 Citigroup Inc. No redistribution without Citigroup's written permission.
Source: Company Reports, Citi Research Estimates, Bloomberg consensus
Figure 2. WinWay - Earnings estimates revision
| (NT$mn) | 2026E - New | 2026E - Old | 2026E - Chg . | 2027E - New | 2027E - Old | 2027E - Chg . | 2028E - New | 2028E - Old | 2028E - Chg . |
|---|---|---|---|---|---|---|---|---|---|
| Sa les | 14,714 | 15,754 | -7% | 21,349 | 26,582 | -20% | 35,095 | 41,934 | -16% |
| Sequential growth | 87% | 101% | 45% | 69% | 64% | 58% | |||
| Gross profit | 6,055 | 6,358 | -5% | 9,439 | 11,637 | -19% | 16,205 | 20,179 | -20% |
| Opex | 2,259 | 2,319 | -3% | 2,807 | 2,883 | -3% | 3,961 | 4,149 | -5% |
| Operating profit | 3,796 | 4,039 | -6% | 6,631 | 8,754 | -24% | 12,244 | 16,030 | -24% |
| Pre-tax profit | 3,973 | 4,182 | -5% | 6,675 | 8,798 | -24% | 12,288 | 16,074 | -24% |
| Net income | 3,224 | 3,428 | -6% | 5,449 | 7,218 | -25% | 9,996 | 13,155 | -24% |
| EPS (NT$) | 89.59 | 95.48 | -6% | 150.80 | 200.79 | -25% | 276.64 | 365.96 | -24% |
| Gross margin | 41.1% | 40.4% | +0.8 ppt | 44.2% | 43.8% | +0.4 ppt | 46.2% | 48.1% | -1.9 ppt |
| Opex ratio | 15.4% | 14.7% | +0.6 ppt | 13.1% | 10.8% | +2.3 ppt | 11.3% | 9.9% | +1.4 ppt |
| Operating margin | 25.8% | 25.6% | +0.2 ppt | 31.1% | 32.9% | -1.9 ppt | 34.9% | 38.2% | -3.3 ppt |
| Net margin | 21.9% | 21.8% | +0.2 ppt | 25.5% | 27.2% | -1.6 ppt | 28.5% | 31.4% | -2.9 ppt |
© 2026 Citigroup Inc. No redistribution without Citigroup's written permission.
Source: Citi Research Estimates
Figure 3. WinWay - In-house spring probe capacity trend Figure 4. WinWay - Test socket capacity trend
© 2026 Citigroup Inc. No redistribution without Citigroup's written permission.
Source: Company Reports, Citi Research
© 2026 Citigroup Inc. No redistribution without Citigroup's written permission. Source: Company Reports, Citi Research [讀者資訊已遮蔽]
Figure 7. WinWay - Quarterly earnings forecast
| (NT$ in Mn, year-end Dec) | 1Q26 | 2Q26 | 3Q26 | 4Q26E | 1Q27E | 2Q27E | 3Q27E | 4Q27E | 2025 | 2026E | 2027E | 2028E |
|---|---|---|---|---|---|---|---|---|---|---|---|---|
| Net sales | 2 ,980 | 3,523 | 4,556 | 3,654 | 4,095 | 4,463 | 5 ,879 | 6,912 | 7,857 | 14,714 | 21,349 | 35,095 |
| Gross Profit | 1 ,282 | 1 ,350 | 1 ,848 | 1 ,575 | 1 ,769 | 1 ,928 | 2 ,672 | 3,069 | 3,556 | 6,055 | 9,439 | 16,205 |
| OPEX | (505) | (525) | (608) | (620) | (646) | (661) | (719) | (780) | (1,487) | (2,259) | (2,807) | (3,961) |
| Operating profit | 777 | 825 | 1 ,239 | 955 | 1 ,123 | 1 ,267 | 1 ,953 | 2 ,289 | 2 ,070 | 3,796 | 6,631 | 1 2 ,244 |
| Total Non-OP | 97 | 22 | 43 | 15 | 8 | 13 | 9 | 15 | (8) | 177 | 44 | 44 |
| Pre-tax profit | 874 | 848 | 1,282 | 969 | 1,130 | 1,280 | 1,961 | 2,303 | 2,061 | 3,973 | 6,675 | 12,288 |
| Income tax | (175) | (175) | (248) | (149) | (227) | (265) | (380) | (355) | (388) | (748) | (1,226) | (2,292) |
| Net Profit | 699 | 672 | 1 ,034 | 820 | 903 | 1 ,015 | 1 ,582 | 1 ,949 | 1 ,673 | 3,224 | 5 ,449 | 9,996 |
| EPS (NT$) | 19.54 | 1 8 . 70 | 28.61 | 22 .69 | 25 .00 | 28. 10 | 43. 77 | 53.92 | 46 . 97 | 89.59 | 150.80 | 276.64 |
| Revenue mix | ||||||||||||
| Test & Burn-in socket | 65% | 64% | 72% | 84% | 86% | 80% | 75% | 76% | 56% | 72% | 79% | 78% |
| Coaxial socket | 47% | 50% | 60% | 69% | 74% | 68% | 64% | 65% | 43% | 57% | 67% | 70% |
| RF & Plastic socket | 17% | 12% | 11% | 14% | 12% | 11% | 8% | 7% | 9% | 13% | 9% | 5% |
| Burn-in socket | 1% | 2% | 1% | 1% | 1% | 2% | 3% | 4% | 4% | 1% | 3% | 3% |
| Contact element | 7% | 6% | 5% | 6% | 6% | 5% | 4% | 4% | 1 0% | 6% | 5% | 3% |
| Probe card | 26% | 28% | 20% | 6% | 5% | 12% | 18% | 19% | 29% | 20% | 15% | 18% |
| Ot he rs | 3% | 2% | 3% | 3% | 3% | 3% | 2% | 2% | 4% | 3% | 2% | 1% |
| Margins (%) | ||||||||||||
| Gross profit | 43.0% | 38.3% | 40.5% | 43.1% | 43.2% | 43.2% | 45.5% | 44.4% | 45.3% | 41.1% | 44.2% | 46.2% |
| OPEX to sales | 16.9% | 14.9% | 13.4% | 17.0% | 15.8% | 14.8% | 12.2% | 11.3% | 18.9% | 15.4% | 13.1% | 11.3% |
| Operating Margin | 26.1% | 23.4% | 27.2% | 26.1% | 27.4% | 28.4% | 33.2% | 33.1% | 26.3% | 25.8% | 31.1% | 34.9% |
| Pre-tax profit | 29.3% | 24.1% | 28.1% | 26.5% | 27.6% | 28.7% | 33.4% | 33.3% | 26.2% | 27.0% | 31.3% | 35.0% |
| Net Margin | 23.4% | 19.1% | 22.7% | 22.4% | 22.1% | 22.8% | 26.9% | 28.2% | 21.3% | 21.9% | 25.5% | 28.5% |
| Y/ Y | ||||||||||||
| Net sales | 29.7% | 131.4% | 152.6% | 63.6% | 37.4% | 26.7% | 29.0% | 89.2% | 35.5% | 87.3% | 45.1% | 64.4% |
| Gross profit | 14.4% | 81.1% | 143.4% | 69.1% | 38.0% | 42.8% | 44.6% | 94.9% | 31.7% | 101.4% | 37.5% | 58.6% |
| Operating profit | 6.8% | 79.4% | 204.2% | 101.1% | 44.6% | 53.5% | 57.6% | 139.8% | 51.3% | 83.4% | 74.7% | 84.6% |
| Pre-tax profit | 14.2% | 219.9% | 179.2% | 69.6% | 29.3% | 51.0% | 53.0% | 137.7% | 43.7% | 92.7% | 68.0% | 84.1% |
| Net Margin | 14.0% | 228.0% | 178.1% | 69.6% | 29.3% | 51.0% | 53.0% | 137.7% | 41.1% | 92.8% | 69.0% | 83.5% |
| Q/Q | ||||||||||||
| Net sales | 33.4% | 18.2% | 29.3% | -19.8% | 12.1% | 9.0% | 31.7% | 17.6% | ||||
| Gross profit | 37.6% | 5.4% | 36.8% | -14.7% | 12.3% | 9.0% | 38.6% | 14.9% | ||||
| Operating profit | 63.6% | 6.2% | 50.2% | -23.0% | 17.6% | 12.8% | 54.1% | 17.2% | ||||
| Pre-tax profit | 52.9% | -3.0% | 51.2% | -24.4% | 16.6% | 13.3% | 53.2% | 17.5% | ||||
| Net Margin | 44.5% | -3.8% | 53.8% | -20.7% | 10.2% | 12.4% | 55.8% | 23.2% |
© 2026 Citigroup Inc. No redistribution without Citigroup's written permission.
Source: Company Reports, Citi Research Estimates, TEJ
[讀者資訊已遮蔽]
Bull/Bear: WinWay Technology (6515.TW)
Spread 119pp
Current Price and expected returns (upside/downside) as of 05 Nov 2026
BULL Assumptions
- Accelerated test socket revenue growth of +180% in 2026E, driven by rapid adoption of 224G coaxial sockets and higherthan-expected SLT station deployments for the next-gen AI GPU/ASIC architecture.
- Target PE multiple of 35x
BASE Assumptions
- Test socket revenue growth of +148% in 2026E, supported by steady transition to next-gen Al GPU platform and the 4-5x volume multiplier in the SLT market.
- Target PE multiple of 30x
BEAR Assumptions
- Weaker-than-expected test socket revenue growth of +60% in 2026E, due to potential delays in next-gen GPU roadmaps or intensified competition in the high-frequency socket segment.
- Target PE multiple of 15x
[讀者資訊已遮蔽]
WinWay Technology
Company description
WinWay, founded in 2001, is a global leader in semiconductor test interfaces and the world's largest test socket supplier. Originally specializing in highspeed solutions for IC design and OSAT firms, WinWay now dominates the AI and HPC sectors. The company provides a comprehensive portfolio including coaxial sockets, burn-in sockets, probe cards (MEMS & VPC), and advanced thermal management systems. Its flagship hypersocket technology and vertically integrated manufacturing enable high-performance validation for next-generation accelerators. WinWay's diverse solutions support missioncritical applications across global AI infrastructure, networking, and highspeed computing.
Investment strategy
We rate WinWay at Buy/High Risk (1H). We believe WinWay is well positioned for the AI infrastructure cycle, with dominance in the US AI GPU testing supply chain and participation in US CSP AI ASIC projects. Its leading proprietary coaxial socket and hypersocket technologies should provide a defensible technical moat as 224G SerDes and extreme package complexities expand. The company captures a wider share of the test interface market through its premium sockets and high-quality service, providing a multilayered earnings engine supported by structural growth in AI testing intensity.
Valuation
We value WinWay using a PE-based approach that factors in earnings momentum and likely expansion of its addressable market. Our target price of NT$6,500 is derived from applying c.30x to 2H27E-1H28E EPS, in line with its historical average PE since 2023, which we believe is justified given the company's entrenched position in the high-end AI GPU testing supply chain, rising contribution from coaxial socket and SLT solutions, and the increasing value of test content per module. With these structural drivers in place, and as we believe the market is starting to value it as an AI/HPC play (rather than a consumer electronics stock), we expect the multiple to hold at a premium relative to its historical averages.
Risks
Our quant rating system rates the WinWay stock High Risk based on its historical volatility.
Key downside risks that could impede the stock from reaching our target price and our earnings forecasts include: 1) client and sector concentration - specifically any delays in US AI GPU product roadmap could impact the business outlook for WinWay; 2) intensifying competition in coaxial and hypersockets from global peers; 3) faster-than-expected testing algorithm optimization, which could shorten testing durations and reduce the anticipated hardware demand multiplier; and 4) delay of MEMS Phase 2 mass production.
[讀者資訊已遮蔽] If you are visually impaired and would like to speak to a Citi representative regarding the details of the graphics in this document, please call USA 1-888-500-5008 (TTY: 711), from outside the US +1-210-677-3788