PDF 原檔:報告_Citi_穎崴6515_20260806_original.pdf
圖片清單(已驗證 2026-08-07)
| 檔名 | size | 分類 | 親眼所見內容 |
|---|---|---|---|
報告_Citi_穎崴6515_20260806_002.png |
166KB | 真資料圖 | 兩張圖:(1) WinWay 季度銷售趨勢(1Q21-2Q26,柱狀圖+QoQ/YoY 折線),(2) WinWay 月度銷售趨勢(Jan-24 至 Jul-26) |
報告_Citi_穎崴6515_20260806_004.png |
50KB | 真資料圖 | WinWay 12M Forward P/E band 圖(Jan-20 至 Jan-26,10x/30x/50x/70x 區間線) |
報告_Citi_穎崴6515_20260806_006.png |
60KB | 真資料圖 | WinWay Forward P/B band 圖(含 Forward ROE 虛線,3x/12x/21x/30x 區間線) |
報告_Citi_穎崴6515_20260806_007.png |
69KB | 真資料圖 | Bull/Bear 目標價圖:Bull NT$15,000、Base NT$11,500、Bear NT$5,500,標示 06 Aug 26 股價 NT$6,775 |
報告_Citi_穎崴6515_20260806_008.png |
165KB | 真資料圖 | 兩張圖:(1) 評等與目標價沿革圖,3 個標記點(6,000→10,000→13,000,2026/02-2026/05),(2) Short-Term View/Catalyst Watch 沿革圖 |
報告_Citi_穎崴6515_20260806_001.png |
17KB | 未驗證(<40KB,預設 logo) | — |
報告_Citi_穎崴6515_20260806_003.png |
14KB | 未驗證(<40KB,預設 logo) | — |
報告_Citi_穎崴6515_20260806_005.png |
20KB | 未驗證(<40KB,預設 logo) | — |
原始內容
(RIC: 6515.1W, BB: 6515 11)
TWD
10,000
8,000
6,000
4,000
2,000
Prepared for Kevin Lu
06 Aug 2026 12:43:24 ET │ 16 pages
Sep
Dec
Mar
Jun
WinWay Technology (6515.TW)
2Q26 Margin Miss Weighs, but Correction Already Reflects Headwinds; Cut TP; Reiterate Buy
CITI'S TAKE
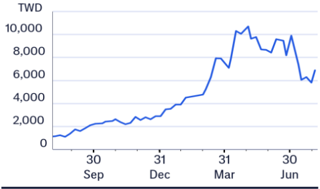
WinWay's 2Q26 results missed on margins, with net profit coming in below Citi/cons forecasts. GPM weakness reflected an unfavorable product mix, alongside costs from scaling up new test socket capacity to meet robust backlog. While contract-based pricing limits near-term pass-through on existing projects, we expect scale effects to support recovery as capacity ramps: Jul-26 revs reached another record high. We trim 2026E/27E earnings by 4%/7% and cut our TP to NT$11,500 (from NT$13,000; 41x vs. 45x 2H27-1H28E EPS) to reflect margin headwinds. We believe the recent share price correction (c.-16% since Jul vs. TAIEX at c.-4%) already reflects these headwinds, offering a more attractive entry point. Reiterate Buy.
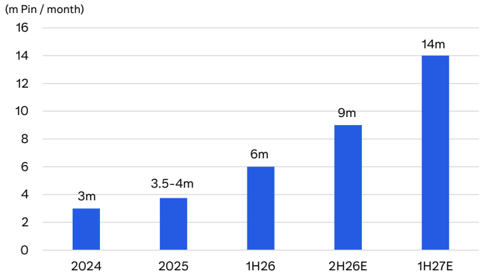
2Q26 results missed on margins -WinWay reported 2Q26 net profit of NT$672m (-4% QoQ/+228% YoY), missing Citi/cons forecasts by 16%/11%, driven primarily by weaker-than-expected margins. GPM came in at 38.3% (-4.7ppts QoQ/-10.6ppts YoY), below cons estimates, reflecting unfavorable mix (probe card contribution at 28% of revs), alongside costs associated with scaling up new capacity for AI/HPC test sockets to keep pace with a substantial order backlog. We believe WinWay's capacity expansion roadmap will continue to weigh on margins over the near term.
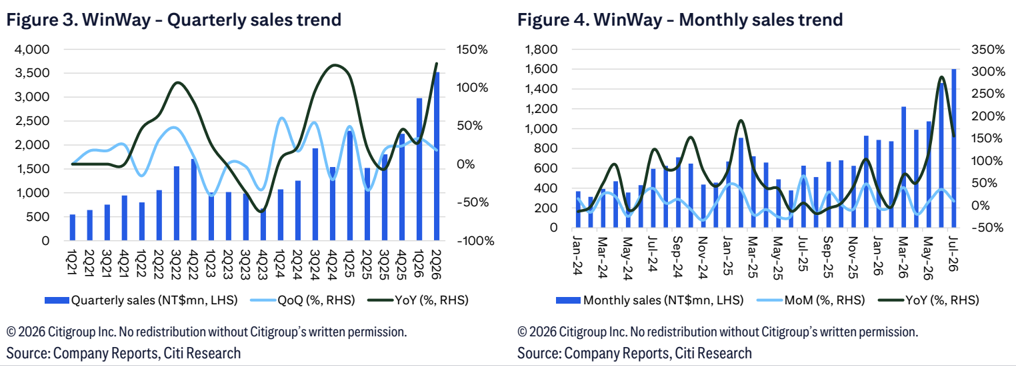
Growth trajectory remains intact despite margin pressure -As WinWay's projects and products are highly customized, it remains difficult to pass through pricing increases on existing programs to key customers under contract-based term. However, we expect rev to benefit from scale effects as new capacity comes online. We now model 3Q26 revenue to grow 25% QoQ, with margins seeing a mild recovery. WinWay reported Jul-26 rev of NT$1.6bn (+10% MoM/+156% YoY), driven by continued AI/HPC demand alongside capacity ramp-up. Sustained AI GPU/server CPU shipments and AI ASIC project ramp-up will support 2H26 growth.
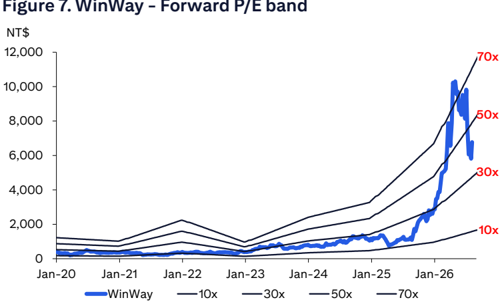
Implications -We cut 2026E/27E earnings forecasts by 4%/7% and slightly tweak 2028E estimates, reflecting updated guidance and margin assumptions. We lower TP to NT$11,500 (from NT$13,000), implying 41x 2H27E-1H28E EPS (from 45x), reflecting near-term margin pressure. That said, we believe the recent share correction has already priced in the headwinds, offering a more attractive valuation entry point. We continue to favor WinWay as a core beneficiary of rising testing complexity for advanced chips across diverse platforms. Reiterate Buy.
Earnings Summary
| Year to 31Dec | Net Profit (NT$M) | DilutedEPS (NT$) | EPSgrowth (%) | P/E (x) | P/B (x) | ROE (%) | Yield (%) |
|---|---|---|---|---|---|---|---|
| 2024A | 1,186 | 34.31 | 153.7 | 197.5 | 43.9 | 26.3 | 0.2 |
| 2025A | 1,673 | 46.97 | 36.9 | 144.3 | 37.6 | 27.9 | 0.4 |
| 2026E | 3,428 | 95.48 | 103.3 | 71 | 26.9 | 43.7 | 0.7 |
| 2027E | 7,218 | 200.79 | 110.3 | 33.7 | 15.1 | 56.2 | 1 |
| 2028E | 13,155 | 365.96 | 82.3 | 18.5 | 8.4 | 57.1 | 2.1 |
Source: Powered by dataCentral
n Buy / High Risk
Catalyst Watch: Upside, expires 25-AUG-26
Price (06 Aug 26 13:30)
NT$6,775.00
Target price
NT$11,500.00↓
from NT$13,000.00
Expected share price
return
69.7%
Expected dividend yield
1.0%
Expected total return
70.7%
Market Cap
NT$244,158M US$7,564M
Price Performance (RIC: 6515.TW, BB: 6515 TT)
Michael Hung AC
+886-2-8726-9092 michael.hung@citi.com
Laura (Chia Yi) Chen +886-2-8726-9090
laura.cy.chen@citi.com
Jack Chen +886-2-8726-9091
jack1.chen@citi.com
Nicholas Lai
+886-2-8726-9093
nicholas.lai@citi.com
See Appendix A-1 for Analyst Certification, Important Disclosures and Research Analyst Affiliations.
Prepared for Kevin Lu
| 6515.TW: Fiscalyearend31-Dec | Price: NT$6,775.00; TP: NT$11,500.00; Market Cap:NT$244,158m; Recomm:Buy/HighRisk | Price: NT$6,775.00; TP: NT$11,500.00; Market Cap:NT$244,158m; Recomm:Buy/HighRisk | Price: NT$6,775.00; TP: NT$11,500.00; Market Cap:NT$244,158m; Recomm:Buy/HighRisk | Price: NT$6,775.00; TP: NT$11,500.00; Market Cap:NT$244,158m; Recomm:Buy/HighRisk | Price: NT$6,775.00; TP: NT$11,500.00; Market Cap:NT$244,158m; Recomm:Buy/HighRisk | Price: NT$6,775.00; TP: NT$11,500.00; Market Cap:NT$244,158m; Recomm:Buy/HighRisk | |||||
|---|---|---|---|---|---|---|---|---|---|---|---|
| Profit&Loss(NT$m) | 2024 | 2025 | 2026E | 2027E | 2028E | Valuation ratios | 2024 | 2025 | 2026E | 2027E | 2028E |
| Sales revenue | 5,798 | 7,857 | 15,754 | 26,582 | 41,934 | PE(x) | na | na | 71.0 | 33.7 | 18.5 |
| Cost of sales | -3,265 | -4,301 | -9,396 | -14,945 | -21,756 | PB(x) | 43.9 | 37.6 | 26.9 | 15.1 | 8.4 |
| Gross profit | 2,534 | 3,556 | 6,358 | 11,637 | 20,179 | EV/EBITDA(x) | na | na | 56.5 | 26.3 | 14.1 |
| Gross Margin (%) | 43.7 | 45.3 | 40.4 | 43.8 | 48.1 | FCFyield (%) | 0.3 | 0.6 | 0.7 | 0.8 | 3.2 |
| EBITDA(Adj) | 1,528 | 2,256 | 4,270 | 9,111 | 16,606 | Dividend yield (%) | 0.2 | 0.4 | 0.7 | 1.0 | 2.1 |
| EBITDAMargin(Adj) (%) | 26.4 | 28.7 | 27.1 | 34.3 | 39.6 | Payout ratio (%) | 31 | 53 | 52 | 33 | 38 |
| Depreciation | -160 | -186 | -231 | -357 | -576 | ROE(%) | 26.3 | 27.9 | 43.7 | 56.2 | 57.1 |
| Amortisation | 0 | 0 | 0 | 0 | 0 | Cashflow(NT$m) | 2024 | 2025 | 2026E | 2027E | 2028E |
| EBIT (Adj) | 1,368 | 2,070 | 4,039 | 8,754 | 16,030 | EBITDA | 1,528 | 2,256 | 4,270 | 9,111 | 16,606 |
| EBIT Margin (Adj) (%) | 23.6 | 26.3 | 25.6 | 32.9 | 38.2 | Working capital | 951 | -960 | 189 | 0 | 0 |
| Net interest | 9 | 44 | 44 | 44 | 44 | Other | -1,431 | 507 | -1,561 | -4,859 | -6,683 |
| Associates | -1 | 2 | 20 | 0 | 0 | Operating cashflow | 1,049 | 1,803 | 2,899 | 4,251 | 9,923 |
| Non-Op/Except/Other Adj | 59 | -54 | 79 | 0 | 0 | Capex | -299 | -280 | -1,099 | -2,199 | -2,200 |
| Pre-tax profit | 1,435 | 2,061 | 4,182 | 8,798 | 16,074 | Net acq/disposals | 112 | -122 | -316 | 0 | 0 |
| Tax | -249 | -388 | -755 | -1,580 | -2,919 | Other | -898 | 1,124 | 0 | 0 | 0 |
| Extraord./Min.Int./Pref.div. | 0 | 0 | 0 | 0 | 0 | Investing cashflow | -1,084 | 722 | -1,416 | -2,199 | -2,200 |
| Reported net profit | 1,186 | 1,673 | 3,428 | 7,218 | 13,155 | Dividends paid | -382 | -896 | -1,802 | -2,399 | -5,053 |
| Net Margin (%) | 20.5 | 21.3 | 21.8 | 27.2 | 31.4 | Financing cashflow | 516 | -1,057 | 2,022 | 2,343 | 2,464 |
| CoreNPAT | 1,186 | 1,673 | 3,428 | 7,218 | 13,155 | Net change in cash | 485 | 1,470 | 3,505 | 4,396 | 10,187 |
| Per share data | 2024 | 2025 | 2026E | 2027E | 2028E | Free cashflow to s/holders | 750 | 1,523 | 1,799 | 2,053 | 7,723 |
| Reported EPS($) | 34.31 | 46.97 | 95.48 | 200.79 | 365.96 | ||||||
| Core EPS($) | 34.31 | 46.97 | 95.48 | 200.79 | 365.96 | ||||||
| DPS($) | 10.68 | 24.85 | 50.00 | 66.58 | 140.20 | ||||||
| CFPS($) | 30.35 | 50.61 | 80.74 | 118.27 | 276.04 | ||||||
| FCFPS($) | 21.70 | 42.75 | 50.12 | 57.10 | 214.84 | ||||||
| BVPS($) | 154.25 | 179.95 | 252.19 | 449.49 | 809.09 | ||||||
| Wtdavgordshares(m) | 34.6 | 35.6 | 35.9 | 35.9 | 35.9 | ||||||
| Wtdavgdiluted shares (m) | 34.6 | 35.6 | 35.9 | 35.9 | 35.9 | ||||||
| Growthrates | 2024 | 2025 | 2026E | 2027E | 2028E | ||||||
| Sales revenue (%) | 57.5 | 35.5 | 100.5 | 68.7 | 57.8 | ||||||
| EBIT (Adj) (%) | 145.7 | 51.3 | 95.2 | 116.7 | 83.1 | ||||||
| CoreNPAT(%) | 155.5 | 41.1 | 104.9 | 110.6 | 82.3 | ||||||
| CoreEPS(%) | 153.7 | 36.9 | 103.3 | 110.3 | 82.3 | ||||||
| BalanceSheet(NT$m) | 2024 | 2025 | 2026E | 2027E | 2028E | ||||||
| Cash&cashequiv. | 1,124 | 2,594 | 6,099 | 10,494 | 20,682 | ||||||
| Accounts receivables | 1,835 | 2,151 | 3,844 | 7,048 | 10,442 | ||||||
| Inventory | 757 | 842 | 1,618 | 2,587 | 3,498 | ||||||
| Net fixed &other | 2,497 | 2,562 | 3,425 | 5,167 | 6,629 | ||||||
| tangibles Goodwill &intangibles | 38 | 51 | 48 | 48 | 48 | ||||||
| Financial &other assets | 1,329 | 844 | 2,573 | 5,708 | 9,029 | ||||||
| Total assets | 7,580 | 9,044 | 17,607 | 31,051 | 50,327 | ||||||
| Accounts payable | 762 | 1,099 | 2,092 | 3,332 | 4,499 | ||||||
| Short-term debt | 31 | 0 | 0 | 0 | 0 | ||||||
| Long-term debt | 147 | 0 | 2,663 | 5,006 | 7,470 | ||||||
| Provisions &other liab | 1,100 | 1,500 | 3,625 | 6,270 | 8,759 | ||||||
| Total liabilities | 2,040 | 2,599 | 8,381 | 14,608 | 20,728 | ||||||
| Minority interests | 5,540 0 | 0 | 0 | 29,599 | |||||||
| Shareholders' equity | 6,445 0 | 9,226 | 16,444 | 0 | |||||||
| Total equity | 5,540 | 6,445 | 9,226 | 16,444 | 29,599 | ||||||
| Net debt (Adj) | -946 | -2,594 | -3,435 | -5,488 | -13,211 | ||||||
| Net debt to equity (Adj) (%) | -17.1 | ||||||||||
| For definitions of the items in this | please click here. | -40.2 | -37.2 | -33.4 | -44.6 |
Prepared for Kevin Lu
Figure 1. WinWay - 2Q26 earnings review
| (NT$mn) | 2Q26 Actual | 1Q26 Actual | Q/Q | 2Q25 Actual | Y/Y | 2Q26 Citi | Diff. | 2Q26 Cons. | Diff. |
|---|---|---|---|---|---|---|---|---|---|
| Revenue | 3,523 | 2,980 | 18% | 1,522 | 131% | 3,461 | 2% | 3,405 | 3% |
| Gross profit | 1,350 | 1,282 | 5% | 746 | 81% | 1,509 | -11% | 1,454 | -7% |
| Gross margin | 38.3% | 43.0% | -4.7 ppt | 49.0% | -10.6ppt | 43.6% | -5.3 ppt | 42.7% | -4.4 ppt |
| Op. profit | 825 | 777 | 6% | 460 | 79% | 953 | -13% | 914 | -10% |
| OPmargin | 23.4% | 26.1% | -2.6ppt | 30.2% | -6.8 ppt | 27.5% | -4.1 ppt | 26.8% | -3.4 ppt |
| Net income | 672 | 699 | -4% | 205 | 228% | 796 | -16% | 757 | -11% |
| EPS(NT$) | 18.70 | 19.54 | -4% | 5.76 | 225% | 22.26 | -16% | 20.62 | -9% |
© 2026 Citigroup Inc. No redistribution without Citigroup's written permission.
Source: Company Reports, Citi Research Estimates, TEJ
Figure 2. WinWay - Earnings estimates revision
| 2026E | 2026E | 2026E | 2027E | 2027E | 2027E | 2028E | 2028E | 2028E | |
|---|---|---|---|---|---|---|---|---|---|
| (NT$mn) | New | Old | Chg. | New | Old | Chg. | New | Old | Chg. |
| Sales | 15,754 | 14,569 | 8% | 26,582 | 25,835 | 3% | 41,934 | 40,828 | 3% |
| Sequential growth | 101% | 85% | 69% | 77% | 58% | 58% | |||
| Gross profit | 6,358 | 6,555 | -3% | 11,637 | 12,651 | -8% | 20,179 | 20,765 | -3% |
| Opex | 2,319 | 2,357 | -2% | 2,883 | 3,331 | -13% | 4,149 | 4,987 | -17% |
| Operating profit | 4,039 | 4,198 | -4% | 8,754 | 9,320 | -6% | 16,030 | 15,778 | 2% |
| Pre-tax profit | 4,182 | 4,332 | -3% | 8,798 | 9,364 | -6% | 16,074 | 15,822 | 2% |
| Net income | 3,428 | 3,576 | -4% | 7,218 | 7,741 | -7% | 13,155 | 13,059 | 1% |
| EPS (NT$) | 95.48 | 100.04 | -5% | 200.79 | 216.54 | -7% | 365.96 | 365.29 | 0% |
| Gross margin | 40.4% | 45.0% | -4.6ppt | 43.8% | 49.0% | -5.2 ppt | 48.1% | 50.9% | -2.7 ppt |
| Opex ratio | 14.7% | 16.2% | -1.5 ppt | 10.8% | 12.9% | -2.0 ppt | 9.9% | 12.2% | -2.3 ppt |
| Operating margin | 25.6% | 28.8% | -3.2 ppt | 32.9% | 36.1% | -3.1 ppt | 38.2% | 38.6% | -0.4 ppt |
| Net margin | 21.8% | 24.5% | -2.8 ppt | 27.2% | 30.0% | -2.8 ppt | 31.4% | 32.0% | -0.6ppt |
© 2026 Citigroup Inc. No redistribution without Citigroup's written permission.
Source: Citi Research Estimates
Prepared for Kevin Lu
Figure 5. WinWay - In-house spring probe capacity trend
© 2026 Citigroup Inc. No redistribution without Citigroup's written permission. Source: Company Reports, Citi Research
© 2026 Citigroup Inc. No redistribution without Citigroup's written permission. Source: Company Reports, Citi Research Estimates, TEJ
Figure 6. WinWay - Test socket capacity trend
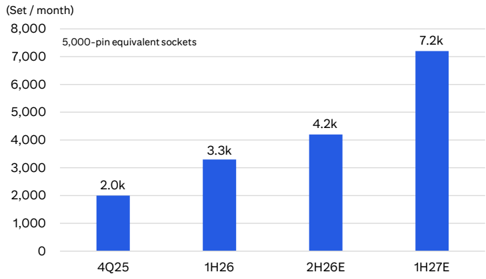
© 2026 Citigroup Inc. No redistribution without Citigroup's written permission. Source: Company Reports, Citi Research
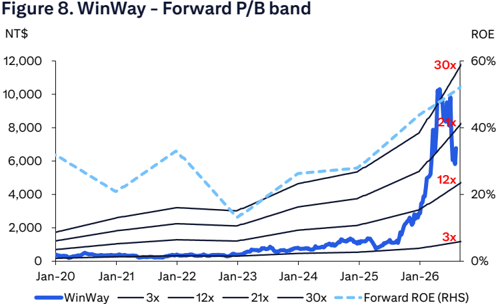
© 2026 Citigroup Inc. No redistribution without Citigroup's written permission. Source: Company Reports, Citi Research Estimates, TEJ
Prepared for Kevin Lu
Figure 9. WinWay - Quarterly earnings forecast
| (NT$in Mn, year-end Dec) | 1Q26 | 2Q26 | 3Q26E | 4Q26E | 1Q27E | 2Q27E | 3Q27E | 4Q27E | 2025 | 2026E | 2027E | 2028E |
|---|---|---|---|---|---|---|---|---|---|---|---|---|
| Net sales | 2,980 | 3,523 | 4,404 | 4,846 | 5,318 | 6,040 | 7,042 | 8,183 | 7,857 | 15,754 | 26,582 | 41,934 |
| Gross Profit | 1,282 | 1,350 | 1,760 | 1,965 | 2,217 | 2,556 | 3,114 | 3,750 | 3,556 | 6,358 | 11,637 | 20,179 |
| OPEX | (505) | (525) | (635) | (654) | (653) | (685) | (736) | (809) | (1,487) | (2,319) | (2,883) | (4,149) |
| Operating profit | 777 | 825 | 1,125 | 1,312 | 1,564 | 1,872 | 2,378 | 2,941 | 2,070 | 4,039 | 8,754 | 16,030 |
| Total Non-OP | 97 | 22 | 9 | 15 | 8 | 13 | 9 | 15 | (8) | 143 | 44 | 44 |
| Pre-tax profit | 874 | 848 | 1,134 | 1,326 | 1,571 | 1,885 | 2,386 | 2,955 | 2,061 | 4,182 | 8,798 | 16,074 |
| Income tax | (175) | (175) | (199) | (204) | (316) | (390) | (419) | (455) | (388) | (755) | (1,580) | (2,919) |
| Net Profit | 699 | 672 | 935 | 1,122 | 1,256 | 1,495 | 1,967 | 2,500 | 1,673 | 3,428 | 7,218 | 13,155 |
| EPS (NT$) | 19.54 | 18.70 | 26.00 | 31.21 | 34.94 | 41.58 | 54.72 | 69.55 | 46.97 | 95.48 | 200.79 | 365.96 |
| Revenue mix | ||||||||||||
| Test & Burn-in socket | 65% | 64% | 66% | 64% | 67% | 68% | 70% | 75% | 56% | 65% | 70% | 77% |
| Coaxial socket | 47% | 50% | 56% | 56% | 59% | 59% | 64% | 69% | 43% | 53% | 63% | 72% |
| RF&Plastic socket | 17% | 12% | 8% | 6% | 7% | 7% | 6% | 5% | 9% | 10% | 6% | 4% |
| Burn-in socket | 1% | 2% | 2% | 1% | 1% | 1% | 1% | 1% | 4% | 2% | 1% | 1% |
| Contact element | 7% | 6% | 6% | 5% | 5% | 5% | 5% | 4% | 10% | 6% | 5% | 4% |
| Probe card | 26% | 28% | 27% | 29% | 27% | 26% | 23% | 20% | 29% | 28% | 24% | 19% |
| Others | 3% | 2% | 2% | 1% | 1% | 1% | 1% | 1% | 4% | 2% | 1% | 1% |
| Margins (%) | ||||||||||||
| Gross profit | 43.0% | 38.3% | 40.0% | 40.6% | 41.7% | 42.3% | 44.2% | 45.8% | 45.3% | 40.4% | 43.8% | 48.1% |
| OPEXtosales | 16.9% | 14.9% | 14.4% | 13.5% | 12.3% | 11.3% | 10.4% | 9.9% | 18.9% | 14.7% | 10.8% | 9.9% |
| Operating Margin | 26.1% | 23.4% | 25.6% | 27.1% | 29.4% | 31.0% | 33.8% | 35.9% | 26.3% | 25.6% | 32.9% | 38.2% |
| Pre-tax profit | 29.3% | 24.1% | 25.7% | 27.4% | 29.6% | 31.2% | 33.9% | 36.1% | 26.2% | 26.5% | 33.1% | 38.3% |
| Net Margin | 23.4% | 19.1% | 21.2% | 23.2% | 23.6% | 24.7% | 27.9% | 30.6% | 21.3% | 21.8% | 27.2% | 31.4% |
| Y/Y | ||||||||||||
| Net sales | 29.7% | 131.4% | 144.1% | 117.0% | 78.4% | 71.4% | 59.9% | 68.9% | 35.5% | 100.5% | 68.7% | 57.8% |
| Gross profit | 14.4% | 81.1% | 131.9% | 111.0% | 73.0% | 89.3% | 76.9% | 90.8% | 31.7% | 118.5% | 59.1% | 45.6% |
| Operating profit | 6.8% | 79.4% | 176.3% | 176.4% | 101.4% | 126.8% | 111.3% | 124.2% | 51.3% | 95.2% | 116.7% | 83.1% |
| Pre-tax profit | 14.2% | 219.9% | 146.9% | 132.1% | 79.8% | 122.4% | 110.4% | 122.8% | 43.7% | 102.9% | 110.4% | 82.7% |
| Net Margin | 14.0% | 228.0% | 151.4% | 132.2% | 79.8% | 122.4% | 110.4% | 122.8% | 41.1% | 104.9% | 110.6% | 82.3% |
| Q/Q | ||||||||||||
| Net sales | 33.4% | 18.2% | 25.0% | 10.0% | 10% | 14% | 17% | 16% | ||||
| Gross profit | 37.6% | 5.4% | 30.4% | 11.6% | 13% | 15% | 22% | 20% | ||||
| Operating profit | 63.6% | 6.2% | 36.4% | 16.6% | 19% | 20% | 27% | 24% | ||||
| Pre-tax profit | 52.9% | -3.0% | 33.8% | 17.0% | 18% | 20% | 27% | 24% | ||||
| Net Margin | 44.5% | -3.8% | 39.1% | 20.0% | 12% | 19% | 32% | 27% |
© 2026 Citigroup Inc. No redistribution without Citigroup's written permission.
Source: Company Reports, Citi Research Estimates
Prepared for Kevin Lu
Catalyst Watch on WinWay Technology (6515.TW)
Direction:
Upside
Duration:
Within 90 Days (expires 25 Aug 2026) 26 May 2026 Earnings
Date Added:
Catalyst:
We have an accelerating earnings growth outlook for WinWay as a dominant beneficiary of the rising demand for AI GPUs and the SLT volume multiplier. Specifically, we believe the mass production of next-gen US AI GPU in 2Q26 and the upcoming AI ASIC project in 2H26 could be the catalysts. With leading positions in high-speed coaxial sockets and thermal management, combined with an improving sales mix from MEMS expansion, we are positive over WinWay's structural growth outlook.
NT$
15k
13k
10k
7,500
5,000
2,500
Aug 25
than-expected SLT station deployments for the next-gen Al GPU/ASIC architecture.
4121% Upside
NT$ 11,500.00
4 70% Upside
NT$ 5,500.00
• 19% Downside
Bull/Bear: WinWay Technology (6515.TW)
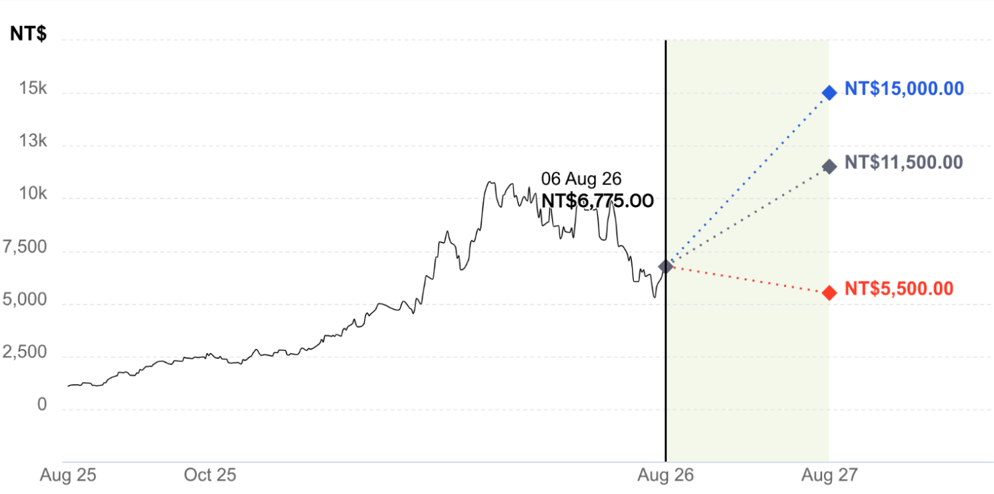
• Target PE multiple of 50x
BASE Assumptions
- @ · Test socket revenue growth of + 131% in 2026E, supported by steady transition to next-gen Al GPU platform and the 4- 5x volume multiplier in the SLT market. · Target PE multiple of 41x
BEAR Assumptions
- Weaker-than-expected test socket revenue growth of +60% in 2026E, due to potential delays in next-gen GPU roadmaps or intensified competition in the high-frequency socket segment. · Target PE multiple of 35x
Prepared for Kevin Lu
Prepared for Kevin Lu
WinWay Technology
Company description
WinWay, founded in 2001, is a global leader in semiconductor test interfaces and the world's largest test socket supplier. Originally specializing in highspeed solutions for IC design and OSAT firms, WinWay now dominates the AI and HPC sectors. The company provides a comprehensive portfolio including coaxial sockets, burn-in sockets, probe cards (MEMS & VPC), and advanced thermal management systems. Its flagship hypersocket technology and vertically integrated manufacturing enable high-performance validation for next-generation accelerators. WinWay's diverse solutions support missioncritical applications across global AI infrastructure, networking, and highspeed computing.
Investment strategy
We rate WinWay at Buy/High Risk (1H). We believe WinWay is well positioned for the AI infrastructure cycle, with dominance in the US AI GPU testing supply chain and participation in US CSP AI ASIC projects. Its leading proprietary coaxial socket and hypersocket technologies should provide a defensible technical moat as 224G SerDes and extreme package complexities expand. The company captures a wider share of the test interface market through its premium sockets and high-quality service, providing a multilayered earnings engine supported by structural growth in AI testing intensity.
Valuation
We value WinWay using a PE-based approach that factors in earnings momentum and likely expansion of its addressable market. Our target price of NT$11,500 is derived from applying c.41x to 2H27E-1H28E EPS, higher than the upper end of its long-term PE range, which we believe is justified given the company's entrenched position in the high-end AI GPU testing supply chain, rising contribution from coaxial socket and SLT solutions, and the increasing value of test content per module. With these structural drivers in place, and as we believe the market is starting to value it as an AI/HPC play (rather than a consumer electronics stock), we expect the multiple to hold at a premium relative to its historical averages.
Risks
Our quant rating system rates the WinWay stock High Risk based on its historical volatility.
Key downside risks that could impede the stock from reaching our target price and our earnings forecasts include: 1) client and sector concentration specifically any delays in US AI GPU product roadmap could impact the business outlook for WinWay; 2) intensifying competition in coaxial and hypersockets from global peers; 3) faster-than-expected testing algorithm optimization, which could shorten testing durations and reduce the anticipated hardware demand multiplier; and 4) delay of MEMS Phase 2 mass production.
Analyst: Michael Hung
Date
Date
TWD
10,000
5,000
If you are visually impaired and would like to speak to a Citi representative regarding the details of the graphics in this document, please call USA 1-888-500-5008 (TTY: 711), from outside the US +1-210-677-3788