PDF 原檔:報告_Citi_日月光3711_20260730_original.pdf
圖片清單(已驗證 2026-07-31)
| 檔名 | size | 分類 | 親眼所見內容 |
|---|---|---|---|
260730_citi_ASE_002.png |
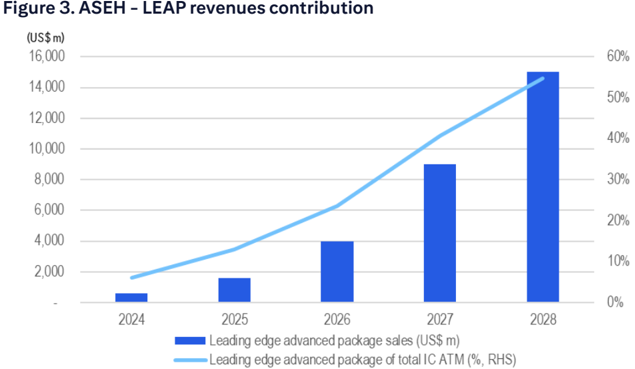
50KB | 真資料圖 | Figure 3:ASEH LEAP 營收貢獻長條圖(2024-2028,US$m),另疊加 LEAP 占 IC ATM 總營收比例折線(右軸,2024 約 10%→2028 近 60%) |
260730_citi_ASE_003.png |
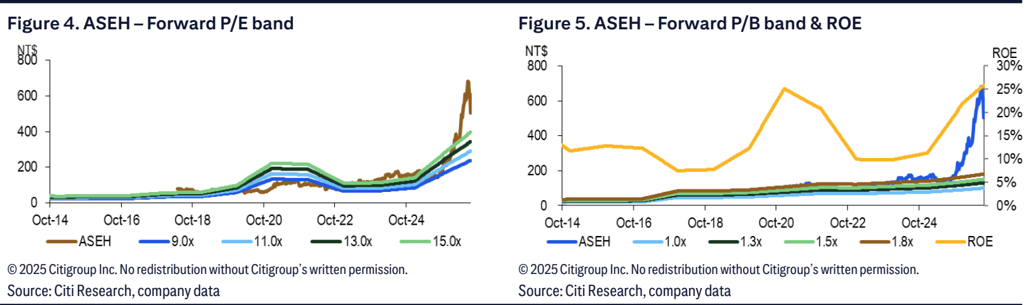
109KB | 真資料圖 | 左右並列兩圖:Figure 4 ASEH forward P/E band(Oct-14~2026,9x/11x/13x/15x 區間)、Figure 5 ASEH forward P/B band & ROE(1.0x/1.3x/1.5x/1.8x 區間 + ROE 折線) |
260730_citi_ASE_004.png |
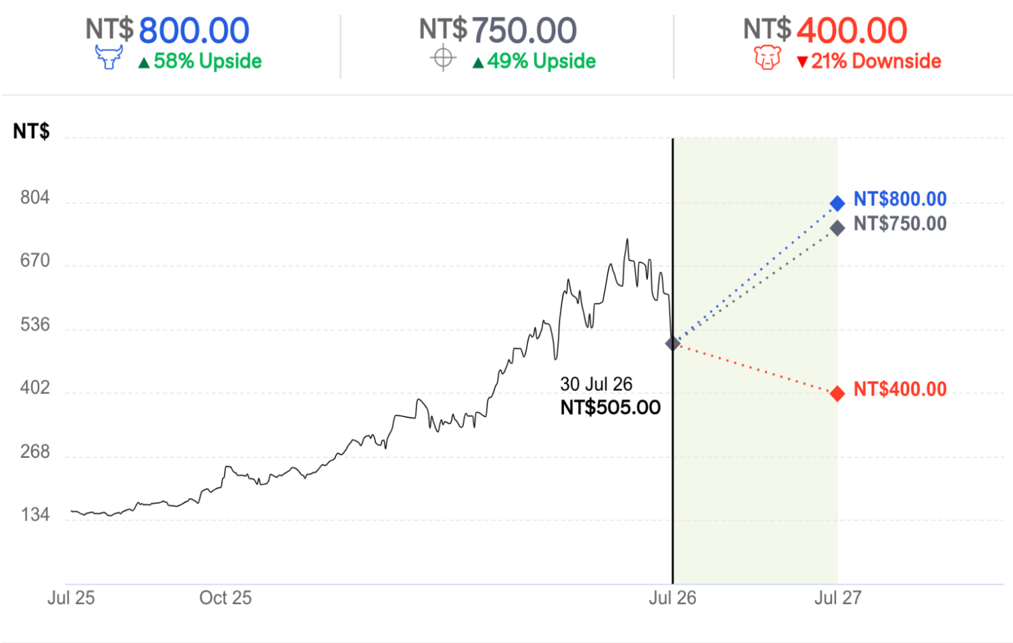
101KB | 真資料圖 | 90 天目標價區間圖:Bull NT$800(+58%)/Base NT$750(+49%)/Bear NT$400(-21%),股價 30 Jul 26 收盤 NT$505 為基準 |
260730_citi_ASE_005.png |
208KB | 真資料圖 | 上下兩張評等/目標價沿革圖(Fundamental Research 與 Short-Term View/Catalyst Watch),標示歷次評等調整日期、目標價與收盤價 |
260730_citi_ASE_001.png |
16KB | 未 Read(<40KB,依規則預設略) | — |
原始內容
(RIC: 3(11.1W, BB: 3(1111)
TWD
700
600
500
400
300
200
100
Prepared for Kevin Lu
30 Jul 2026 13:01:07 ET │ 18 pages
Sep
Dec
Mar
Jun
ASE Technology Holding (3711.TW)
AI semiconductor accelerates multi-year growth and structural Margin Upside
CITI'S TAKE
ASEH delivered another upbeat result, with solid 21% GM and net profit of NT$21bn (up 49% QoQ and 180% YoY). It raised its growth outlook (IC ATM to be up 35% YoY; LEAP revenue to be over US$3.5bn and doubling into 2027) and 2026 capex expectations (from US$8.5bn to now US$10.5bn), citing stronger-than-anticipated demand for LEAP (advanced packaging and testing). With accelerating investment in LEAP, panel-level packaging, full-process packaging and future CPO technologies, ASEH believes it is well positioned to capture a multi-year AI growth cycle while continuing to expand profitability. Maintain Buy and lift TP to NT$750 (25X 2027 EPS).
Capex accelerates to expand advanced packaging leadership -ASEH believes AI remains in the early stages of a structural infrastructure buildout, supporting sustained demand well beyond current AI accelerator deployments. Demand is also broadening beyond AI accelerators into industrial power, connectivity and storage, reinforcing confidence that AI infrastructure spending will remain a multi-year growth driver. Profitability continues to improve faster than expected as LEAP and advanced testing contribute a larger share of revenue. ATM gross margin reached 27.3% in 2Q26, while management expects margins to improve sequentially and potentially exceed the long-standing 30% structural ceiling in 4Q26. Margin expansion is being driven by higher utilization, richer product mix, automation and operating leverage rather than temporary cost benefits. Pricing also remains supportive, with inflationary cost increases largely passed through to customers.
Technology roadmap broadens beyond CoWoS -Other than CoWoS, ASEH is investing across multiple next-generation technologies, including panel-based packaging, full-process CoWoS packaging and future CPO integration. It expects its fully automated panel-level packaging line to begin production in 1Q27, providing a scalable platform for larger chiplet architectures. Meanwhile, CPO is expected to enter initial production later this year, allowing the industry to validate bandwidth, thermal performance and manufacturing yield before broader deployment. Management also highlighted future heterogeneous integration combining digital, analog and sensor technologies for AI and humanoid applications. ASEH believes its neutral ecosystem position enables collaboration across foundries, substrate suppliers and customers in various packaging architecture - CoWoS, EMIB, panelbased or future optical integration, reinforcing its long-term competitive advantage.
Earnings Summary
| Year to 31Dec | Net Profit (NT$M) | DilutedEPS (NT$) | EPSgrowth (%) | P/E (x) | P/B (x) | ROE (%) | Yield (%) |
|---|---|---|---|---|---|---|---|
| 2024A | 32,482 | 7.52 | 1.8 | 67.1 | 6.9 | 10.5 | 1 |
| 2025A | 40,658 | 9.38 | 24.6 | 53.9 | 6.5 | 12.1 | 1 |
| 2026E | 88,403 | 20.36 | 117.2 | 24.8 | 5.6 | 23.6 | 1.4 |
| 2027E | 135,284 | 31.16 | 53 | 16.2 | 4.7 | 30.7 | 2.8 |
| 2028E | 179,363 | 41.32 | 32.6 | 12.2 | 4 | 34.3 | 3.9 |
Source: Powered by dataCentral
See Appendix A-1 for Analyst Certification, Important Disclosures and Research Analyst Affiliations.
| n Buy Short-Term View: Upside Price (30 Jul 2613:30) | NT$505.00 |
|---|---|
| Target price fromNT$600.00 | NT$750.00↑ |
| Expected share price return | 48.5% |
| Expected dividend yield | 1.4% |
| Expected total return | 49.9% |
| MarketCap | |
| NT$2,257,639M | |
| US$69,766M |
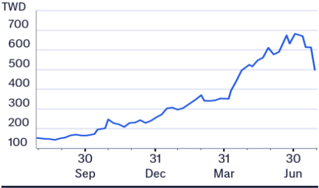
Price Performance (RIC: 3711.TW, BB: 3711 TT)
AC
Laura (Chia Yi) Chen +886-2-8726-9090 laura.cy.chen@citi.com
Prepared for Kevin Lu
| 3711.TW: Fiscalyearend31-Dec | Price:NT$505.00; TP: NT$750.00; Market Cap: NT$2,257,639m; Recomm:Buy | Price:NT$505.00; TP: NT$750.00; Market Cap: NT$2,257,639m; Recomm:Buy | Price:NT$505.00; TP: NT$750.00; Market Cap: NT$2,257,639m; Recomm:Buy | Price:NT$505.00; TP: NT$750.00; Market Cap: NT$2,257,639m; Recomm:Buy | Price:NT$505.00; TP: NT$750.00; Market Cap: NT$2,257,639m; Recomm:Buy | Price:NT$505.00; TP: NT$750.00; Market Cap: NT$2,257,639m; Recomm:Buy | Price:NT$505.00; TP: NT$750.00; Market Cap: NT$2,257,639m; Recomm:Buy | Price:NT$505.00; TP: NT$750.00; Market Cap: NT$2,257,639m; Recomm:Buy | Price:NT$505.00; TP: NT$750.00; Market Cap: NT$2,257,639m; Recomm:Buy | Price:NT$505.00; TP: NT$750.00; Market Cap: NT$2,257,639m; Recomm:Buy | Price:NT$505.00; TP: NT$750.00; Market Cap: NT$2,257,639m; Recomm:Buy |
|---|---|---|---|---|---|---|---|---|---|---|---|
| Profit&Loss(NT$m) | 2024 | 2025 | 2026E | 2027E | 2028E | Valuation ratios | 2024 | 2025 | 2026E | 2027E | 2028E |
| Sales revenue | 595,410 | 645,388 | 866,810 | 1,102,855 | 1,319,551 | PE(x) | 67.1 | 53.9 | 24.8 | 16.2 | 12.2 |
| Cost of sales | -498,478 | -531,195 | -684,073 | -844,882 | -1,000,856 | PB(x) | 6.9 | 6.5 | 5.6 | 4.7 | 4.0 |
| Gross profit | 96,932 | 114,193 | 182,737 | 257,973 | 318,695 | EV/EBITDA(x) | 24.8 | 20.8 | 13.6 | 9.0 | 6.9 |
| Gross Margin (%) | 16.3 | 17.7 | 21.1 | 23.4 | 24.2 | FCFyield (%) | 0.1 | -2.8 | -5.1 | 1.5 | 3.3 |
| EBITDA(Adj) | 95,162 | 114,363 | 181,519 | 285,546 | 374,382 | Dividend yield (%) | 1.0 | 1.0 | 1.4 | 2.8 | 3.9 |
| EBITDAMargin(Adj) (%) | 16.0 | 17.7 | 20.9 | 25.9 | 28.4 | Payout ratio (%) | 69 | 56 | 35 | 45 | 48 |
| Depreciation | -55,995 | -63,607 | -82,283 | -134,170 | -181,904 | ROE(%) | 10.5 | 12.1 | 23.6 | 30.7 | 34.3 |
| Amortisation | 0 | 0 | 0 | 0 | 0 | Cashflow(NT$m) | 2024 | 2025 | 2026E | 2027E | 2028E |
| EBIT (Adj) | 39,166 | 50,756 | 99,236 | 151,376 | 192,478 | EBITDA | 95,162 | 114,363 | 181,519 | 285,546 | 374,382 |
| EBIT Margin (Adj) (%) | 6.6 | 7.9 | 11.4 | 13.7 | 14.6 | Working capital | 16,383 | 6,233 | 32,670 | 112,905 | 30,167 |
| Net interest | -4,965 | -6,070 | -4,748 | -7,623 | -6,976 | Other | -5,241 | -8,915 | -9,321 | -14,859 | -11,866 |
| Associates | 0 | 0 | 0 | 0 | 0 | Operating cashflow | 106,304 | 111,681 | 204,869 | 383,592 | 392,683 |
| Non-Op/Except/Other Adj | 7,482 | 6,615 | 15,050 | 22,731 | 34,757 | Capex | -103,655 | -172,191 | -315,787 | -350,000 | -320,000 |
| Pre-tax profit | 41,683 | 51,301 | 109,538 | 166,484 | 220,258 | Net acq/disposals | -12,916 | -4,451 | -19,292 | -28,246 | -41,354 |
| Tax | -7,758 | -9,460 | -19,623 | -29,967 | -39,646 | Other | 534 | 2,909 | 0 | 0 | 0 |
| Extraord./Min.Int./Pref.div. | -1,443 | -1,182 | -1,512 | -1,233 | -1,249 | Investing cashflow | -116,038 | -173,733 | -335,079 | -378,246 | -361,354 |
| Reported net profit | 32,482 | 40,658 | 88,403 | 135,284 | 179,363 | Dividends paid | -22,459 | -23,034 | -31,713 | -61,882 | -87,935 |
| Net Margin (%) | 5.5 | 6.3 | 10.2 | 12.3 | 13.6 | Financing cashflow | 18,943 | 78,028 | 62,363 | -5,822 | -24,134 |
| CoreNPAT | 32,482 | 40,658 | 88,403 | 135,284 | 179,363 | Net change in cash | 9,208 | 15,976 | -67,847 | -476 | 7,194 |
| Per share data | 2024 | 2025 | 2026E | 2027E | 2028E | Free cashflow to s/holders | 2,648 | -60,510 | -110,918 | 33,592 | 72,683 |
| Reported EPS($) | 7.52 | 9.38 | 20.36 | 31.16 | 41.32 | ||||||
| Core EPS($) | 7.52 | 9.38 | 20.36 | 31.16 | 41.32 | ||||||
| DPS($) | 5.21 | 5.30 | 7.13 | 13.91 | 19.77 | ||||||
| CFPS($) | 24.62 | 25.76 | 47.19 | 88.36 | 90.46 | ||||||
| FCFPS($) | 0.61 | -13.95 | -25.55 | 7.74 | 16.74 | ||||||
| BVPS($) | 73.27 | 77.99 | 90.74 | 107.24 | 127.79 | ||||||
| Wtdavgordshares(m) | 4,318 | 4,336 | 4,341 | 4,341 | 4,341 | ||||||
| Wtdavgdiluted shares (m) | 4,318 | 4,336 | 4,341 | 4,341 | 4,341 | ||||||
| Growthrates | 2024 | 2025 | 2026E | 2027E | 2028E | ||||||
| Sales revenue (%) | 2.3 | 8.4 | 34.3 | 27.2 | 19.6 | ||||||
| EBIT (Adj) (%) | -2.9 | 29.6 | 95.5 | 52.5 | 27.2 | ||||||
| CoreNPAT(%) | 2.4 | 25.2 | 117.4 | 53.0 | 32.6 | ||||||
| CoreEPS(%) | 1.8 | 24.6 | 117.2 | 53.0 | 32.6 | ||||||
| BalanceSheet(NT$m) | 2024 | 2025 | 2026E | 2027E | 2028E | ||||||
| Cash&cashequiv. | 76,493 | 92,469 | 24,622 | 24,146 | 31,340 | ||||||
| Accounts receivables | 113,420 | 125,042 | 189,139 | 199,420 | 191,264 | ||||||
| Inventory | 61,181 | 69,383 | 104,949 | 124,499 | 151,250 | ||||||
| Net fixed &other tangibles | 428,295 | 533,969 | 767,473 | 983,303 | 1,121,399 | ||||||
| Goodwill &intangibles | 0 | 0 | 0 | 0 | 0 | ||||||
| Financial &other assets | 61,309 | 68,470 | 101,551 | 134,713 | 185,867 | ||||||
| Total assets | 740,698 | 889,333 | 1,187,735 | 1,466,082 | 1,681,120 | ||||||
| Accounts payable | 78,221 | 88,754 | 244,312 | 339,987 | 403,035 | ||||||
| Short-term debt | 53,872 | 38,513 | 52,857 | 61,405 | 71,133 | ||||||
| Long-term debt | 139,728 | 214,081 | 293,814 | 341,326 | 395,399 | ||||||
| Provisions &other liab | 123,090 | 174,618 | 165,183 | 217,160 | 212,673 | ||||||
| Total liabilities | 394,911 | 515,966 | 756,166 | 959,878 | 1,082,239 | ||||||
| Shareholders' equity | 323,523 | 346,900 | 403,589 | 476,992 | 568,420 | ||||||
| Minority interests | 22,264 | 26,468 | 27,980 | 29,212 | 30,461 | ||||||
| Total equity | 345,787 | 373,368 | 431,569 | 506,204 | 598,881 | ||||||
| Net debt (Adj) | 117,107 | 160,125 | 322,049 | 378,585 | 435,191 | ||||||
| Net debt to equity (Adj) (%) | 33.9 | 42.9 | 74.6 | 74.8 | 72.7 |
Figure 1. AstH - 2240 Results Comparison
2Q26
40,150
21.0%
21,134
11.1%
21,068
4.85
1Q26
(NT$mn)
Revenue
Gross profit
Gross margin
Op. profit
OP margin
Net income
EPS (NTS)
34,818
20.0%
17,493
10.1%
14,132
3.26
15%
+1.0 ppt
21%
+1.0 ppt
49%
49%
2Q25
25,688
17.0%
10,193
6.8%
7,521
1.74
Y/Y
27%
56%
+4.0 ppt
107%
+4.3 ppt
180%
180%
@ 2026 Citioroun Inc No redistribution without Citioroun's written nermission
Prepared for Kevin Lu
2Q26
Citi
188,675
39,037
20.7%
20,735
11.0%
18,491
Diff.
1%
3%
+0.3 ppt
2%
+0.1 ppt
14%
2026
Cons
188,647
39,255
20.8%
21,216
11.2%
16,826
Diff.
1%
2%
+0.2 ppt
0%
- 0.2 ppt
25%
Further upward revision, maintain Buy -Along with its doubling revenue in LEAP, we are looking for 40kwpm capacity for ASEH into next year from 20kwpm in 2026. We also lift our earnings projection by 11%/23%/25% for 2026/2027/2028 thanks to better structural GM expansion and AI-led upside. We maintain our Buy rating on ASEH with higher TP at NT$750 (25x of our 2027 EPS estimate) .
Solid result and constructive outlook
ASEH reports a better than expected 2Q26 result and positive outlook with solid 21% GM and net profit of NT$21bn (up 49% QoQ and 180% YoY). Management raised both growth (IC ATM to be up 35% YoY; LEAP revenue to be over US$3.5bn and doubling into 2027) and capex expectations (from US$8.5bn to now US$10.5bn), citing stronger-than-anticipated demand for LEAP advanced packaging and testing. Thanks to better product mix and more LEAP revenue exposure, we see further upward earnings revision ahead.
Figure 1. ASEH - 2Q26 Results Comparison
Source: Citi Research, Bloomberg
Key takeaways from earnings call
IC ATM (Assembly, Test & Materials)
- 1H26 ATM revenue +35% YoY.
- LEAP revenue ahead of its target of US$3.5bn for 2026; expecting to be doubling into 2027
- 2Q26 ATM revenue reached a record NT$126.1bn, +12% QoQ / +36% YoY.
- Full-year ATM revenue expected to grow ~35% YoY.
- 3Q26 ATM revenue guidance: +11-13% QoQ.
- LEAP revenue is tracking ahead of the previous US$3.5bn guidance, with management targeting doubling LEAP revenue in 2027.
- Growth is constrained by capacity expansion and execution, rather than demand.
- 2Q26 ATM GM: 27.3% (+1.3ppt QoQ; +5.4ppt YoY), driven by higher LEAP mix, better operating leverage, higher utilization.
Prepared for Kevin Lu
- 3Q26 ATM GM guidance: 28-29%.
- Management expects 4Q26 ATM GM to exceed the structural 30% ceiling, after which it will review raising its long-term structural margin target.
Capex and technology Roadmap
- CoWoS continues to support current AI infrastructure while ASEH is also preparing alternative packaging technologies.
- CoPoS is being developed for larger reticle sizes, higher bandwidth and more complex chiplet integration.
- Panel-level packaging will begin production in 1Q27.
- CPO is expected to begin initial deployment toward the end of 2026, with commercial ramp depending on system performance, thermal efficiency and yield.
- ASEH also highlighted longer-term heterogeneous integration combining digital, analog and sensing devices for future AI and humanoid applications.
- 2026 CapEx increased by another US$2bn to US$10.5bn, reflecting stronger LEAP demand in both 2026 and 2027.
- Capex Breakdown: US$6.5bn for machinery & equipment; US$4.0bn for factories, facilities and infrastructure.
- Equipment allocation:
- o ~56% to assembly.
- o ~40% to testing.
- o Remaining to EMS and interconnect materials.
- Around 70% of equipment CapEx is dedicated to leading-edge (LEAP) technologies, with the remainder supporting mainstream advanced packaging and testing capacity.
- ASEH is simultaneously executing 13 greenfield projects and 8 brownfield expansions, which management believes should provide sufficient capacity through 2028 and potentially into 2029.
EMS
- 2Q26 EMS revenue: NT$65.8bn (+6% QoQ; +12% YoY).
- 3Q26 EMS revenue guidance: around +40% QoQ.
- Management noted the unusually strong sequential growth is primarily driven by higher memory component prices, which increases reported revenue.
Prepared for Kevin Lu
- Excluding the memory price effect, underlying EMS demand follows a more typical seasonal pattern.
- Management expects 4Q26 EMS revenue to remain roughly similar to 3Q26 levels.
- Gross Margin: 2Q26 EMS GM: 8.9% (-0.6ppt QoQ).
- Management believes combining EMS and ATM enables end-to-end system optimization for future AI infrastructure.
Maintaining Buy; TP raised to NT$750
Along with its doubling revenue in LEAP, we are looking for 40kwpm capacity for ASEH into next year from 20kwpm in 2026. We also lift our earnings projection by 11%/23%/25% for 2026/2027/2028 thanks to better structural GM expansion and AI-led upside. We maintain our Buy rating on ASEH with TP NT$750 (25x of our 2027 EPS estimate). Given its structural GM upward trend and promising LEAP business outlook, we believe our target PER of 25x (1.5-std above 3-year average) is justified.
Figure 2. ASEH - Estimates Revisions
| 2026E | 2026E | 2026E | 2027E | 2027E | 2027E | 2028E | 2028E | 2028E | |
|---|---|---|---|---|---|---|---|---|---|
| (NT$mn) | New | Old | Chg. | New | Old | Chg. | New | Old | Chg. |
| Sales | 866,810 | 801,568 | 8% | 1,102,855 | 969,568 | 14% | 1,319,551 | 1,156,294 | 14% |
| YoYgrowth | 34% | 24% | 27% | 21% | 20% | 19% | |||
| Gross profit | 182,737 | 166,856 | 10% | 257,973 | 212,554 | 21% | 318,695 | 257,141 | 24% |
| Opex | 83,501 | 76,263 | 9% | 106,598 | 93,048 | 15% | 126,217 | 109,017 | 16% |
| Operating profit | 99,236 | 90,593 | 10% | 151,376 | 119,506 | 27% | 192,478 | 148,124 | 30% |
| Pre-tax profit | 109,538 | 99,227 | 10% | 166,484 | 136,160 | 22% | 220,258 | 175,920 | 25% |
| Net income | 88,403 | 79,642 | 11% | 135,284 | 110,418 | 23% | 179,363 | 143,006 | 25% |
| EPS(NT$) | 20.36 | 18.35 | 11% | 31.16 | 25.43 | 23% | 41.32 | 32.94 | 25% |
| Gross margin | 21.1% | 20.8% | +0.3 ppt | 23.4% | 21.9% | +1.5 ppt | 24.2% | 22.2% | +1.9 ppt |
| Opexratio | 9.6% | 9.5% | +0.1 ppt | 9.7% | 9.6% | +0.1 ppt | 9.6% | 9.4% | +0.1 ppt |
| Operating margin | 11.4% | 11.3% | +0.1 ppt | 13.7% | 12.3% | +1.4 ppt | 14.6% | 12.8% | +1.8 ppt |
| Net margin | 10.2% | 9.9% | +0.3 ppt | 12.3% | 11.4% | +0.9 ppt | 13.6% | 12.4% | +1.2 ppt |
© 2026 Citigroup Inc. No redistribution without Citigroup's written permission.
Source: Citi Research
Figure 4. Asth - Forward P/t band
Figure 3. ASEH - LEAP revenues contribution
(US$ m)
16,000
600
14,000
400
12,000
200
10,000
0 f
8,000
Oct-14
Oct-16
—ASEH
6,000
4,000
Oct-18
- 9.0x
Oct-20
-11.0x
— 13.0x
Oct-24
- 15.0x
@ 2025 Citigroun Inc. No redistribution without Citicroun's written nermission
2,000
Prepared for Kevin Lu
2024
2025
2026
2027
-
Leading edge advanced package sales (US$ m)
-
Leading edge advanced package of total IC ATM (%, RHS)
M 2026 Citiornun Ine No redistrihution without Citioroun's written nermission
60%
50%
40%
30%
ROE
30%
20%
15%
10%
5%
0%
© 2026 Citigroup Inc. No redistribution without Citigroup's written permission.
Source: Citi Research
Oct-22
Figure s. Asth - Forward P/b band & KUt
NT$
800
600
400
200
Figure 6. AStH - Forecast Summary
2025
25,688
-15,494
-7,750
-8,004
10,193
-1,310
-15,221
24,893
-7,905
9,671
-7,579
-1,309
1,448
- 15,676
28,877
-7,631
-8,308
13,201
-1,590
371
2,365
Figure 6. ASEH - Forecast Summary
10,870
4QE
319,247
-244,681
74,566
-30,967
- 15,258
-15,962
43,599
-2.047
6,504
48,056
8.650
39,091
2025
645,388
-531,195
114,193
-63,437
-31,634
-32.851
50,756
-6,070
6,615
51,301
-9.460
40,658
2026E
866.810
-684,073
182,737
-83,501
-41,572
-42.976
99,236
-4.748
15,050
109,538
-19.623|
88.403
1QE
243,713
-188,165
55,548
-23,826
-11,893
-12,186
31,722
-1,630
4,868
34,960
6.293
28,369
2027
2QE
257,242
-196,853
60,389
-24,952
-12,343
-12.862
35,436
-1,888
5,408
38,957
7,012
31,635
3QE
282,653
-215.183
67,471
-26,852
-12.972
-14,133
40,619
-2.057
5,951
44,512
8.012
36,188
1Q
173,662
-138,844
34,818
-17,325
-8,739
-8.857
17,493
-664
1,332
18,161
3,629
14,132
2026
2Q
191,064
-150,914
40,150
-19,016
-9,733
-9.553
21,134
-1,100
5,666
25,700
4.172
21,068
3QE
232,969
-184,516
48,453
-22,132
-10,737
-11,648
26,321
-1,382
3,865
28,804
5,185
23,310
4QE
269,115
-209,799
59,316
-25,028
-12,363
-12.918
34,288
1,602
4,187
36,873
6.637
29,893
2027E
1.102.855
-844,882
257,973
-106,598
-52,467
-55.143
151,376
-7,623
22,731
166,484
-29.967
135,284
| 1.75 | 1.74 | 1.74 | 1.74 | 5.37 6.89 6.53 7.29 | 5.37 6.89 6.53 7.29 | 5.37 6.89 6.53 7.29 | 5.37 6.89 6.53 7.29 | 5.37 6.89 6.53 7.29 | 9.00 9.38 | 9.00 9.38 | 9.00 9.38 | 9.00 9.38 | 20.36' | 31.16' |
|---|---|---|---|---|---|---|---|---|---|---|---|---|---|---|
| 2.50 | 3.26 | 4.85 | 8.34 | |||||||||||
| 16.8 17.0 | 17.1 | 19.5 | 20.0 | 21.0 | 20.8 | 22.0 | 22.8 | 23.5 | 23.9 | 23.4 | 17.7 | 21.1 | 23.4 | |
| 6.5 6.8 | 7.8 | 9.9 | 10.1 | 11.1 | 11.3 | 12.7 | 13.0 | 13.8 | 14.4 | 13.7 | 7.9 | 11.4 | 13.7 | |
| 5.1 5.0 | 6.4 | 8.3 | 8.1 | 11.0 | 10.0 | 11.1 | 11.6 | 12.3 | 12.8 | 12.2 | 6.3 | 10.2 | 12.3 | |
| -8.7 1.8 | 11.8 | 5.5 | -2.4 | 10.0 | 21.9 | 15.5 | -9.4 | 5.6 | 9.9 | 12.9 | 8.4 | 34.3 | 27.2 | |
| -6.5 3.2 | 12.4 | 20.3 | 0.2 | 15.3 | 20.7 | 22.4 | -6.4 | 8.71 | 11.7 | 10.5 | 17.8 | 60.0 | 41.2 | |
| -13.7 | 29.5 | 34.0 | - 1.1 | 20.8 | 24.5 | 30.3 | -7.5 | 11.7 | 14.6 | 7.3 | 29.6 | 95.5 | 52.5 | |
| 5.4 - 18.9 -0.4 | 44.5 | 35.4 | -4.0| | 49.1 | 10.6 | 28.2 | -5.1 | 11.5 | 14.4 | 8.0 | 25.2 | 117.4 | 53.0 | |
| -19.1 | 35.4 | -40| | 49.1 | 10.6 | 28.2 | -5.11 | 11.5 | 14.4 | 8.0 | 24.6 | 117.2 | 53.0 | ||
| -0.5| | 44.2 | |||||||||||||
| @ 2025 Citioroun Inc. No redistribution without Citigroun's written permission. |
© 2025 Citigroup Inc. No redistribution without Citigroup's written permission.
Source: Citi Research, company data
Revenue
COGS
Gross Profit
Operating Expense
SG&A expenses
R&D expenses
EBIT
Net Interest Income
Net Other Income
Pre- Tax Profit
Tax
Net Profit to Parent
EPS (NT$)
Margins (%)
Operating Margin
Gross Margin
Net Margin
Revenue
Sequential Growth (%)
Gross Profit
EBIT
Net Profit
EPS
Prepared for Kevin Lu
4Q
2028E
Prepared for Kevin Lu
Adding Upside 90-Day Short-Term View on ASE Technology Holding (3711.TW)
Direction:
Upside
Duration:
Within 90 Days
Category:
Thematic driven
We expect ASEH's strong GM expansion and LEAP business development to support its share price performance in the coming months.
NT$
804
670
536
402
268
134
Jul 25
4 58% Upside
49% Upside
NT$ 400.00
• 21% Downside
Bull/Bear: ASE Technology Holding (3711.TW)
BASE Assumptions
• Solid development in LEAP business
- Long-term operating margin maintained at >12%
BEAR Assumptions
{j. Muted revenue growth with margin contraction
- Lower-than-expected utilization rate
Prepared for Kevin Lu
NT$ 750.00
Prepared for Kevin Lu
ASE Technology Holding
Company description
Advanced Semiconductor Engineering (ASE), incorporated in 1984 and listed at the TWSE in 1989, is one of the world's leading companies in the semiconductor packaging and testing sector. In June 2016, ASE entered into a Joint Share Exchange Agreement with SPIL under which ASE Industrial was eventually to be formed as a holding company with 100% equity interests in both ASE and SPIL. ASE Industrial was listed on Taiwan's main board on April 30, 2018, the same day on which ASE and SPIL were delisted.
Investment strategy
We have a Buy rating on ASE Holding. The combined ASE-SPIL entity is the highest-quality OSAT worldwide, in our view, with its market share leadership, superior operations, economies of scale, and customer/product diversification. Conditions imposed by the Chinese government on the ASESPIL merger, which required them to operate independently, were lifted in 2020. Consequently, we believe ASE Holding will benefit from further revenue and operating synergies as well as the trend for advanced packaging.
Valuation
Our target price of NT$750 is based on 25x 2027 EPS average. Our PER is higher than its five-year range as we expect ASEH to see accelerating earnings growth in the coming years with GM at upward expansion trend, mainly driven by its promising outlook in LEAP business and strong expansion for long-term AI demand. At our target price, the shares would trade at a 2026/27E P/B of 8x/7x.
Risks
Key downside risks that could prevent ASE shares from reaching our target price include: 1) poor efficiency and less synergy created from merger with SPIL; 2) failure to gain market share in advanced packaging; 3) industry oversupply due to aggressive capacity expansion; 4) severe pricing erosion due to competition; and 5) a longer-than-expected semiconductor inventory correction.
If you are visually impaired and would like to speak to a Citi representative regarding the details of the graphics in this document, please call USA 1-888-500-5008 (TTY: 711), from outside the US +1-210-677-3788