PDF 原檔:報告_Citi_技嘉2376_20260814_original.pdf
OCR 缺字警告
本檔開頭 RIC/BB 欄位 OCR 嚴重錯亂(23/6.IW、23(6 11) 實為 2376.TW/2376 TT)。金額與數字寫入 lib 前已與內文交叉驗證,模糊處標「待核對」。
圖片清單(已驗證 2026-08-17)
| 檔名 | size | 分類 | 親眼所見內容 |
|---|---|---|---|
260814_citi_gigabyte_001.png |
19KB | 裝飾·logo·banner | 「Asia Summer School 2026」廣告 banner,泳池背景配文字與信封圖示 |
260814_citi_gigabyte_002.png |
145KB | 真資料圖 | Figure 3/4 雙圖:技嘉 Forward P/E band(5x/11x/17x/23x 區間,最新落點約 23x)與 Forward P/B band(1x/2x/3x/4x 區間疊 Forward ROE 折線) |
260814_citi_gigabyte_003.png |
171KB | 真資料圖 | Bull/Base/Bear 目標價情境圖:現價 NT$397.50(14 Aug 26);Bull NT$700.00(+76% upside,18x)/Base NT$595.00(+50% upside,Sales YoY+71% 2026E、OPM6.1%、14x)/Bear NT$300.00(-25% downside,Sales YoY+10%、OPM4.0%、10x) |
260814_citi_gigabyte_004.png |
207KB | 真資料圖 | 上下兩圖:技嘉 Ratings and Target Price History(Fundamental Research,2024-2026 評等/目標價沿革,最新 480→595 附近標記 5)與 Short-Term View/Catalyst Watch Research 沿革圖 |
原始內容
(RIC: 23/6.IW, BB: 23(6 11)
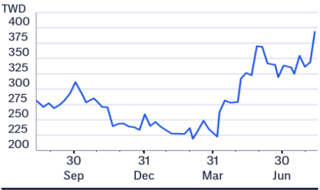
TWD
400
375
350
325
300
275
250
225
200
Prepared for Kevin Lu
14 Aug 2026 13:30:35 ET │ 14 pages
Gigabyte Technology (2376.TW)
2Q26 Beat on Opex & FX Gains; Raise TP to NT$595 on Robust NeoClouds Visibility
CITI'S TAKE
Gigabyte's 2Q26 net profit beat Citi/cons forecasts by 50%/21%, driven by tighter opex control and non-ops, even as GPM missed on a richer AI server mix. Mgmt. guided 2H26E revenue growth to outpace 1H26 on robust neoclouds demand, with GPM set to recover as VGA enters seasonal peak and mix improves further. The board also approved a GDR issuance of up to 50m shares and lifted 2026 capex guidance, reaffirming confidence in the capacity buildout. We raise 2026E-28E earnings forecasts by 28-46% and lift our TP to NT$595, based on c.14x 2027E EPS (rolled over from 17x 2026E EPS) to factor in AI server-driven margin dilution. Reiterate Buy.
2Q26 results beat on opex & non-ops Gigabyte reported 2Q26 net profit of NT$6.6bn (+25% QoQ/+117% YoY), beating Citi/cons forecasts by 50%/21%, primarily driven by better-than-expected opex control and non-ops. 2Q26 GPM came in at 9.6% (-2.4ppts QoQ/+0.2ppt YoY), below expectations, mainly due to a higher-than-expected AI server mix. That said, opex ratio of 4.0% also undershot expectations, implying leverage embedded in scaling AI server business. Non-ops included FX gain of c.NT$880mn, providing an additional boost to the bottom line.
2H26E guidance raised on neo-clouds demand -Mgmt. guided for 2H26E revenue growth to outpace 1H26, mainly on the back of robust demand from neoclouds, echoing our constructive view. We now expect 3Q26 revenue growth of 8% QoQ, with 4Q26 revenue to be further boosted by ramping AI server shipment. GPM guidance also points to sequential improvement, supported by better mix and VGA entering its seasonal peak. Additionally, the board approved a GDR issuance of up to 50m shares (timing yet to be determined), which we view as preparation for future working capital needs amid the capacity expansion. Mgmt. also raised 2026 capex guidance to NT$28-30bn (from NT$23-25bn), reaffirming confidence in demand visibility and the pace of capacity buildout.
Implications -We raise our 2026E-28E earnings forecasts by 28-46% to reflect the updated guidance and outlook. Our revised TP is set at NT$595, based on c.14x 2027E EPS, rolled over from 17x 2026E EPS. We apply a more conservative multiple to factor in rising margin dilution form the ramping AI server mix. Even so, we remain constructive on Gigabyte's growth opportunities in the neo-clouds segment, supported by robust order visibility extending into 2027. Reiterate Buy.
Earnings Summary
| Year to 31Dec | Net Profit (NT$M) | DilutedEPS (NT$) | EPSgrowth (%) | P/E (x) | P/B (x) | ROE (%) | Yield (%) |
|---|---|---|---|---|---|---|---|
| 2024A | 9,789 | 15.03 | 101.5 | 26.4 | 4.8 | 21.5 | 1.5 |
| 2025A | 12,190 | 18.2 | 21 | 21.8 | 4.5 | 21.6 | 2.5 |
| 2026E | 24,815 | 37.04 | 103.6 | 10.7 | 3.4 | 35.8 | 3 |
| 2027E | 29,088 | 43.42 | 17.2 | 9.2 | 2.5 | 30.9 | 6.1 |
| 2028E | 34,201 | 51.05 | 17.6 | 7.8 | 1.9 | 27.2 | 7.2 |
Source: Powered by dataCentral
See Appendix A-1 for Analyst Certification, Important Disclosures and Research Analyst Affiliations.
n Buy
Catalyst Watch: Upside, expires 17-AUG-26
Price (14 Aug 26 13:30)
NT$397.50
Target price
NT$595.00↑
from NT$480.00
Expected share price return
49.7%
Expected dividend yield
3.0%
Expected total return
52.7%
Market Cap
NT$266,281M
US$8,285M
Price Performance (RIC: 2376.TW, BB: 2376 TT)
Michael Hung AC
+886-2-8726-9092 michael.hung@citi.com
Laura (Chia Yi) Chen +886-2-8726-9090 laura.cy.chen@citi.com
Prepared for Kevin Lu
| 2376.TW: Fiscalyearend31-Dec | 2376.TW: Fiscalyearend31-Dec | 2376.TW: Fiscalyearend31-Dec | 2376.TW: Fiscalyearend31-Dec | 2376.TW: Fiscalyearend31-Dec | 2376.TW: Fiscalyearend31-Dec | Price: NT$397.50; TP:NT$595.00; Market Cap:NT$266,281m; Recomm:Buy | Price: NT$397.50; TP:NT$595.00; Market Cap:NT$266,281m; Recomm:Buy | Price: NT$397.50; TP:NT$595.00; Market Cap:NT$266,281m; Recomm:Buy | Price: NT$397.50; TP:NT$595.00; Market Cap:NT$266,281m; Recomm:Buy | Price: NT$397.50; TP:NT$595.00; Market Cap:NT$266,281m; Recomm:Buy | |
|---|---|---|---|---|---|---|---|---|---|---|---|
| Profit&Loss(NT$m) | 2024 | 2025 | 2026E | 2027E | 2028E | Valuation ratios | 2024 | 2025 | 2026E | 2027E | 2028E |
| Sales revenue | 265,149 | 336,937 | 574,869 | 774,757 | 895,730 | PE(x) | 26.4 | 21.8 | 10.7 | 9.2 | 7.8 |
| Cost of sales | -237,056 | -301,752 | -515,977 | -699,861 | -809,261 | PB(x) | 4.8 | 4.5 | 3.4 | 2.5 | 1.9 |
| Gross profit | 28,092 | 35,185 | 58,891 | 74,896 | 86,469 | EV/EBITDA(x) | 18.9 | 15.1 | 8.5 | 7.6 | 6.1 |
| Gross Margin (%) | 10.6 | 10.4 | 10.2 | 9.7 | 9.7 | FCFyield (%) | -7.0 | 1.5 | -26.0 | 2.8 | 16.0 |
| EBITDA(Adj) | 13,579 | 17,674 | 36,089 | 45,535 | 52,773 | Dividend yield (%) | 1.5 | 2.5 | 3.0 | 6.1 | 7.2 |
| EBITDAMargin(Adj) (%) | 5.1 | 5.2 | 6.3 | 5.9 | 5.9 | Payout ratio (%) | 40 | 55 | 32 | 56 | 56 |
| Depreciation | -802 | -901 | -1,158 | -1,465 | -1,434 | ROE(%) | 21.5 | 21.6 | 35.8 | 30.9 | 27.2 |
| Amortisation | 0 | 0 | 0 | 0 | 0 | Cashflow(NT$m) | 2024 | 2025 | 2026E | 2027E | 2028E |
| EBIT (Adj) | 12,777 | 16,772 | 34,931 | 44,070 | 51,338 | EBITDA | 13,579 | 17,674 | 36,089 | 45,535 | 52,773 |
| EBIT Margin (Adj) (%) | 4.8 | 5.0 | 6.1 | 5.7 | 5.7 | Working capital | 888 | 168 | -202 | 0 | 0 |
| Net interest | 127 | -87 | -2,064 | -2,571 | -2,571 | Other | -30,649 | -12,753 | -102,408 | -35,720 | -8,823 |
| Associates | 93 | 163 | 320 | 0 | 0 | Operating cashflow | -16,182 | 5,089 | -66,521 | 9,815 | 43,950 |
| Non-Op/Except/Other Adj | 601 | 131 | 1,430 | 0 | 0 | Capex | -1,964 | -1,161 | -2,822 | -2,400 | -1,400 |
| Pre-tax profit | 13,598 | 16,980 | 34,616 | 41,499 | 48,767 | Net acq/disposals | -60 | -198 | -3,847 | 0 | 0 |
| Tax | -2,843 | -3,695 | -6,887 | -8,633 | -10,123 | Other | -1,052 | 28 | 0 | 0 | 0 |
| Extraord./Min.Int./Pref.div. | -967 | -1,095 | -2,915 | -3,779 | -4,443 | Investing cashflow | -3,077 | -1,331 | -6,669 | -2,400 | -1,400 |
| Reported net profit | 9,789 | 12,190 | 24,815 | 29,088 | 34,201 | Dividends paid | -4,042 | -6,699 | -8,039 | -16,364 | -19,182 |
| Net Margin (%) | 3.7 | 3.6 | 4.3 | 3.8 | 3.8 | Financing cashflow | 17,190 | 15,061 | 63,345 | 4,447 | -683 |
| CoreNPAT | 9,789 | 12,190 | 24,815 | 29,088 | 34,201 | Net change in cash | -1,667 | 18,822 | -9,845 | 11,862 | 41,867 |
| Per share data | 2024 | 2025 | 2026E | 2027E | 2028E | Free cashflow to s/holders | -18,146 | 3,928 | -69,343 | 7,415 | 42,550 |
| Reported EPS($) | 15.03 | 18.20 | 37.04 | 43.42 | 51.05 | ||||||
| Core EPS($) | 15.03 | 18.20 | 37.04 | 43.42 | 51.05 | ||||||
| DPS($) | 6.03 | 10.00 | 12.00 | 24.43 | 28.63 | ||||||
| CFPS($) | -24.85 | 7.60 | -99.30 | 14.65 | 65.61 | ||||||
| FCFPS($) | -27.87 | 5.86 | -103.51 | 11.07 | 63.52 | ||||||
| BVPS($) | 82.45 | 88.22 | 118.62 | 162.04 | 213.09 | ||||||
| Wtdavgordshares(m) | 651 | 670 | 670 | 670 | 670 | ||||||
| Wtdavgdiluted shares (m) | 651 | 670 | 670 | 670 | 670 | ||||||
| Growthrates | 2024 | 2025 | 2026E | 2027E | 2028E | ||||||
| Sales revenue (%) | 93.9 | 27.1 | 70.6 | 34.8 | 15.6 | ||||||
| EBIT (Adj) (%) | 161.0 | 31.3 | 108.3 | 26.2 | 16.5 | ||||||
| CoreNPAT(%) | 106.4 | 24.5 | 103.6 | 17.2 | 17.6 | ||||||
| CoreEPS(%) | 101.5 | 21.0 | 103.6 | 17.2 | 17.6 | ||||||
| BalanceSheet(NT$m) | 2024 | 2025 | 2026E | 2027E | 2028E | ||||||
| Cash&cashequiv. | 21,499 | 40,321 | 30,476 | 42,339 | 84,206 | ||||||
| Accounts receivables | 28,551 | 33,803 | 43,337 | 50,537 | 49,295 | ||||||
| Inventory | 43,810 | 62,185 | 198,963 | 234,337 | 228,538 | ||||||
| Net fixed &other tangibles | 7,897 | 8,809 | 11,415 | 12,555 | 12,725 | ||||||
| assets | |||||||||||
| Financial &other | 9,337 | 10,753 | 23,845 | 27,375 | 26,766 | ||||||
| Total assets Accounts | 111,287 17,791 | 156,126 31,507 | 308,322 | 367,429 | 401,818 | ||||||
| payable | 56,301 | 69,452 | 67,297 | ||||||||
| Short-term debt | 2,000 18,403 | 33,743 | 82,704 | 82,704 | 82,704 32,769 | ||||||
| Long-term debt | 9,492 | 29,004 | 33,452 | ||||||||
| Provisions &other liab | 18,012 56,206 | 20,185 | 56,419 | 65,061 | 63,644 | ||||||
| Total liabilities | 94,926 | 224,428 | 250,669 | 246,414 | |||||||
| Minority interests | 1,397 | 2,099 | 4,434 | 8,212 | 12,655 | ||||||
| Total equity | 55,081 | 61,199 | 83,894 | 116,761 | 155,404 | ||||||
| -1,096 | 2,914 | 81,232 | 73,817 | 31,267 | |||||||
| Net debt (Adj) | |||||||||||
| Net debt to equity (Adj) (%) | -2.0 | 4.8 | 96.8 | 63.2 | 20.1 | ||||||
| For definitions of the items in this | please click here. |
Prepared for Kevin Lu
Figure 1. Gigabyte - 2Q26 earnings review
| (NT$mn) | 2Q26 Actual | 1Q26 Actual | Q/Q | 2Q25 Actual | Y/Y | 2Q26 Citi | Diff. | 2Q26 Cons. | Diff. |
|---|---|---|---|---|---|---|---|---|---|
| Revenue | 144,214 | 105,057 | 37% | 102,258 | 41% | 130,123 | 11% | 132,587 | 9% |
| Gross profit | 13,873 | 12,615 | 10% | 9,633 | 44% | 13,072 | 6% | 13,531 | 3% |
| Gross margin | 9.6% | 12.0% | -2.4 ppt | 9.4% | +0.2 ppt | 10.0% | -0.4 ppt | 10.2% | -0.6ppt |
| Op. profit | 8,120 | 7,414 | 10% | 5,293 | 53% | 6,387 | 27% | 7,171 | 13% |
| OPmargin | 5.6% | 7.1% | -1.4 ppt | 5.2% | +0.5 ppt | 4.9% | +0.7 ppt | 5.4% | +0.2 ppt |
| Net income | 6,606 | 5,268 | 25% | 3,050 | 117% | 4,414 | 50% | 5,438 | 21% |
| EPS(NT$) | 9.86 | 7.86 | 25% | 4.55 | 117% | 6.59 | 50% | 8.04 | 23% |
© 2026 Citigroup Inc. No redistribution without Citigroup's written permission.
Source: Company Reports, Citi Research Estimates, Bloomberg consensus
Figure 2. Gigabyte - Earnings estimate revisions
| 2026E | 2026E | 2026E | 2027E | 2027E | 2027E | 2028E | 2028E | 2028E | |
|---|---|---|---|---|---|---|---|---|---|
| (NT$mn) | New | Old | Chg. | New | Old | Chg. | New | Old | Chg. |
| Sales | 574,869 | 498,866 | 15% | 774,757 | 617,463 | 25% | 895,730 | 676,760 | 32% |
| Sequential growth | 71% | 48% | 35% | 24% | 16% | 10% | |||
| Gross profit | 58,891 | 52,486 | 12% | 74,896 | 60,739 | 23% | 86,469 | 66,572 | 30% |
| Opex | 23,961 | 25,198 | -5% | 30,827 | 31,217 | -1% | 35,131 | 34,182 | 3% |
| Operating profit | 34,931 | 27,289 | 28% | 44,070 | 29,522 | 49% | 51,338 | 32,390 | 59% |
| Pre-tax profit | 34,616 | 26,122 | 33% | 41,499 | 28,979 | 43% | 48,767 | 31,847 | 53% |
| Net income | 24,815 | 19,334 | 28% | 29,088 | 21,328 | 36% | 34,201 | 23,433 | 46% |
| EPS (NT$) | 37.04 | 28.86 | 28% | 43.42 | 31.84 | 36% | 51.05 | 34.98 | 46% |
| Gross margin | 10.2% | 10.5% | -0.3 ppt | 9.7% | 9.8% | -0.2 ppt | 9.7% | 9.8% | -0.2 ppt |
| Opex ratio | 4.2% | 5.1% | -0.9ppt | 4.0% | 5.1% | -1.1 ppt | 3.9% | 5.1% | -1.1 ppt |
| Operating margin | 6.1% | 5.5% | +0.6ppt | 5.7% | 4.8% | +0.9ppt | 5.7% | 4.8% | +0.9ppt |
| Net margin | 4.3% | 3.9% | +0.4 ppt | 3.8% | 3.5% | +0.3 ppt | 3.8% | 3.5% | +0.4 ppt |
© 2026 Citigroup Inc. No redistribution without Citigroup's written permission.
Source: Citi Research Estimates
Prepared for Kevin Lu
Figure 5. Gigabyte - Quarterly earnings forecasts
| (NT$in Mn, year-end Dec) | 1Q26 | 2Q26 | 3Q26E | 4Q26E | 1Q27E | 2Q27E | 3Q27E | 4Q27E | 2025 | 2026E | 2027E | 2028E |
|---|---|---|---|---|---|---|---|---|---|---|---|---|
| Net sales | 105,057 | 144,214 | 155,940 | 169,657 | 172,108 | 187,673 | 206,819 | 208,158 | 336,937 | 574,869 | 774,757 | 895,730 |
| Gross Profit | 12,615 | 13,873 | 15,969 | 16,434 | 16,547 | 18,103 | 20,132 | 20,114 | 35,185 | 58,891 | 74,896 | 86,469 |
| OPEX | (5,201) | (5,753) | (6,080) | (6,927) | (7,236) | (7,463) | (7,885) | (8,242) | (18,413) | (23,961) | (30,827) | (35,131) |
| Operating profit | 7,414 | 8,120 | 9,890 | 9,507 | 9,311 | 10,640 | 12,247 | 11,872 | 16,772 | 34,931 | 44,070 | 51,338 |
| Total Non-OP | (359) | 1,330 | (643) | (643) | (643) | (643) | (643) | (643) | 208 | (314) | (2,571) | (2,571) |
| Pre-tax profit | 7,055 | 9,451 | 9,247 | 8,864 | 8,668 | 9,997 | 11,604 | 11,230 | 16,980 | 34,616 | 41,499 | 48,767 |
| Income tax | (1,410) | (1,986) | (1,887) | (1,603) | (1,981) | (2,111) | (2,393) | (2,148) | (3,695) | (6,887) | (8,633) | (10,123) |
| Net Profit | 5,268 | 6,606 | 6,514 | 6,426 | 5,919 | 6,979 | 8,152 | 8,038 | 12,190 | 24,815 | 29,088 | 34,201 |
| EPS (NT$) | 7.86 | 9.86 | 9.72 | 9.59 | 8.84 | 10.42 | 12.17 | 12.00 | 18.20 | 37.04 | 43.42 | 51.05 |
| Revenue mix | ||||||||||||
| Motherboard | 7% | 5% | 5% | 4% | 4% | 4% | 4% | 4% | 10% | 5% | 4% | 3% |
| VGA | 19% | 12% | 13% | 11% | 10% | 10% | 10% | 10% | 24% | 13% | 10% | 9% |
| Communication | 72% | 80% | 79% | 82% | 83% | 84% | 84% | 85% | 62% | 79% | 84% | 85% |
| Others | 3% | 3% | 3% | 3% | 2% | 2% | 2% | 2% | 4% | 3% | 2% | 2% |
| Margins (%) | ||||||||||||
| Gross profit | 12.0% | 9.6% | 10.2% | 9.7% | 9.6% | 9.6% | 9.7% | 9.7% | 10.4% | 10.2% | 9.7% | 9.7% |
| OPEXtosales | 5.0% | 4.0% | 3.9% | 4.1% | 4.2% | 4.0% | 3.8% | 4.0% | 5.5% | 4.2% | 4.0% | 3.9% |
| Operating Margin | 7.1% | 5.6% | 6.3% | 5.6% | 5.4% | 5.7% | 5.9% | 5.7% | 5.0% | 6.1% | 5.7% | 5.7% |
| Pre-tax profit | 6.7% | 6.6% | 5.9% | 5.2% | 5.0% | 5.3% | 5.6% | 5.4% | 5.0% | 6.0% | 5.4% | 5.4% |
| Net Margin | 5.0% | 4.6% | 4.2% | 3.8% | 3.4% | 3.7% | 3.9% | 3.9% | 3.6% | 4.3% | 3.8% | 3.8% |
| Y/Y | ||||||||||||
| Net sales | 59.8% | 41.0% | 95.9% | 89.9% | 63.8% | 30.1% | 32.6% | 22.7% | 27.1% | 70.6% | 34.8% | 15.6% |
| Gross profit | 48.8% | 44.0% | 102.6% | 78.9% | 31.2% | 30.5% | 26.1% | 22.4% | 27.3% | 71.0% | 35.6% | 15.6% |
| Operating profit | 74.9% | 53.4% | 187.8% | 150.0% | 25.6% | 31.0% | 23.8% | 24.9% | 31.3% | 108.3% | 26.2% | 16.5% |
| Pre-tax profit | 57.6% | 114.7% | 128.2% | 119.0% | 22.9% | 5.8% | 25.5% | 26.7% | 24.9% | 103.9% | 19.9% | 17.5% |
| Net Profit | 69.1% | 116.6% | 113.2% | 116.5% | 12.3% | 5.6% | 25.2% | 25.1% | 24.5% | 103.6% | 17.2% | 17.6% |
| Q/Q | ||||||||||||
| Net sales | 17.6% | 37.3% | 8.1% | 8.8% | 1% | 9% | 10% | 1% | ||||
| Gross profit | 37.3% | 10.0% | 15.1% | 2.9% | 1% | 9% | 11% | 0% | ||||
| Operating profit | 95.0% | 9.5% | 21.8% | -3.9% | -2% | 14% | 15% | -3% | ||||
| Pre-tax profit | 74.3% | 34.0% | -2.2% | -4.1% | -2% | 15% | 16% | -3% | ||||
| Net Profit | 77.5% | 25.4% | -1.4% | -1.3% | -8% | 18% | 17% | -1% |
© 2026 Citigroup Inc. No redistribution without Citigroup's written permission.
Source: Company Reports, Citi Research Estimates
NT$
702
585
468
351
234
117
Aug 25
Prepared for Kevin Lu
476% Upside
4 50% Upside
NT$ 300.00
• 25% Downside
Bull/Bear: Gigabyte Technology (2376.TW)
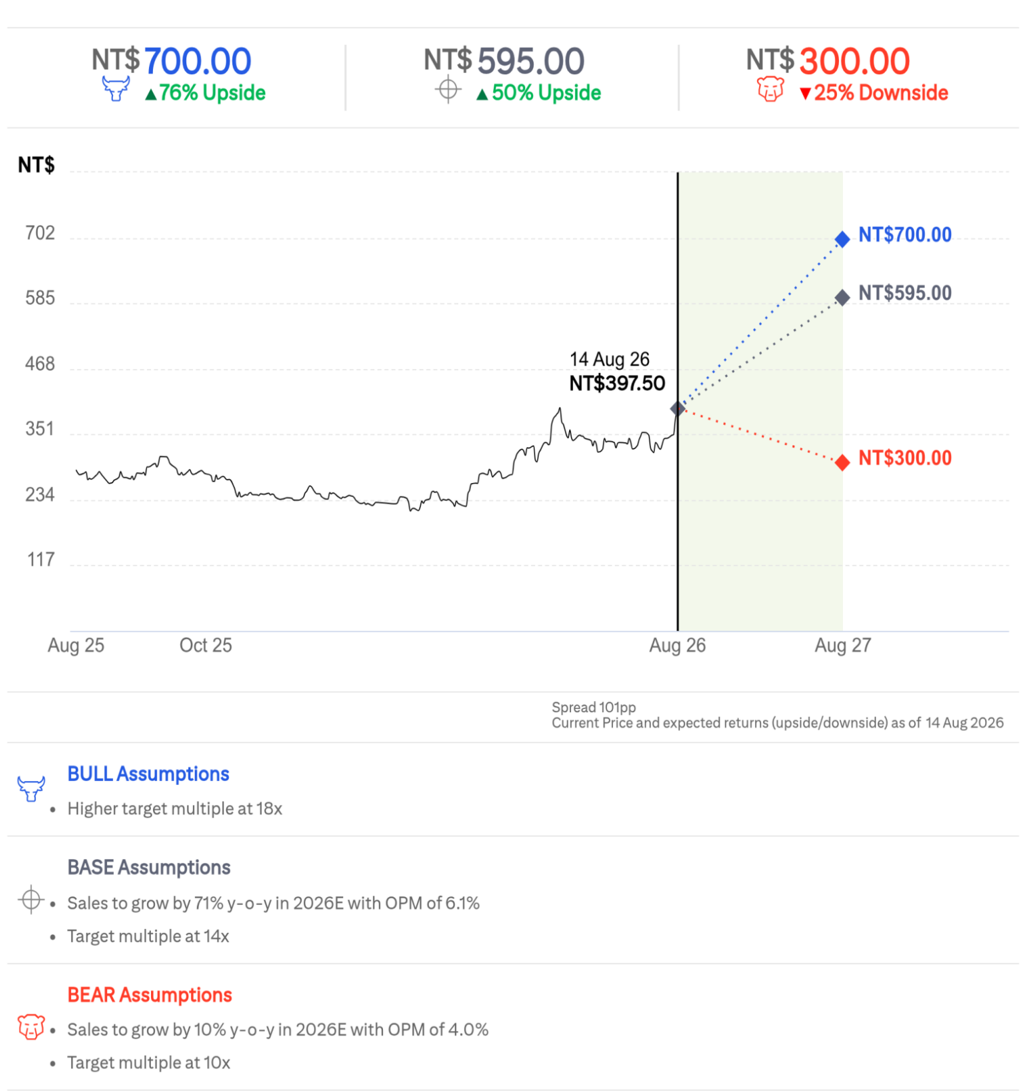
NT$ 595.00
Prepared for Kevin Lu
Gigabyte Technology
Company description
Established in 1986, listed in 1998, and headquartered in Taipei, Taiwan, Gigabyte is a leading designer and manufacturer of technology hardware products including motherboards (MB), graphic cards (VGA), servers/AI servers, as well as PC and peripherals. By shipments, Gigabyte ranks No.2 in MB and VGA globally; for servers, Gigabyte provides HPC/AI servers to tier 2/3 CSPs and SMEs. Gigabyte's primary production facilities are located in Taiwan and China with an extensive distribution network that spans over 100 countries.
Investment strategy
We rate Gigabyte shares as Buy. As a leading motherboard (MB) and graphic cards (VGA) supplier, Gigabyte has successfully pivoted from legacy business to servers/AI servers. By leveraging its strong design and manufacturing capability, as well as early engagement with GPU vendors, we expect Gigabyte's server sales to see robust growth and become a primary revenue and earnings driver for the company. Additionally, the new Nvidia GPU cycle and multiple AAA game title launches scheduled for 2025/26 should also help drive upgrade demand for MB/VGA among gamers. We expect rising server mix and positive momentum in MB/VGA sales to lead to solid earnings for Gigabyte throughout our forecast period.
Valuation
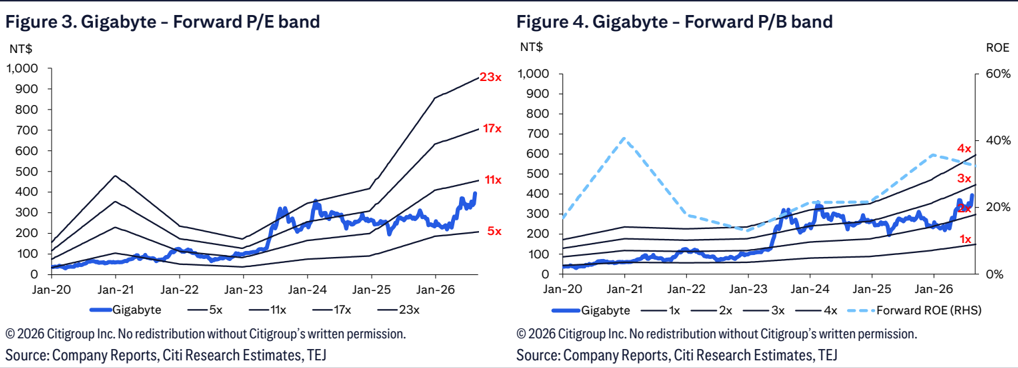
Our target price of NT$595 is based on c.14x 2027E EPS. Our target multiple of 14x is slightly higher than the company's average forward PE since 2023, when the server business started to become a more meaningful driver.
Risks
Key downside risks that could prevent the shares from reaching our target price include: 1) slower-than-expected growth in AI servers; 2) weaker-thanexpected GPU replacement demand; 3) intense peer competition; and 4) tariffs and FX volatility.
If you are visually impaired and would like to speak to a Citi representative regarding the details of the graphics in this document, please call USA 1-888-500-5008 (TTY: 711), from outside the US +1-210-677-3788