PDF 原檔:報告_Citi_巨大9921_20260807_original.pdf
圖片清單(已驗證 2026-08-10)
| 檔名 | size | 分類 | 親眼所見內容 |
|---|---|---|---|
報告_Citi_巨大9921_20260807_001.png |
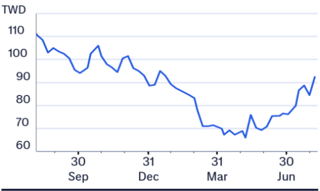
16KB | 真資料圖 | 股價走勢折線圖(TWD 縱軸 60-110,橫軸 Sep-Jun),單線股價走勢 |
報告_Citi_巨大9921_20260807_002.png |
93KB | 真資料圖 | Bull/Base/Bear 目標價情境圖:頂部三個數字卡(NT$125.00 +35% Upside/NT$108.00 +17% Upside/NT$70.00 -24% Downside),下方股價走勢圖延伸出三條虛線分別指向三個目標價,標註現價點「07 Aug 26 NT$92.40」 |
報告_Citi_巨大9921_20260807_003.png |
224KB | 真資料圖 | 上下兩張圖:上圖「Ratings and Target Price History」股價走勢圖疊加 1-12 號評等/目標價變動標記與下方明細表(日期/Rating/Target Price/Closing Price);下圖「Short-Term View/Catalyst Watch Research」股價走勢圖疊加 1-8 號 Catalyst Watch/Short-Term View 動作標記與明細表 |
分類只有三類:
真資料圖/裝飾·logo·banner/文字卡。<40KB 未 Read 者免列(預設 logo);本份報告 3 張候選圖已全數逐張 Read。
原始內容
(RIC: 9921.IW, BB: 992111)
TWD
110
100
90
80
70
60
Prepared for Kevin Lu
07 Aug 2026 15:34:49 ET │ 14 pages
Sep
Dec
Mar
Jun
Giant (9921.TW)
Margins Reset Higher as Fundamentals Turn; Upgrade to Buy, TP NT$108
CITI'S TAKE
We upgrade Ginat to Buy following a substantial 2Q earnings beat driven by stronger-than-expected margin improvement. We believe the margin recovery is sustainable, supported by new products ramp-ups, a richer OB mix, and improving demand from EU and China. Mgmt's FY26 guidance LSD sales decline, 20-21% GPM, 1-3% OPM - appears conservative given the 22.3% GPM achieved in 1H and improving regional trends. We raise our 26-28E EPS by 11-12% and lift TP to NT$108 based on 18.5x NTM P/E. With channel inventory lean, demand gradually recovering and earnings visibility improving, we believe the worst is behind and see an attractive risk/reward.
Upgrade to Buy - margin resilience creates earnings upsides -We upgrade Giant from Neutral to Buy as the key concerns underpinning our previous cautious view are beginning to ease. The substantial 2Q margin beat demonstrates that product mix improvement and new model launches can more than offset still-elevated operating expenses. We expect margins to remain at relatively high levels in 2H26E, supported by continued new product ramp-ups, and improving fundamentals in EU and China.
2Q26 results significantly exceeded expectations on margin expansion -Revenue rose 6% y/y to NT$16.7bn, beating our/BBG est by 6%/5% each. GPM expanded 3.8ppt y/y to 24.2%, higher than our/BBG, driven by a higher own-brand contribution, product mix optimization and strong sales of newly launched models. Despite opex rising 0.5ppy y/y, reflecting product launch, sports sponsorship, and WRO-related legal expenses, OPM improved to 6.0% from 2.8% in 2Q25. Net profits were NT$635mn (+234% y/y), beating our/BBG est by 147%/48% each.
Improving fundamentals yet mgmt. guidance still looks conservative -Mgmt. expects FY26E sales to decline by LSD y/y with GPM of 20-21% and OPM of 1-3%. We see ample upside to this guidance particularly after GPM reached 22.3% in 1H26. EU sales grew in teens y/y in 2Q, supported by successful new model launches, while China also returned to teens growth amid improving demand and healthier channel inventory. Giant expects new OB models to sustain EU growth in 2H despite soft OE demand while China should maintain stable momentum. Although the pace of the industry recovery remains gradual, we believe lean channel inventories and improving sell-through suggest that the downcycle has passed its trough.
Earnings Summary
| Year to 31Dec | Net Profit (NT$M) | DilutedEPS (NT$) | EPSgrowth (%) | P/E (x) | P/B (x) | ROE (%) | Yield (%) |
|---|---|---|---|---|---|---|---|
| 2024A | 1,264 | 3.22 | -62.8 | 28.7 | 1.1 | 3.7 | 2.4 |
| 2025A | 723 | 1.84 | -42.8 | 50.1 | 1.1 | 2.1 | 1.9 |
| 2026E | 1,650 | 4.21 | 128.1 | 22 | 1 | 4.8 | 3.2 |
| 2027E | 2,409 | 6.15 | 46 | 15 | 1 | 6.9 | 4.7 |
| 2028E | 2,894 | 7.38 | 20.1 | 12.5 | 1 | 8 | 5.6 |
Source: Powered by dataCentral
See Appendix A-1 for Analyst Certification, Important Disclosures and Research Analyst Affiliations.
n Buy ↑ from Neutral
Short-Term View: Upside
Price (07 Aug 26 13:30)
NT$92.40
Target price
NT$108.00↑
from NT$74.00
Expected share price return
16.9%
Expected dividend yield
3.1%
Expected total return
20.0%
Market Cap
NT$36,227M
US$1,123M
Price Performance (RIC: 9921.TW, BB: 9921 TT)
Angela Hsu AC
+886-2-8726-9083 angela.hc.hsu@citi.com
Prepared for Kevin Lu
| 9921.TW: Fiscalyearend31-Dec | Price: NT$92.40; TP: NT$108.00; Market Cap:NT$36,227m; Recomm:Buy | Price: NT$92.40; TP: NT$108.00; Market Cap:NT$36,227m; Recomm:Buy | Price: NT$92.40; TP: NT$108.00; Market Cap:NT$36,227m; Recomm:Buy | Price: NT$92.40; TP: NT$108.00; Market Cap:NT$36,227m; Recomm:Buy | Price: NT$92.40; TP: NT$108.00; Market Cap:NT$36,227m; Recomm:Buy | ||||||
|---|---|---|---|---|---|---|---|---|---|---|---|
| Profit&Loss(NT$m) | 2024 | 2025 | 2026E | 2027E | 2028E | Valuation ratios | 2024 | 2025 | 2026E | 2027E | 2028E |
| Sales revenue | 71,279 | 60,254 | 61,170 | 66,682 | 71,582 | PE(x) | 28.7 | 50.1 | 22.0 | 15.0 | 12.5 |
| Cost of sales | -57,745 | -48,317 | -47,218 | -51,255 | -54,763 | PB(x) | 1.1 | 1.1 | 1.0 | 1.0 | 1.0 |
| Gross profit | 13,534 | 11,937 | 13,952 | 15,427 | 16,819 | EV/EBITDA(x) | 9.8 | 10.4 | 8.0 | 7.0 | 6.5 |
| Gross Margin (%) | 19.0 | 19.8 | 22.8 | 23.1 | 23.5 | FCFyield (%) | 29.6 | 26.3 | -3.2 | 1.7 | 5.5 |
| EBITDA(Adj) | 4,394 | 3,635 | 4,418 | 5,309 | 5,791 | Dividend yield (%) | 2.4 | 1.9 | 3.2 | 4.7 | 5.6 |
| EBITDAMargin(Adj) (%) | 6.2 | 6.0 | 7.2 | 8.0 | 8.1 | Payout ratio (%) | 68 | 98 | 70 | 70 | 70 |
| Depreciation | -2,536 | -2,554 | -2,221 | -1,929 | -1,690 | ROE(%) | 3.7 | 2.1 | 4.8 | 6.9 | 8.0 |
| Amortisation | 0 | 0 | 0 | 0 | 0 | Cashflow(NT$m) | 2024 | 2025 | 2026E | 2027E | 2028E |
| EBIT (Adj) | 1,858 | 1,081 | 2,197 | 3,379 | 4,101 | EBITDA | 4,394 | 3,635 | 4,418 | 5,309 | 5,791 |
| EBIT Margin (Adj) (%) | 2.6 | 1.8 | 3.6 | 5.1 | 5.7 | Working capital | 8,568 | 9,237 | -4,723 | -3,807 | -2,648 |
| Net interest | -443 | -292 | -47 | -78 | -134 | Other | -814 | -1,724 | -268 | -278 | -563 |
| Associates | 0 | 0 | 0 | 0 | 0 | Operating cashflow | 12,149 | 11,148 | -573 | 1,223 | 2,581 |
| Non-Op/Except/Other Adj | 942 | 595 | 403 | 338 | 373 | Capex | -1,409 | -1,631 | -600 | -600 | -600 |
| Pre-tax profit | 2,357 | 1,384 | 2,553 | 3,639 | 4,339 | Net acq/disposals | -3,044 | -170 | 0 | 0 | 0 |
| Tax | -877 | -518 | -725 | -1,034 | -1,233 | Other | -1,006 | -140 | 0 | 0 | 0 |
| Extraord./Min.Int./Pref.div. | -216 | -143 | -177 | -195 | -212 | Investing cashflow | -5,460 | -1,940 | -600 | -600 | -600 |
| Reported net profit | 1,264 | 723 | 1,650 | 2,409 | 2,894 | Dividends paid | -1,960 | -994 | -1,155 | -1,687 | -2,026 |
| Net Margin (%) | 1.8 | 1.2 | 2.7 | 3.6 | 4.0 | Financing cashflow | -7,832 | -10,831 | -1,126 | -1,561 | -1,827 |
| CoreNPAT | 1,264 | 723 | 1,650 | 2,409 | 2,894 | Net change in cash | -793 | -1,701 | -2,299 | -937 | 153 |
| Per share data | 2024 | 2025 | 2026E | 2027E | 2028E | Free cashflow to s/holders | 10,740 | 9,517 | -1,173 | 623 | 1,981 |
| Reported EPS($) | 3.22 | 1.84 | 4.21 | 6.15 | 7.38 | ||||||
| Core EPS($) | 3.22 | 1.84 | 4.21 | 6.15 | 7.38 | ||||||
| DPS($) | 2.20 | 1.80 | 2.95 | 4.30 | 5.17 | ||||||
| CFPS($) | 30.99 | 28.43 | -1.46 | 3.12 | 6.58 | ||||||
| FCFPS($) | 27.39 | 24.28 | -2.99 | 1.59 | 5.05 | ||||||
| BVPS($) | 86.10 | 86.88 | 88.31 | 90.57 | 93.40 | ||||||
| Wtdavgordshares(m) | 392 | 392 | 392 | 392 | 392 | ||||||
| Wtdavgdiluted shares (m) | 392 | 392 | 392 | 392 | 392 | ||||||
| Growthrates | 2024 | 2025 | 2026E | 2027E | 2028E | ||||||
| Sales revenue (%) | -7.4 | -15.5 | 1.5 | 9.0 | 7.3 | ||||||
| EBIT (Adj) (%) | -60.5 | -41.8 | 103.2 | 53.8 | 21.4 | ||||||
| CoreNPAT(%) | -62.8 | -42.8 | 128.1 | 46.0 | 20.1 | ||||||
| CoreEPS(%) | -62.8 | -42.8 | 128.1 | 46.0 | 20.1 | ||||||
| BalanceSheet(NT$m) | 2024 | 2025 | 2026E | 2027E | 2028E | ||||||
| Cash&cashequiv. | 14,219 | 13,021 | 10,722 | 9,785 | 9,938 | ||||||
| Accounts receivables | 10,803 | 9,444 | 10,372 | 11,419 | 12,331 | ||||||
| Inventory | 26,290 | 20,242 | 24,057 | 27,285 | 29,427 | ||||||
| Net fixed &other tangibles | 19,435 | 19,099 | 17,478 | 16,148 | 15,058 | ||||||
| Goodwill &intangibles | 990 | 1,002 | 1,002 | 1,002 | 1,002 | ||||||
| Financial &other assets | 6,965 | 6,941 | 6,879 | 7,144 | 7,374 | ||||||
| Total assets | 78,703 | 69,748 | 70,510 | 72,783 | 75,129 | ||||||
| Accounts payable | 5,742 | 5,447 | 5,468 | 5,935 | 6,341 | ||||||
| Short-term debt | 17,780 | 8,225 | 8,225 | 8,225 | 8,225 | ||||||
| Long-term debt | 3,023 | 3,746 | 3,746 | 3,746 | 3,746 | ||||||
| Provisions &other liab | 15,421 | 15,313 | 15,353 | 16,115 | 16,776 | ||||||
| Total liabilities | 41,966 | 32,731 | 32,792 | 34,020 | 35,088 | ||||||
| Shareholders' equity Minority interests | 33,755 2,982 | 34,062 2,955 | 34,621 3,097 | 35,509 3,253 | 36,618 3,422 | ||||||
| Total equity | 36,738 | 37,017 | 37,718 | 38,762 | |||||||
| 6,583 | -1,050 | 1,249 | 2,186 | 40,041 | |||||||
| Net debt (Adj) | 2,033 | ||||||||||
| Net debt to equity (Adj) (%) | 17.9 | -2.8 | 3.3 | 5.6 | 5.1 | ||||||
| For definitions of the items in this | please click here. |
Prepared for Kevin Lu
Earnings revisions and TP change -We raise our earnings estimates 11-12% for 2026-2028E mainly to reflect higher sales assumptions and stronger GPM expansion on back of better product mix, which more than offsets higher opex estimates. We lift TP to NT$108 based on 18.5x 2H26-1H27E P/E, at around the midpoint of its historical trading range. We believe the valuation is justified by the improving earnings trajectory, and better visibility into a gradual industry recovery. Using the mid cycle rather the upper end multiple appropriately reflects the stillslow recovery and lingering uncertainties surrounding US WRO.
Figure 1. Giant: 2Q26 Results Comp
Giant (9921.TW): Result Comparison
| NT$ mn | 2Q26A | 1Q26 | Q/Q | 2Q25 | Y/Y | 2Q26 Citi | Diff | 2Q26 BBG | Diff |
|---|---|---|---|---|---|---|---|---|---|
| Revenue | 16,665 | 12,524 | 33% | 15,754 | 6% | 15,740 | 6% | 15,807 | 5% |
| Grossprofit | 4,040 | 2,459 | 64% | 3,220 | 25% | 3,375 | 20% | 3,406 | 19% |
| Operating profit | 1,000 | -191 | nm | 438 | 128% | 359 | 178% | 612 | 63% |
| Net profit | 635 | -200 | nm | 190 | 234% | 257 | 147% | 430 | 48% |
| BasicEPS (NT$) | 1.62 | -0.51 | nm | 0.48 | 234% | 0.66 | 147% | 1.20 | 35% |
| Ratio | Ratio | Ratio | Ratio | Ratio | Ratio | Ratio | Ratio | Ratio | Ratio |
| Grossmargin(%) | 24.2 | 19.6 | 4.6 | 20.4 | 3.8 | 21.4 | 2.8 | 21.5 | 2.7 |
| Operating margin(%) | 6.0 | (1.5) | nm | 2.8 | nm | 2.3 | nm | 3.9 | nm |
| Net margin(%) | 3.8 | (1.6) | nm | 1.2 | nm | 1.6 | nm | 2.7 | nm |
© 2026 Citigroup Inc. No redistribution without Citigroup's written permission.
Source: Citi Research, Citi Research Estimates, Company Reports, Bloomberg
Figure 2. Giant: Earnings Estimates Revision Summary
| 2026E | 2026E | 2026E | 2027E | 2027E | 2027E | 2028E | 2028E | 2028E | |
|---|---|---|---|---|---|---|---|---|---|
| NT$mn | New | Old | Chg | New | Old | Chg | New | Old | Chg |
| Revenue | 61,170 | 59,966 | 2% | 66,682 | 64,437 | 3% | 71,582 | 69,384 | 3% |
| Grossprofit | 13,952 | 12,621 | 11% | 15,427 | 13,586 | 14% | 16,819 | 14,659 | 15% |
| OPEX | 11,755 | 10,864 | 8% | 12,048 | 10,740 | 12% | 12,718 | 11,218 | 13% |
| Operating profit | 2,197 | 1,756 | 25% | 3,379 | 2,846 | 19% | 4,101 | 3,442 | 19% |
| Pre-tax profit | 2,553 | 2,372 | 8% | 3,639 | 3,366 | 8% | 4,339 | 3,968 | 9% |
| Net profit | 1,650 | 1,489 | 11% | 2,409 | 2,170 | 11% | 2,894 | 2,576 | 12% |
| BasicEPS (NT$) | 4.21 | 3.80 | 11% | 6.15 | 5.54 | 11% | 7.38 | 6.57 | 12% |
| Ratio | New | Old | diff | New | Old | diff | New | Old | diff |
| Grossmargin(%) | 22.8 | 21.0 | 1.8 | 23.1 | 21.1 | 2.1 | 23.5 | 21.1 | 2.4 |
| OPEX to Salesratio (%) | 19.2 | 18.1 | 1.1 | 18.1 | 16.7 | 1.4 | 17.8 | 16.2 | 1.6 |
| Operating margin(%) | 3.6 | 2.9 | 0.7 | 5.1 | 4.4 | 0.7 | 5.7 | 5.0 | 0.8 |
| Net margin(%) | 2.7 | 2.5 | 0.2 | 3.6 | 3.4 | 0.2 | 4.0 | 3.7 | 0.3 |
© 2026 Citigroup Inc. No redistribution without Citigroup's written permission.
Source: Citi Research, Citi Research Estimates
Prepared for Kevin Lu
Adding Upside 30-Day Short-Term View on Giant (9921.TW)
Direction:
Upside
Duration:
Within 30 Days Earnings
Category:
We expect strong margins to sustain into 2H26E driven by ongoing new product ramp-ups and gradual recovery in some key markets such as EU and China. This will likely drive strong earnings upgrades by the Street, potentially boosting positive sentiment on the shares.
NT$
126
84
63
Aug 25
E Sales up 5% YoY in 2026E
• Target P/E of 22x
435% Upside
NT$108.00
17% Upside
Bull/Bear: Giant (9921.TW)
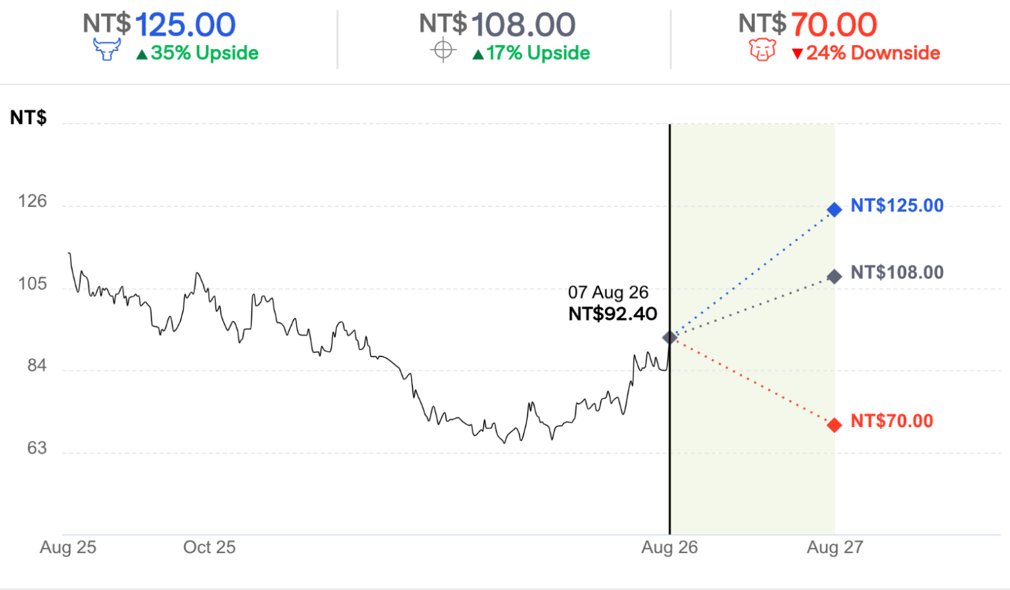
BASE Assumptions
Sales 2-3% YoY in 2026E
• OPM of 3.5-4% in 2026E
• Target P/E of 18.5x
BEAR Assumptions
- 423 · Sales down 0-5% YoY in 2026E · OPM of 2.5% in 2026E
• Target P/E of 15x
Prepared for Kevin Lu
NT$ 70.00
· 24% Downside
Prepared for Kevin Lu
Giant
Company description
Giant was founded in 1972 as an OEM manufacturer initially and established its own brand in 1981, first marketed in Taiwan followed by Europe, North America, and other markets. Giant is now the world's largest bicycle manufacturer with a roughly 4% global market share in terms of unit sales and is also among the world's largest brands. The company is the primary contract manufacturer for the world's largest brand, Trek, and it is the largest brand among high-end bikes in China. Following Trek, Giant brand bikes rank among the Top 3 in the US.
Investment strategy
We have a Buy rating on the shares. Giant's strong 2Q beat, driven by substantial margin improvement, points to meaningful upside to our and BBG estimates. We expect margins to remain at elevated levels in 2H26E, supported by new products ramp-ups and improving fundamentals in EU and China where sales grew in the teens in 2Q26.With channel inventories lean and demand gradually recovering, we believe worst is behind.
Valuation
Our target price for Giant of NT$108 is based on a 2H26-1H27E P/E of 18.5x, setting at the mid circle of the stock's historical range of 14-30x during preCovid years (2014-2019).
Risks
Downside/upside risks that could cause the Giant shares to deviate from our target price: 1) e-bike adoption being slower/faster than expected; 2) prolonged negative/positive impact from inventory correction, 3) China domestic demand turning weak/strengthening; and 4) supply chain disruption from shipping issues.
If the impact on the company from any of these factors differs from our base case expectations, the stock could have difficulty achieving our target price or could increase more than we expect.
If you are visually impaired and would like to speak to a Citi representative regarding the details of the graphics in this document, please call USA 1-888-500-5008 (TTY: 711), from outside the US +1-210-677-3788