PDF 原檔:報告_Citi_亞德客1590_20260728_original.pdf
圖片清單(已驗證 2026-07-29)
| 檔名 | size | 分類 | 親眼所見內容 |
|---|---|---|---|
報告_Citi_亞德客1590_20260728_002.png |
63KB | 真資料圖 | Bull/Bear 目標價情境樹狀圖:現價 NT$1,365 分出三種情境目標價——牛市 NT$2,000(31.5x)、基準 NT$1,750(27.5x)、熊市 NT$1,100(21x),時間軸至 2027 年中 |
報告_Citi_亞德客1590_20260728_003.png |
238KB | 真資料圖 | 兩張疊圖:上圖為 Citi 評等與目標價歷史走勢(2023-2026,含 7 筆調整紀錄表,最新 2026-04-29 目標價 NT$1,750、收盤 NT$1,490);下圖為 Short-Term View/Catalyst Watch 走勢圖(12 筆操作紀錄表) |
報告_Citi_亞德客1590_20260728_001.png |
30KB | (<40KB 未 Read,預設 logo) | — |
原始內容
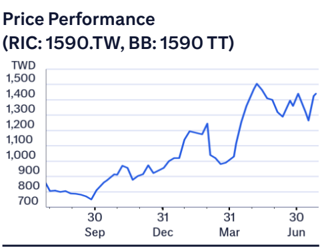
(RIC: 1590.1W, BB: 1590 11)
TWD
1,500
1,400
1,300
1,200
1,100
1,000
900
800
700
Prepared for Kevin Lu
28 Jul 2026 07:48:54 ET │ 13 pages
Sep
Dec
Mar
Jun
Airtac (1590.TW)
2Q26 Beat with Solid OPM; Guidance Raised Again; Buy
CITI'S TAKE
Airtac delivered another broad-based beat in 2Q26, with net income 9%/14% above our/BBG est. The key positive was solid OPM of 35.1%, supported by stronger UT, a better mix and scale benefit, despite an estimated 1.8ppt drag from higher social security expenses. Mgmt raised its FY26 sales/OPM guidance again. While normal seasonality could lead to a q/q decrease in sales in 3Q, we believe continued share gains and new product launches should support a solid 2H26. We raise our earnings est 78% for 26-28E yet keep our PT unchanged at NT$1750 based on 27.5x NTM P/E. Stay Buy.
2Q26 earnings beat our/BBG est by 9%/14%; record OPM despite higher social security costs -Airtac reported 2Q25 net income of NT$3.3bn, up 63% y/y and 24% q/q, topping our/BBG est. Sales rose 36% y/y thanks mostly to a broad-based strong demand across most end-applications. GPM expanded 3.7ppt y/y to 49.7%, exceeding our/BBG forecasts, driven by higher UT, efficiency improvement and better mix. That along with scale benefit offset the negative impact from higher social security costs and drove OPM to reach a record 35.1% since listed.
Guidance raised again; solid 2H26 outlook supported by share gains and new products -Airtac raised its FY26 sales guidance to >20% y/y in RMB terms, up from mid to high teens previously, and lifted OPM guidance to 34% from 33%. Mgmt. expects the overall China ' s pneumatic market to rise mid to high single digit y/y in 2026E, with Airtac potentially delivering an additional 10ppt of growth through continued share gains. Several new products scheduled to launch in 4Q26 including semi-focused pneumatics and three new electrical controller series should provide additional growth drivers, particularly, in the medium term.
Broad-based demand recovery across major end applications -Mgmt expects DD growth across electronics, battery, auto and traditional industries in 2026. Electronics should benefit from smartphone upgrades and AI-related automation investment, while battery growth should extend into 2027 on domestic capacity expansion and ESS investment. Auto growth is supported by share gains while traditional industries benefit from equipment replacement subsidies. Separately, linear guide sales rose 20% y/y in 1H26. UT improved from <20% in 2025, to >40% now and should reach 50% by end-2026, supporting profitability. (continued)
Earnings Summary
| Year to 31Dec | Net Profit (NT$M) | DilutedEPS (NT$) | EPSgrowth (%) | P/E (x) | P/B (x) | ROE (%) | Yield (%) |
|---|---|---|---|---|---|---|---|
| 2024A | 7,624 | 38.12 | 9.4 | 35.8 | 5.7 | 16.8 | 1.5 |
| 2025A | 8,400 | 42 | 10.2 | 32.5 | 5.2 | 16.7 | 2.1 |
| 2026E | 11,909 | 59.55 | 41.8 | 22.9 | 5.3 | 22.8 | 3.0 |
| 2027E | 13,469 | 67.35 | 13.1 | 20.3 | 4.8 | 24.9 | 3.4 |
| 2028E | 15,147 | 75.74 | 12.5 | 18 | 4.5 | 25.8 | na |
Source: Powered by dataCentral
See Appendix A-1 for Analyst Certification, Important Disclosures and Research Analyst Affiliations.
n Buy
Price (28 Jul 26 13:30)
NT$1,365.00
Target price
NT$1,750.00
Expected share price return
28.2%
Expected dividend yield
2.7%
Expected total return
31.0%
Market Cap
NT$273,000M
US$8,452M
Angela Hsu AC
+886-2-8726-9083 angela.hc.hsu@citi.com
Prepared for Kevin Lu
| 1590.TW: Fiscalyearend31-Dec | Price: | NT$1,365.00; TP: NT$1,750.00; MarketCap:NT$273,000m; Recomm:Buy | NT$1,365.00; TP: NT$1,750.00; MarketCap:NT$273,000m; Recomm:Buy | NT$1,365.00; TP: NT$1,750.00; MarketCap:NT$273,000m; Recomm:Buy | NT$1,365.00; TP: NT$1,750.00; MarketCap:NT$273,000m; Recomm:Buy | NT$1,365.00; TP: NT$1,750.00; MarketCap:NT$273,000m; Recomm:Buy | |||||
|---|---|---|---|---|---|---|---|---|---|---|---|
| Profit&Loss(NT$m) | 2024 | 2025 | 2026E | 2027E | 2028E | Valuation ratios | 2024 | 2025 | 2026E | 2027E | 2028E |
| Sales revenue | 30,644 | 34,330 | 44,026 | 49,287 | 54,840 | PE(x) | 35.8 | 32.5 | 22.9 | 20.3 | 18.0 |
| Cost of sales | -16,330 | -18,548 | -22,588 | -25,021 | -27,593 | PB(x) | 5.7 | 5.2 | 5.3 | 4.8 | 4.5 |
| Gross profit | 14,314 | 15,782 | 21,438 | 24,265 | 27,247 | EV/EBITDA(x) | 22.3 | 20.4 | 14.7 | 13.0 | 11.4 |
| Gross Margin (%) | 46.7 | 46.0 | 48.7 | 49.2 | 49.7 | FCFyield (%) | 2.9 | 1.8 | 2.7 | 4.2 | 4.5 |
| EBITDA(Adj) | 12,159 | 13,159 | 18,265 | 20,643 | 23,183 | Dividend yield (%) | 1.5 | 2.1 | 3.0 | 3.4 | na |
| EBITDAMargin(Adj) (%) | 39.7 | 38.3 | 41.5 | 41.9 | 42.3 | Payout ratio (%) | 55 | 68 | 68 | 68 | 0 |
| Depreciation | -2,561 | -2,578 | -3,158 | -3,550 | -3,952 | ROE(%) | 16.8 | 16.7 | 22.8 | 24.9 | 25.8 |
| Amortisation | 0 | 0 | 0 | 0 | 0 | Cashflow(NT$m) | 2024 | 2025 | 2026E | 2027E | 2028E |
| EBIT (Adj) | 9,026 | 10,288 | 15,008 | 17,067 | 19,238 | EBITDA | 11,586 | 12,866 | 18,165 | 20,616 | 23,189 |
| EBIT Margin (Adj) (%) | 29.5 | 30.0 | 34.1 | 34.6 | 35.1 | Working capital | 364 | -3,819 | -5,260 | -3,096 | -2,923 |
| Net interest | 36 | 65 | 63 | 63 | 63 | Other | -1,271 | -1,380 | -3,098 | -3,598 | -4,090 |
| Associates | 0 | 0 | 0 | 0 | 0 | Operating cashflow | 10,678 | 7,667 | 9,808 | 13,923 | 16,176 |
| Non-Op/Except/Other Adj | 573 | 293 | 100 | 27 | -6 | Capex | -2,653 | -2,815 | -2,336 | -2,400 | -3,800 |
| Pre-tax profit | 9,634 | 10,645 | 15,170 | 17,157 | 19,295 | Net acq/disposals | -1,411 | 1,736 | 5 | 0 | 0 |
| Tax | -2,010 | -2,246 | -3,261 | -3,688 | -4,148 | Other | 367 | 109 | 5 | 0 | 0 |
| Extraord./Min.Int./Pref.div. | 0 | 0 | 0 | 0 | 0 | Investing cashflow | -3,696 | -969 | -2,326 | -2,400 | -3,800 |
| Reported net profit | 7,623 | 8,400 | 11,909 | 13,469 | 15,147 | Dividends paid | -3,595 | -4,002 | -8,106 | -9,167 | -10,310 |
| Net Margin (%) | 24.9 | 24.5 | 27.0 | 27.3 | 27.6 | Financing cashflow | -9,518 | -9,429 | -8,081 | -9,167 | -10,310 |
| CoreNPAT | 7,624 | 8,400 | 11,909 | 13,469 | 15,147 | Net change in cash | -2,466 | -2,749 | -510 | 2,355 | 2,067 |
| Per share data | 2024 | 2025 | 2026E | 2027E | 2028E | Free cashflow to s/holders | 8,026 | 4,852 | 7,471 | 11,523 | 12,376 |
| Reported EPS($) | 38.12 | 42.00 | 59.54 | 67.34 | 75.73 | ||||||
| Core EPS($) | 38.12 | 42.00 | 59.55 | 67.35 | 75.74 | ||||||
| DPS($) | 21.14 | 28.59 | 40.53 | 45.84 | 0 | ||||||
| CFPS($) | 53.39 | 38.33 | 49.04 | 69.61 | 80.88 | ||||||
| FCFPS($) | 40.13 | 24.26 | 37.36 | 57.61 | 61.88 | ||||||
| BVPS($) | 239.50 | 262.94 | 259.94 | 281.45 | 305.64 | ||||||
| Wtdavgordshares(m) | 200 | 200 | 200 | 200 | 200 | ||||||
| Wtdavgdiluted shares (m) | 200 | 200 | 200 | 200 | 200 | ||||||
| Growthrates | 2024 | 2025 | 2026E | 2027E | 2028E | ||||||
| Sales revenue (%) | 2.7 | 12.0 | 28.2 | 11.9 | 11.3 | ||||||
| EBIT (Adj) (%) | 2.0 | 14.0 | 45.9 | 13.7 | 12.7 | ||||||
| CoreNPAT(%) | 9.4 | 10.2 | 41.8 | 13.1 | 12.5 | ||||||
| CoreEPS(%) | 9.4 | 10.2 | 41.8 | 13.1 | 12.5 | ||||||
| BalanceSheet(NT$m) | 2024 | 2025 | 2026E | 2027E | 2028E | ||||||
| Cash&cashequiv. | 8,617 | 4,085 | 4,563 | 6,918 | 8,984 | ||||||
| Accounts receivables | 9,719 | 14,395 | 15,421 | 17,366 | 19,228 | ||||||
| Inventory | 6,803 | 6,292 | 11,891 | 13,292 | 14,582 | ||||||
| Net fixed &other tangibles | 30,230 | 30,581 | 30,490 | 29,341 | 29,189 | ||||||
| Goodwill &intangibles | 991 | 954 | 966 | 966 | 966 | ||||||
| Financial &other assets | 1,202 | 1,233 | 317 | 317 | 317 | ||||||
| Total assets | 57,561 | 57,540 | 63,647 | 68,199 | 73,266 | ||||||
| Accounts payable | 1,129 | 1,307 | 2,117 | 2,367 | 2,597 | ||||||
| Short-term debt | 5,611 | 217 | 267 | 267 | 267 | ||||||
| Long-term debt | 0 | 0 | 0 | 0 | 0 | ||||||
| Provisions &other liab | 2,922 | 3,429 | 9,275 | 9,275 | 9,275 | ||||||
| 9,662 | 4,953 | 11,659 | 12,138 | ||||||||
| Total liabilities Shareholders' equity | 47,899 | 52,587 | 51,988 | 11,909 | 61,128 | ||||||
| Minority interests | 0 | 0 | 0 | 56,290 0 | 0 | ||||||
| Total equity | 47,899 | 52,587 | 51,988 | 56,290 | 61,128 | ||||||
| Net debt (Adj) | -3,006 | -3,868 | -4,296 | -6,651 | -8,718 | ||||||
| Net debt to equity (Adj) (%) | -6.3 | -7.4 | |||||||||
| For definitions of the items in this | please click here. | -8.3 | -11.8 | -14.3 |
Prepared for Kevin Lu
Raise 2026-2028E EPS by 8%/7%/7%; keep TP unchanged at NT$1750 -We
raise our sales estimates 5-7% for 2026-2028E, reflecting the stronger 2Q26 results, higher company guidance and a more constructive demand outlook. We also raise our OPM assumptions to factor in stronger utilization, op leverage and continued efficiency improvement. We keep our TP unchanged at NT$1750, based on 27.5x 2H26-1H27E EPS (vs. prior 30x 2Q26-1Q27E). We lower our target multiple to reflect the stock ' s YTD rally and a more normalized valuation as the current upcycle progresses, offsetting the benefit from our earnings upgrades and the rollover of the valuation period. We remain constructive on Airtac ' s broadbased demand recovery, structural market share gains and margin expansion potential. Stay Buy.
Figure 1. Airtac: 2Q26 Results Comparison
| NT$mn | 1Q26A | 2Q25A | 2Q26A | QoQ | YoY | Citi Estimate | Diff. | BBG Consensus | Diff. |
|---|---|---|---|---|---|---|---|---|---|
| Sales | 10,014 | 8,953 | 12,164 | 21% | 36% | 10,942 | 11% | 10,999 | 11% |
| COGS | -5,210 | -4,834 | -6,116 | -5,676 | |||||
| Gross profits | 4,804 | 4,119 | 6,048 | 26% | 47% | 5,266 | 15% | 5,334 | 13% |
| OPEX | -1,479 | -1,387 | -1,783 | -1,493 | |||||
| Operating profits | 3,325 | 2,732 | 4,265 | 28% | 56% | 3,773 | 13% | 3,698 | 15% |
| Total non-opincome | 99 | -162 | -27 | 45 | |||||
| Pre-tax profits | 3,424 | 2,570 | 4,238 | 24% | 65% | 3,818 | 11% | 3,714 | 14% |
| Tax Exp | -753 | -533 | -927 | -792 | |||||
| Net Income | 2,671 | 2,037 | 3,311 | 24% | 63% | 3,026 | 9% | 2,912 | 14% |
| EPS (NT$) | 13.35 | 10.19 | 16.55 | 24% | 63% | 15.13 | 9% | 15.07 | 10% |
| Margins | |||||||||
| GPM | 48.0% | 46.0% | 49.7% | 1.7ppt | 3.7ppt | 48.1% | 1.6ppt | 48.5% | 1.2ppt |
| OPM | 33.2% | 30.5% | 35.1% | 1.9ppt | 4.5ppt | 34.5% | 0.6ppt | 33.6% | 1.4ppt |
| OPEX Ratio | 14.8% | 15.5% | 14.7% | -0.1ppt | -0.8ppt | 13.6% | 1.0ppt | 14.9% | -0.2ppt |
| Net Margin | 26.7% | 22.8% | 27.2% | 0.5ppt | 4.5ppt | 27.7% | -0.4ppt | 26.5% | 0.7ppt |
© 2026 Citigroup Inc. No redistribution without Citigroup's written permission.
Source: Company Reports, Bloomberg, Citi Research, Citi Research Estimates
Figure 2. Airtac: Earnings Estimates Revision
| 2026E | 2026E | 2026E | 2027E | 2027E | 2027E | 2028E | 2028E | 2028E | |
|---|---|---|---|---|---|---|---|---|---|
| NT$ mn | New | Old | Chg | New | Old | Chg | New | Old | Chg |
| Revenue | 44,026 | 41,189 | 7% | 49,287 | 46,869 | 5% | 54,840 | 52,089 | 5% |
| Grossprofit | 21,438 | 19,735 | 9% | 24,265 | 22,646 | 7% | 27,247 | 25,399 | 7% |
| Operating profit | 15,008 | 13,806 | 9% | 17,067 | 15,900 | 7% | 19,238 | 17,902 | 7% |
| Pre-tax profit | 15,170 | 14,036 | 8% | 17,157 | 15,990 | 7% | 19,295 | 17,959 | 7% |
| Net profit | 11,909 | 11,060 | 8% | 13,469 | 12,601 | 7% | 15,147 | 14,152 | 7% |
| BasicEPS (NT$) | 59.55 | 55.30 | 8% | 67.35 | 63.00 | 7% | 75.74 | 70.76 | 7% |
| Ratio | New | Old | diff | New | Old | diff | New | Old | diff |
| Grossmargin(%) | 48.7 | 47.9 | 0.8 | 49.2 | 48.3 | 0.9 | 49.7 | 48.8 | 0.9 |
| Operating margin(%) | 34.1 | 33.5 | 0.6 | 34.6 | 33.9 | 0.7 | 35.1 | 34.4 | 0.7 |
| Net margin(%) | 27.1 | 26.9 | 0.2 | 27.3 | 26.9 | 0.4 | 27.6 | 27.2 | 0.5 |
© 2026 Citigroup Inc. No redistribution without Citigroup's written permission.
Source: Citi Research, Citi Research Estimates
NT$
2,004
1,670
1,336
1,002
668
Jul 25
NT$ 1,100.00
• 19% Downside
NT$1,750.00
4 47% Upside
NT$ 1,750.00
< 28% Upside
Bull/Bear: Airtac (1590.TW)
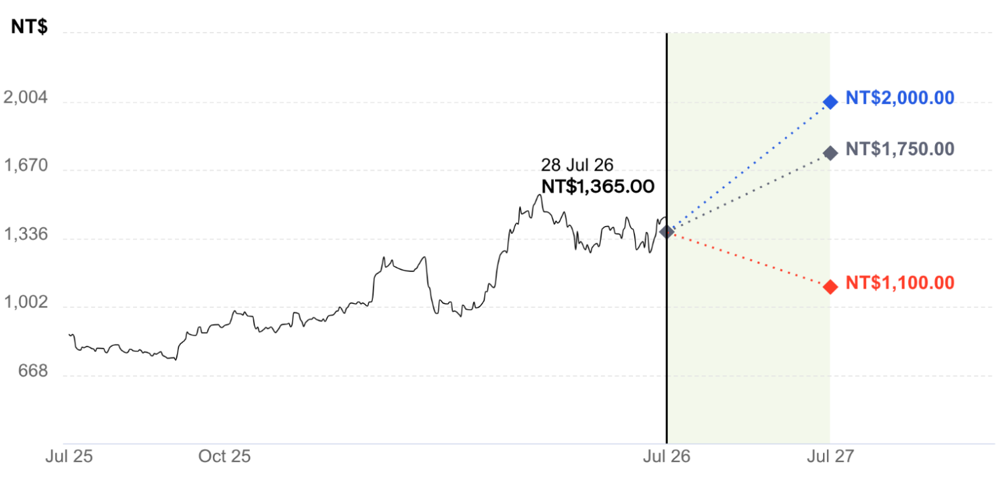
• Target multiple of 31.5x
BASE Assumptions
• Sales growth of >20% YoY in 2026E
• OPM of 34% in 2026E
• Target multiple of 27.5x
BEAR Assumptions
- Y3 • Sales growth of 10-15% YoY in 2026E
• OPM of 30% in 2026E
• Target multiple of 21x
Prepared for Kevin Lu
Prepared for Kevin Lu
Airtac
Company description
Airtac is the second-largest pneumatic component supplier in China, accounting for a 30% market share as of 2025, according to the company. It manufactures and sells pneumatic components including cylinders, filter regulator lubricators, air and mechanical valves, and linear guides under the AirTAC brand, which are used in automated production applications across a wide range of industries including electronics, battery, machinery, packaging, and automotive.
Investment strategy
We have a Buy rating on Airtac as: 1) we view it as a major beneficiary of a secular FA automation trend in China, which should drive a multi-year growth trajectory; 2) we expect its quality products with competitive pricing to drive more share gains in the pneumatics market during macr uncertainties; and 3) we think their expansion into the application for semi industry will further unlock its growth potential in the next 2-3 years.
Valuation
We derive our target price of NT$1,750 for Airtac by using a P/E methodology, as we believe the margin and earnings growth outlooks will be the key drivers of the stock. We apply a P/E of 27.5x for 2H26-1H27E, which we derive from the mid range of prior upcycle valuation 25-35x during 2021 in view of a strong upcycle with solid FA demand and ongoing share gains.
Risks
Key downside risks that could impede the Airtac stock from reaching our target price include: 1) a softer-than-expected China macro economy, resulting in downside to our sales forecasts; 2) intensifying competition leading to gross margin pressures; and 3) slower-than-expected progress of its linear guide business, causing low utilization of capacity.
If you are visually impaired and would like to speak to a Citi representative regarding the details of the graphics in this document, please call USA 1-888-500-5008 (TTY: 711), from outside the US +1-210-677-3788