PDF 原檔:報告_Citi_世芯3661_20260814_original.pdf
圖片清單(已驗證 2026-08-17)
| 檔名 | size | 分類 | 親眼所見內容 |
|---|---|---|---|
260814_citi_alchip_002.png |
140KB | 真資料圖 | Forward P/E band(Figure 3,15.0x-50.1x 多線帶狀圖)與 Forward P/B band & ROE(Figure 4,2.8x-7.7x + ROE 紅線)雙圖並列,橫軸 Jan-12 至 2026 |
260814_citi_alchip_003.png |
113KB | 真資料圖 | Bull/Base/Bear 目標價情境圖:Bull NT$7,000(+66%)、Base NT$6,800(+62%)、Bear NT$4,000(-5%),標示 14 Aug 26 收盤 NT$4,210 |
260814_citi_alchip_004.png |
244KB | 真資料圖 | Citi「Ratings and Target Price History」與「Short-Term View/Catalyst Watch Research」雙圖,含歷次評等/目標價異動日期表(2023-08 至 2026-05,最新 TP NT$6,200→隱含本次再上調至 6,800) |
260814_citi_alchip_001.png |
21KB | 未驗證(<40KB,預設 logo) | — |
分類只有三類:
真資料圖/裝飾·logo·banner/文字卡。<40KB 未 Read 者免列(預設 logo)。
原始內容
(RIC: 3661.1W, BB: 366111)
TWD
5,000
4,500
4,000
3,500
3,000
2,500
Prepared for Kevin Lu
14 Aug 2026 08:26:56 ET │ 15 pages
Sep
Dec
Mar
Jun
Alchip (3661.TW)
The worst in the past, better visibility with new product cycle
CITI'S TAKE
Despite 2Q26 result miss, Alchip is positive on 2H momentum as its key 3nm AI accelerator moves into volume production. 2Q26 revenue reached US$242mn, +83% QoQ, with 3nm/2nm contribution rising to 47% from 21% in 1Q as the new accelerator began ramping in late May. Management expects another meaningful revenue step-up in 3Q followed by sequential growth in 4Q, and believes momentum can extend for at least the next three to four years. Importantly, visibility is increasingly supported by secured follow-on generations rather than a single product cycle: the current 3nm accelerator is ramping, its 2nm successor is in final implementation, automotive projects remain strong, and two CPU programs are already in mass production. Reiterate Buy with TP NT$6,800.
3nm Ramp, 2nm Tape-Out and Broader Pipeline -The current 3nm AI accelerator already in production and is expected to ramp sequentially in 2H26. Management indicated that almost all orders for this year's program have already been placed, leaving 2026 expectations largely unchanged; importantly, 2027 shipment/revenue assumptions now have upside potential. We are looking for US$1.6bn/US$3.8bn for its AI ASIC revenue in 2026/2027. The next-generation 2nm accelerator has entered final implementation and remains on track for tape-out by year-end, with production targeted around end-2027. Management expects both ASP and shipment scale to exceed the 3nm generation given higher chip complexity and content value. Beyond AI accelerators, Alchip has secured the next two generations of a major Chinese automotive ADAS program, while two CPU projects are already in mass production with shipments increasing meaningfully.
Competitive Landscape - COT Shift Strengthens Alchip's Position. Management sees the industry's transition from full stack ASIC service toward COT as a structural trend as hyperscalers seek greater design control and lower cost. This potentially expands Alchip's addressable market as CSPs increasingly separate compute die, I/O chiplet, packaging and manufacturing decisions rather than relying on one turnkey ASIC vendor. Alchip argues that its differentiation lies in complex physical design, schedule execution and advanced packaging integration. For its existing major AI customer, management emphasized that Alchip remains the design partner for the next-generation accelerator. Management also believes its advancedpackaging track record differentiates it from Asian peers, while its ability to support both CoWoS and EMIB-T approaches provides additional flexibility .
Earnings Summary
| Year to 31Dec | Net Profit (NT$M) | DilutedEPS (NT$) | EPSgrowth (%) | P/E (x) | P/B (x) | ROE (%) | Yield (%) |
|---|---|---|---|---|---|---|---|
| 2024A | 6,446 | 79.05 | 81.7 | 53.3 | 8.6 | 22.4 | 0.9 |
| 2025A | 5,598 | 67.68 | -14.4 | 62.2 | 8.4 | 14 | 0.8 |
| 2026E | 9,509 | 114.85 | 69.7 | 36.7 | 6.8 | 20.9 | 1.4 |
| 2027E | 16,027 | 193.57 | 68.5 | 21.7 | 5.2 | 27.5 | 2.4 |
| 2028E | 24,560 | 296.63 | 53.2 | 14.2 | 3.8 | 31.2 | 3.5 |
Source: Powered by dataCentral
See Appendix A-1 for Analyst Certification, Important Disclosures and Research Analyst Affiliations.
n Buy
| Short-Term View: Upside,expires05-OCT-26 | Short-Term View: Upside,expires05-OCT-26 |
|---|---|
| Price (14Aug2613:30) | NT$4,210.00 |
| Target price | NT$6,800.00↑ |
| fromNT$6,200.00 | |
| Expected share price return | 61.5% |
| Expected dividend yield | 0.8% |
| Expected total return | 62.3% |
| MarketCap | NT$362,922M |
| US$11,291M |
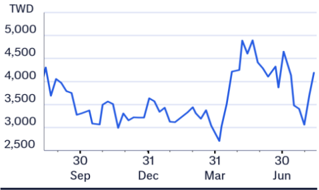
Price Performance (RIC: 3661.TW, BB: 3661 TT)
Laura (Chia Yi) Chen AC
+886-2-8726-9090 laura.cy.chen@citi.com
Jack Chen +886-2-8726-9091 jack1.chen@citi.com
Nicholas Lai +886-2-8726-9093 nicholas.lai@citi.com
Prepared for Kevin Lu
| 3661.TW: Fiscalyearend31-Dec | Price: NT$4,210.00; | TP: NT$6,800.00; MarketCap:NT$362,922m; Recomm:Buy | TP: NT$6,800.00; MarketCap:NT$362,922m; Recomm:Buy | TP: NT$6,800.00; MarketCap:NT$362,922m; Recomm:Buy | TP: NT$6,800.00; MarketCap:NT$362,922m; Recomm:Buy | TP: NT$6,800.00; MarketCap:NT$362,922m; Recomm:Buy | |||||
|---|---|---|---|---|---|---|---|---|---|---|---|
| Profit&Loss(NT$m) | 2024 | 2025 | 2026E | 2027E | 2028E | Valuation ratios | 2024 | 2025 | 2026E | 2027E | 2028E |
| Sales revenue | 51,969 | 30,926 | 53,778 | 126,344 | 207,694 | PE(x) | 53.3 | 62.2 | 36.7 | 21.7 | 14.2 |
| Cost of sales | -41,768 | -22,772 | -38,821 | -98,712 | -163,481 | PB(x) | 8.6 | 8.4 | 6.8 | 5.2 | 3.8 |
| Gross profit | 10,201 | 8,154 | 14,957 | 27,632 | 44,214 | EV/EBITDA(x) | 40.7 | 43.6 | 25.8 | 13.6 | 8.2 |
| Gross Margin (%) | 19.6 | 26.4 | 27.8 | 21.9 | 21.3 | FCFyield (%) | 0.5 | 2.8 | 4.2 | 7.4 | 11.2 |
| EBITDA(Adj) | 8,439 | 7,594 | 12,432 | 22,120 | 32,818 | Dividend yield (%) | 0.9 | 0.8 | 1.4 | 2.4 | 3.5 |
| EBITDAMargin(Adj) (%) | 16.2 | 24.6 | 23.1 | 17.5 | 15.8 | Payout ratio (%) | 46 | 51 | 52 | 52 | 49 |
| Depreciation | -1,943 | -2,577 | -2,200 | -3,600 | -3,600 | ROE(%) | 22.4 | 14.0 | 20.9 | 27.5 | 31.2 |
| Amortisation | 0 | 0 | 0 | 0 | 0 | Cashflow(NT$m) | 2024 | 2025 | 2026E | 2027E | 2028E |
| EBIT (Adj) | 6,496 | 5,017 | 10,232 | 18,520 | 29,218 | EBITDA | 8,439 | 7,594 | 12,432 | 22,120 | 32,818 |
| EBIT Margin (Adj) (%) | 12.5 | 16.2 | 19.0 | 14.7 | 14.1 | Working capital | -4,825 | 3,645 | 2,819 | 7,911 | 12,828 |
| Net interest | 1,194 | 1,583 | 1,124 | 1,200 | 1,200 | Other | 135 | 750 | -199 | -3,574 | -6,021 |
| Associates | -3 | -1 | -28 | -28 | -28 | Operating cashflow | 3,749 | 11,989 | 15,052 | 26,457 | 39,625 |
| Non-Op/Except/Other Adj | 121 | 121 | 496 | 496 | 496 | Capex | -1,998 | -2,287 | -580 | -580 | -580 |
| Pre-tax profit | 7,808 | 6,720 | 11,824 | 20,188 | 30,886 | Net acq/disposals | -652 | -880 | 545 | 0 | 0 |
| Tax | -1,362 | -1,124 | -2,309 | -4,145 | -6,311 | Other | 0 | 0 | 0 | 0 | 0 |
| Extraord./Min.Int./Pref.div. | -1 | 2 | -7 | -16 | -16 | Investing cashflow | -2,651 | -3,167 | -35 | -580 | -580 |
| Reported net profit | 6,446 | 5,598 | 9,509 | 16,027 | 24,560 | Dividends paid | -1,818 | -2,946 | -2,805 | -4,810 | -8,132 |
| Net Margin (%) | 12.4 | 18.1 | 17.7 | 12.7 | 11.8 | Financing cashflow | 14,979 | -4,170 | -28 | 0 | 0 |
| CoreNPAT | 6,446 | 5,598 | 9,509 | 16,027 | 24,560 | Net change in cash | 16,077 | 4,652 | 14,989 | 25,877 | 39,045 |
| Per share data | 2024 | 2025 | 2026E | 2027E | 2028E | Free cashflow to s/holders | 1,751 | 9,702 | 14,472 | 25,877 | 39,045 |
| Reported EPS($) | 79.05 | 67.68 | 114.85 | 193.57 | 296.63 | ||||||
| Core EPS($) | 79.05 | 67.68 | 114.85 | 193.57 | 296.63 | ||||||
| DPS($) | 36.24 | 34.51 | 59.18 | 100.04 | 146.51 | ||||||
| CFPS($) | 45.98 | 144.93 | 181.79 | 319.54 | 478.58 | ||||||
| FCFPS($) | 21.47 | 117.28 | 174.79 | 312.53 | 471.57 | ||||||
| BVPS($) | 489.23 | 502.01 | 618.65 | 815.83 | 1,117.98 | ||||||
| Wtdavgordshares(m) | 79.0 | 80.9 | 80.9 | 80.9 | 80.9 | ||||||
| Wtdavgdiluted shares (m) | 81.5 | 82.7 | 82.8 | 82.8 | 82.8 | ||||||
| Growthrates | 2024 | 2025 | 2026E | 2027E | 2028E | ||||||
| Sales revenue (%) | 70.5 | -40.5 | 73.9 | 134.9 | 64.4 | ||||||
| EBIT (Adj) (%) | 72.7 | -22.8 | 104.0 | 81.0 | 57.8 | ||||||
| CoreNPAT(%) | 93.8 | -13.1 | 69.9 | 68.5 | 53.2 | ||||||
| CoreEPS(%) | 81.7 | -14.4 | 69.7 | 68.5 | 53.2 | ||||||
| BalanceSheet(NT$m) | 2024 | 2025 | 2026E | 2027E | 2028E | ||||||
| Cash&cashequiv. | 27,044 | 32,627 | 47,597 | 73,474 | 112,519 | ||||||
| Accounts receivables | 5,730 | 3,011 | 10,807 | 21,866 | 37,633 | ||||||
| Inventory | 8,661 | 6,945 | 23,226 | 43,219 | 67,315 | ||||||
| Net fixed &other tangibles | 2,045 | 2,225 | 929 | 374 | 101 | ||||||
| Goodwill &intangibles assets | 481 | 553 | 553 | 553 | 553 | ||||||
| Financial &other | 6,349 | 12,677 | 36,421 | 70,102 | 118,123 | ||||||
| Total assets | 50,309 | 58,039 | 119,533 | 209,589 | 336,243 | ||||||
| Accounts payable | 1,826 | 1,986 | 7,272 | 14,793 | 25,166 | ||||||
| Short-term debt | 0 | 0 | 0 | 0 | 0 | ||||||
| Long-term debt | 0 | 0 | 0 | 0 | 0 | ||||||
| Total liabilities | 10,833 | 17,214 | 69,222 | 143,234 | 245,313 | ||||||
| Minority interests | 21 | 19 | 26 | 42 | |||||||
| 39,477 | 50,312 | 66,355 | 58 | ||||||||
| Total equity | -27,044 | 40,824 -32,627 | 90,931 | ||||||||
| Net debt (Adj) | -47,597 | -73,474 | -112,519 | ||||||||
| Net debt to equity (Adj) (%) | -68.5 | -79.9 | -94.6 | -110.7 | |||||||
| For definitions of the items in this table, | please click here. | -123.7 |
Figure 1. Alchip - 2026 results overview
2Q26
2,662
34.8%
1,646
21.5%
1,638
20.25
1Q26
(NT$mn)
Revenue
Gross profit
Gross margin
Op. profit
OP margin
Net income
EPS (NTS)
2,101
50.2%
1,368
32.7%
1,428
17.65
0/0
82%
27%
-15.3 ppt
20%
-11.1 ppt|
15%
15%
2Q25
Actual
9,144
1,887
20.6%
1,150
12.6%
1,324
16.37
Y/Y
-16%
41%
+14.2 ppt
43%
+9.0ppt
24%
24%
@ 2026 Citioroun Inc. No redistribution without Citioroun's written nermission.
Prepared for Kevin Lu
2Q26
Citi
6,029
2,613
43.3%
2,191
36.3%
2,040
Diff.
27%
2%
-8.5 ppt
-25%
-14.8 ppt
-20%
Diff.
-17%
-7%
+3.8 ppt
-17%
-0.1 ppt
-11%
Existing Customer Secured; Next Major CSP Opportunity Emerging -Alchip
believes its existing CSP relationship is increasingly sticky after multiple generations of cooperation, with the customer already assigning it the next few generational designs and architectures. Customer concentration nevertheless remains high, and management acknowledged that meaningful diversification requires winning another major hyperscaler, we believe is Google as it is the biggest AI ASIC customer with large volume. As CSPs increasingly adopt COT and multivendor sourcing, Alchip expects additional opportunities across compute-die design, KGD and packaging integration, supporting management's expectation for AI-related growth broadly in line with key customers through 2029.
Maintaining Buy, TP NT$6,800 -Given higher ASP, more value added from Alchip and also remaining strong capex expansion from its major CSP customers, we lift our earnings projection for Alchip by 11%/15%/32% for 2026/2027/2028. We maintain Buy on Alchip with higher target price NT$6,800 (from NT$6,200), based on 35x of our 2027 EPS estimate. We lower our target PER from 37x to 35x to reflect recent market uncertainties.
Figure 1. Alchip - 2Q26 results overview
© 2026 Citigroup Inc. No redistribution without Citigroup's written permission.
Source: Citi Research, Bloomberg, Company Reports
Figure 2. Alchip - Estimates Revisions
| 2026E | 2026E | 2026E | 2027E | 2027E | 2027E | 2028E | 2028E | 2028E | |
|---|---|---|---|---|---|---|---|---|---|
| (NT$mn) | New | Old | Chg. | New | Old | Chg. | New | Old | Chg. |
| Sales | 53,778 | 35,401 | 52% | 126,344 | 105,120 | 20% | 207,694 | 155,878 | 33% |
| YoYgrowth | 74% | 14% | 135% | 197% | 64% | 48% | |||
| Gross profit | 14,957 | 12,030 | 24% | 27,632 | 23,507 | 18% | 44,214 | 33,042 | 34% |
| Opex | 4,725 | 2,937 | 61% | 9,112 | 7,582 | 20% | 14,996 | 11,244 | 33% |
| Operating profit | 10,232 | 9,094 | 13% | 18,520 | 15,925 | 16% | 29,218 | 21,798 | 34% |
| Pre-tax profit | 11,824 | 10,686 | 11% | 20,188 | 17,593 | 15% | 30,886 | 23,466 | 32% |
| Net income | 9,509 | 8,533 | 11% | 16,027 | 13,969 | 15% | 24,560 | 18,597 | 32% |
| EPS(NT$) | 114.85 | 103.06 | 11% | 193.57 | 168.72 | 15% | 296.63 | 224.61 | 32% |
| Gross margin | 27.8% | 34.0% | -6.2 ppt | 21.9% | 22.4% | -0.5 ppt | 21.3% | 21.2% | +0.1 ppt |
| Opexratio | 8.8% | 8.3% | +0.5 ppt | 7.2% | 7.2% | -0.0 ppt | 7.2% | 7.2% | +0.0ppt |
| Operating margin | 19.0% | 25.7% | -6.7 ppt | 14.7% | 15.1% | -0.5 ppt | 14.1% | 14.0% | +0.1 ppt |
| Net margin | 17.7% | 24.1% | -6.4 ppt | 12.7% | 13.3% | -0.6 ppt | 11.8% | 11.9% | -0.1 ppt |
© 2026 Citigroup Inc. No redistribution without Citigroup's written permission.
Source: Citi Research
2Q26
Cons.
9,192
2,855
31.1%
1,992
Figure s. Alchip - Forecast summary
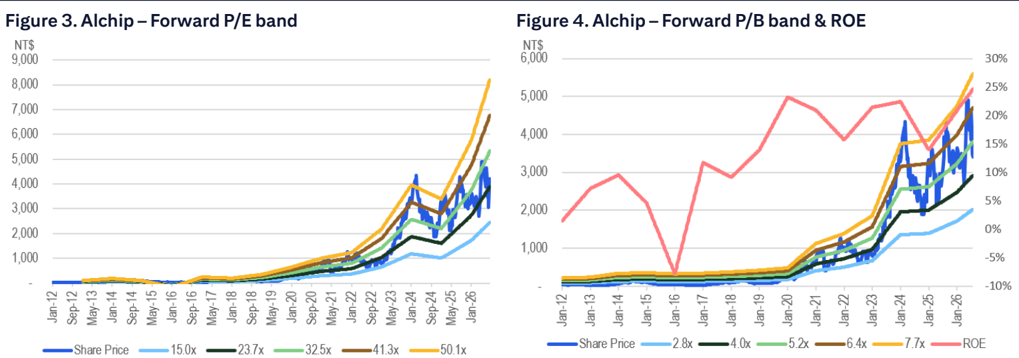
Figure 3. Alchip - Forward P/E band
Alchip
NT$
9,000
Revenue
COGS
8,000
Depreciation costs
Gross Profit
7,000
Operating Expense
SG&A expenses
6,000
R&D expenses
EBIT
5,000
Pre-Tax Profit
4,000
Tax
Net Profit
3,000
EPS - diluted (NT$)
Margins (%)
2,000
Gross Margin
Operating Margin
1,000
Net Margin
Sequential Growth (%)
Revenue
Gross Profit
May-13
Sep-12
Jan-12
EBIT
Net Profit
EPS
— Share Price -
C 2026 Citigroun Inc. No redistribution without Citigroun's written nermission.
@ 2026 Citioroun Inc. No redistribution without Citjoroun's written nermission.
-789
2,429
-934
-249
-467
1,494
1,793
30
6,570
-4,729
-578
1,841
-684|
-233
-453
1,157
1,591
2025
20
9,144
-7,257
-543
1,887
-737
-251|
-494
1,150
1,599
4Q
4,727
-2,730
-667|
1,997
-782
-197
-417
1,215
1,737
10
4,187
-2,086
-400
2,101
-733
-251
-482
1,368
1,784
2026
20
7,640
-4.978
-500
2,662
-1,016
-382
-634
1,646
2,035
30E
19.558
-14,913
-600
4,645
-1,408
-528
-880|
3,237
3,654
6,000
Figure 4. Alchip - Forward P/B band & ROt
NT$
40E
22,393
-16,844
-700
5,000
5,549
-1,567
-560
4,000
-1,008
3,981
3,000
4,323
10E
24,632
-19,372
-900
5,260
-1,798
-739
-1,059
3,462
3,878
2027
2QE
30,268
-23,928
-900
6,341
-2,058
-757
-1,302
4.283
4,700
30E
34,081
-26,553
-900
7,528
-2,454
-920|
5,074
5,491
4QE
37,363
-28,860
-900
8,503
-2,802
-1,121
-1,681
5,701
6,119
2025
30,926
-22,772
-2,577
8,154
-3,138
-930
-1,831
5,017
6,720
2026E
53,778
-38,821
-2,200
14,957
-4,725
-1,721
-3,004
10,232
11,824
2027E
126,344
-98,712
-3,600
27,632
-9,112
-3,537
-5,576
18,520
20,188
30%
2028E
-3,600
44,214
20%
-14,996
15%
-5,824
-9,171
10%
29,218
30,886
© 2026 Citigroup Inc. No redistribution without Citigroup's written permission.
Source: Citi Research, Company Reports
Figure 5. Alchip - Forecast summary
© 2026 Citigroup Inc. No redistribution without Citigroup's written permission.
Source: Citi Research, Company Reports
© 2026 Citigroup Inc. No redistribution without Citigroup's written permission.
Source: Citi Research, Company Reports
Prepared for Kevin Lu
Prepared for Kevin Lu
Short-Term View on Alchip (3661.TW)
Direction:
Upside
Duration:
Within 90 Days (expires 05 Oct 2026)
Date Added:
06 Jul 2026
Category:
Thematic driven
We expect Alchip to see better revenues momentum as its client's N3 AI accelerator starts to ramp up from 2H26 to support its share price performance.
NT$
7,002
5,835
4,668
3,501
2,334
Aug 25
• New projects wins from exist or new customers
4 66% Upside
NT$ 6,800.00
4 62% Upside
Bull/Bear: Alchip (3661.TW)
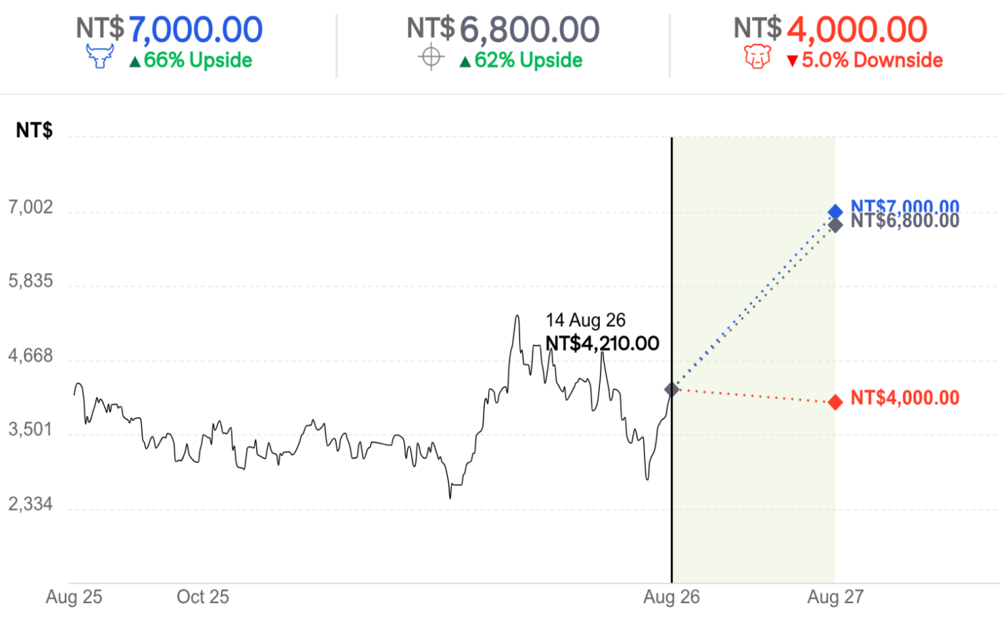
BASE Assumptions
• Sales 2025-28E CAGR of around +50%
- BEAR Assumptions
i • Slower-than-expected NRE projects and revenue contribution
• Capacity constraint at advanced packaging
- More competition from its peers or/and insourcing at their customers
Prepared for Kevin Lu
NT$ 4,000.00
- 5.0% Downside
Prepared for Kevin Lu
Alchip
Company description
Alchip is a leading provider of silicon design and manufacturing service, specializing in ASIC (Application-Specific Integrated Circuit) design, development, and production. Founded in 2003, the company has >1,000 employees and operates in Taipei, Shanghai, Japan, Korea, and the US. Alchip serves a wide range of industries, including automotive, industrials, consumer electronics, and computing.
Investment strategy
We rate Alchip as Buy. We expect Alchip to deliver a strong snapback in 2026/27 with its N3 project ramping up. Moreover, we are also positive over the long-term growth opportunity from its AI ASIC projects with its major CSP client. Alchip remains one of the few design service providers within TSMC's 3DFabric alliance. In our view, if CSPs work more aggressively on their internal design and become more competitive on product offerings, Alchip would be well positioned as a back-end/turnkey partner.
Valuation
Our target price for Alchip of NT$6,800 is based on 35x 2027E EPS. 35x target PER is largely in line with its historical 3-year PER range, which we see as justified on account of strong growth potential of its AI ASIC projects with its key CSP client, with better project cycle and strong growth momentum resuming next year. Our target price equates to 2026/27E P/B of 11x/8x.
Risks
Key downside risks to our target price include: 1) slower-than-expected NRE projects and revenue contributions; 2) capacity constraints at advanced packaging; and 3) more competition and/or insourcing by customers.
If you are visually impaired and would like to speak to a Citi representative regarding the details of the graphics in this document, please call USA 1-888-500-5008 (TTY: 711), from outside the US +1-210-677-3788