PDF 原檔:報告_Citi_世界先進5347_20260804_original.pdf
圖片清單(已驗證 2026-08-06)
| 檔名 | size | 分類 | 親眼所見內容 |
|---|---|---|---|
報告_Citi_世界先進5347_20260804_002.png |
156KB | 真資料圖 | 左:Figure 3 Forward P/E band(NT$,2010-2026,10.8x/14.9x/19.0x/23.0x/27.1x 五線帶);右:Figure 4 Forward P/B band & ROE(0.6x-4.0x 五線帶+ROE% 折線) |
報告_Citi_世界先進5347_20260804_003.png |
102KB | 真資料圖 | 90 天股價情境卡:Bull NT$200.00(+29%)/Base NT$185.00(+20%)/Bear NT$120.00(-22%),下方附股價走勢圖(04 Aug 26 收盤 NT$154.50 標記點+未來 90 天三情境虛線) |
報告_Citi_世界先進5347_20260804_004.png |
230KB | 真資料圖 | 上:Ratings and Target Price History 走勢圖+評等/目標價異動表(07-Nov-23~05-May-26,12 筆紀錄,最新 05-May-26 TP NT$170);下:Short-Term View/Catalyst Watch 走勢圖+異動表 |
報告_Citi_世界先進5347_20260804_001.png |
16.7KB | 裝飾·banner | 股價走勢小圖(<40KB,未逐張細驗,依慣例列為裝飾/低資訊量圖) |
原始內容
(RIC: 5346.1WO, BB: 534611)
TWD
200
180
160
140
120
100
80
Prepared for Kevin Lu
04 Aug 2026 10:02:44 ET │ 15 pages
Sep
Dec
Mar
Jun
Vanguard International Semi. (5347.TWO)
Tight capacity reinforces pricing upside
CITI'S TAKE
VIS's 2Q earnings were roughly inline with expectations with GM/OPM at 32.3% and 20.4%. Net profit was NT$2.98bn (up 32% QoQ and 46% YoY). The UTR was about 87% in 2Q26 and management expects an increase to 90% in 3Q and higher into 4Q. Beyond AI, management sees improving fundamentals across several mature-node end markets. Industrial demand has resumed growth, while automotive has stabilized with increasing semiconductor content and market share gains offsetting lower vehicle production. Customer inventories outside AI remain healthy and well controlled despite selective inventory builds. Supported by accelerating AI infrastructure deployment, management believes the mature-node foundry market is entering a broader recovery phase with improving utilization and pricing trends. Maintain Buy, with TP higher to NT$185.
Capacity expansion amid tight supply -To address persistent strong demand extending into 2027, VIS emphasized it remains as one of the few foundries still meaningfully expanding 8-inch fabs to support customers' power semiconductor demand. Currently, PMIC contributes 77% of its 2Q revenue with AI contribution to reach double-digit % in 2026 (vs LSD % last year). VSMC's Singapore 12-inch fab is ramping ahead of schedule, with breakeven and full utilization expected earlier than originally planned. Phase one 44kwpm capacity has been largely committed, mainly for power and interposer. Management also continues sourcing second-hand equipment and upgrading existing fabs to maximize capacity expansion at attractive economics.
Pricing Momentum Reflects Rising Costs and Strong Demand -For 3Q26, wafer shipment is expected to be up 1-3% QoQ and blended ASP to increase 2-4% QoQ, primarily reflecting direct pricing actions with additional support from product mix improvements. GM to improve to 33.5% (mid-point) on higher UTR but rising depreciation cost. 3Q guidance is roughly inline with market expectations. Management expects pricing to remain on an upward trajectory into 2027, driven by structural cost inflation and sustained tight capacity. Rising labor, material, and equipment costs require price adjustments to preserve long-term competitiveness and support continued investment. Management indicated 2027 price increases are unlikely to be smaller than those implemented in 2026.
Earnings Summary
| Year to 31Dec | Net Profit (NT$M) | DilutedEPS (NT$) | EPSgrowth (%) | P/E (x) | P/B (x) | ROE (%) | Yield (%) |
|---|---|---|---|---|---|---|---|
| 2024A | 7,046 | 4.27 | -4 | 36.2 | 4.2 | 12.3 | 2.9 |
| 2025A | 7,908 | 4.25 | -0.4 | 36.3 | 3.5 | 10.4 | 2.9 |
| 2026E | 11,352 | 5.91 | 38.8 | 26.2 | 3 | 12.7 | 3.7 |
| 2027E | 14,243 | 7.41 | 25.5 | 20.8 | 2.9 | 14.6 | 4.7 |
| 2028E | 17,545 | 9.13 | 23.2 | 16.9 | 2.8 | 17.4 | 5.8 |
Source: Powered by dataCentral
See Appendix A-1 for Analyst Certification, Important Disclosures and Research Analyst Affiliations.
| n Buy | |
|---|---|
| Short-Term View: Upside Price(04Aug2615:00) | NT$154.50 |
| Target price fromNT$170.00 Expected share price | NT$185.00↑ |
| return | 19.7% |
| Expected dividend yield | 4.6% |
| Expected total return | 24.3% |
| MarketCap | NT$290,393M |
| US$8,960M |
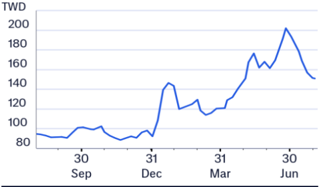
Price Performance (RIC: 5347.TWO, BB: 5347 TT)
Laura (Chia Yi) Chen AC
+886-2-8726-9090
laura.cy.chen@citi.com
Jack Chen +886-2-8726-9091
jack1.chen@citi.com
Nicholas Lai +886-2-8726-9093
nicholas.lai@citi.com
Prepared for Kevin Lu
| 5347.TWO:Fiscalyearend31-Dec | Price: NT$154.50; TP: NT$185.00; MarketCap:NT$290,393m; Recomm:Buy | Price: NT$154.50; TP: NT$185.00; MarketCap:NT$290,393m; Recomm:Buy | Price: NT$154.50; TP: NT$185.00; MarketCap:NT$290,393m; Recomm:Buy | Price: NT$154.50; TP: NT$185.00; MarketCap:NT$290,393m; Recomm:Buy | Price: NT$154.50; TP: NT$185.00; MarketCap:NT$290,393m; Recomm:Buy | ||||||
|---|---|---|---|---|---|---|---|---|---|---|---|
| Profit&Loss(NT$m) | 2024 | 2025 | 2026E | 2027E | 2028E | Valuation ratios | 2024 | 2025 | 2026E | 2027E | 2028E |
| Sales revenue | 44,055 | 48,591 | 59,310 | 78,094 | 89,205 | PE(x) | 36.2 | 36.3 | 26.2 | 20.8 | 16.9 |
| Cost of sales | -32,122 | -34,937 | -39,780 | -51,338 | -57,495 | PB(x) | 4.2 | 3.5 | 3.0 | 2.9 | 2.8 |
| Gross profit | 11,933 | 13,654 | 19,530 | 26,756 | 31,710 | EV/EBITDA(x) | 15.4 | 14.7 | 12.5 | 8.5 | 6.3 |
| Gross Margin (%) | 27.1 | 28.1 | 32.9 | 34.3 | 35.5 | FCFyield (%) | -2.1 | -14.5 | -16.5 | 14.8 | 5.6 |
| EBITDA(Adj) | 15,578 | 16,231 | 21,709 | 32,142 | 40,488 | Dividend yield (%) | 2.9 | 2.9 | 3.7 | 4.7 | 5.8 |
| EBITDAMargin(Adj) (%) | 35.4 | 33.4 | 36.6 | 41.2 | 45.4 | Payout ratio (%) | 105 | 105 | 98 | 98 | 98 |
| Depreciation | -8,467 | -8,458 | -9,482 | -15,130 | -19,695 | ROE(%) | 12.3 | 10.4 | 12.7 | 14.6 | 17.4 |
| Amortisation | 0 | 0 | 0 | 0 | 0 | Cashflow(NT$m) | 2024 | 2025 | 2026E | 2027E | 2028E |
| EBIT (Adj) | 7,111 | 7,773 | 12,226 | 17,012 | 20,794 | EBITDA | 15,578 | 16,231 | 21,709 | 32,142 | 40,488 |
| EBIT Margin (Adj) (%) | 16.1 | 16.0 | 20.6 | 21.8 | 23.3 | Working capital | -817 | -922 | -5,322 | -4,785 | -2,504 |
| Net interest | 1,665 | 1,484 | 964 | -51 | 145 | Other | -3,992 | 21,336 | -5,763 | 69,174 | 28,712 |
| Associates | -15 | 93 | -329 | 0 | 0 | Operating cashflow | 10,770 | 36,645 | 10,625 | 96,530 | 66,696 |
| Non-Op/Except/Other Adj | -10 | -100 | 553 | 200 | 200 | Capex | -16,004 | -78,186 | -59,737 | -52,500 | -50,000 |
| Pre-tax profit | 8,752 | 9,251 | 13,414 | 17,161 | 21,138 | Net acq/disposals | 0 | 0 | 0 | 0 | 0 |
| Tax | -1,705 | -1,480 | -2,225 | -2,917 | -3,594 | Other | -2,586 | -1,349 | -173 | 0 | 0 |
| Extraord./Min.Int./Pref.div. | -1 | 137 | 164 | 0 | 0 | Investing cashflow | -18,590 | -79,535 | -59,910 | -52,500 | -50,000 |
| Reported net profit | 7,046 | 7,908 | 11,352 | 14,243 | 17,545 | Dividends paid | -7,375 | -8,400 | -8,303 | -10,785 | -13,531 |
| Net Margin (%) | 16.0 | 16.3 | 19.1 | 18.2 | 19.7 | Financing cashflow | 37,940 | 24,283 | 19,220 | -13,691 | -13,448 |
| CoreNPAT | 7,046 | 7,908 | 11,352 | 14,243 | 17,545 | Net change in cash | 30,120 | -18,607 | -30,065 | 30,339 | 3,248 |
| Per share data | 2024 | 2025 | 2026E | 2027E | 2028E | Free cashflow to s/holders | -5,235 | -41,541 | -49,113 | 44,030 | 16,696 |
| Reported EPS($) | 4.27 | 4.25 | 5.91 | 7.41 | 9.13 | ||||||
| Core EPS($) | 4.27 | 4.25 | 5.91 | 7.41 | 9.13 | ||||||
| DPS($) | 4.50 | 4.45 | 5.78 | 7.25 | 8.93 | ||||||
| CFPS($) | 6.53 | 19.72 | 5.53 | 50.23 | 34.71 | ||||||
| FCFPS($) | -3.17 | -22.35 | -25.56 | 22.91 | 8.69 | ||||||
| BVPS($) | 36.79 | 44.77 | 51.16 | 53.01 | 55.16 | ||||||
| Wtdavgordshares(m) | 1,650 | 1,858 | 1,922 | 1,922 | 1,922 | ||||||
| Wtdavgdiluted shares (m) | 1,650 | 1,858 | 1,922 | 1,922 | 1,922 | ||||||
| Growthrates | 2024 | 2025 | 2026E | 2027E | 2028E | ||||||
| Sales revenue (%) | 15.1 | 10.3 | 22.1 | 31.7 | 14.2 | ||||||
| EBIT (Adj) (%) | 23.2 | 9.3 | 57.3 | 39.1 | 22.2 | ||||||
| CoreNPAT(%) | -4.4 | 12.2 | 43.6 | 25.5 | 23.2 | ||||||
| CoreEPS(%) | -4.0 | -0.4 | 38.8 | 25.5 | 23.2 | ||||||
| BalanceSheet(NT$m) | 2024 | 2025 | 2026E | 2027E | 2028E | ||||||
| Cash&cashequiv. | 57,820 | 39,076 | 8,664 | 39,003 | 42,251 | ||||||
| Accounts receivables | 6,235 | 6,748 | 9,596 | 12,072 | 13,358 | ||||||
| Inventory | 6,221 | 6,937 | 9,999 | 12,578 | 13,918 | ||||||
| Net fixed &other tangibles | 55,230 | 124,335 | 175,356 | 212,726 | 243,031 | ||||||
| Goodwill &intangibles | 0 | 0 | 0 | 0 | 0 | ||||||
| Financial &other assets | 23,384 | 23,556 | 30,881 | 36,571 | 39,526 | ||||||
| Total assets | 148,889 | 200,652 | 234,495 | 312,951 | 352,083 | ||||||
| Accounts payable | 1,416 | 1,724 | 2,312 | 2,583 | 2,704 | ||||||
| Short-term debt | 0 | 10,520 | 17,674 | 14,767 | 14,850 | ||||||
| Long-term debt | 0 | 0 | 0 | 0 | 0 | ||||||
| Provisions &other liab | 78,622 | 104,635 | 118,991 | 196,624 | 231,539 | ||||||
| Total liabilities | 80,039 | 116,879 | 138,977 | 213,974 | 249,093 | ||||||
| equity | 68,667 0 | 0 | 98,976 | 0 | |||||||
| Shareholders' Minority interests | 83,590 0 | 95,518 | 0 | 102,990 | |||||||
| Total equity | 68,667 | 83,590 | 95,518 | 98,976 | 102,990 | ||||||
| Net debt (Adj) | -57,820 | -28,556 | 9,010 | -24,236 | -27,401 | ||||||
| Net debt to equity (Adj) (%) | -84.2 | ||||||||||
| For definitions of the items in this table, | please click here. | -34.2 | 9.4 | -24.5 | -26.6 |
Figure 1. Vanguard - 2026 results comparison
2026
4,604
32.3%
2,901
20.4%
2,975
1.55
1Q26
(NT$mn)
Revenue
Gross profit
Gross margin
Op. profit
OP margin
Net income
EPS (NTS)
3,671
29.3%
2,087
16.7%
2,246
1.17
25%
+3.0 ppt
39%
+3.7 ppt
32%
32%
2Q25
3,280
28.0%
1,897
16.2%
2,043
1.10
40%
+4,3 ppt
53%
+4.2 ppt
46%
40%
@ 2026 Citioroun Inc No redistribution without Citioroun's written nermission
Prepared for Kevin Lu
2Q26
Citi
14,356
4,655
32.4%
2,860
19.9%
2,780
Diff.
-1%
-1%
- 0.1 ppt
1%
+0.4 ppt
7%
2026
Cons.
14,441
4,662
32.3%
2,914
20.2%
2,845
+0.0 ppt
0%
+0.2 ppt
5%
AI Power Portfolio Remains Anchored on 8-inch Manufacturing -With higher power demand for AI infrastructure, management believes discrete power solutions will remain as the mainstream architecture for AI servers over the next several years. While fully integrated Smart Power Stages (SPS) manufactured on 12-inch nodes are emerging, high-power AI applications continue to favor discrete controller plus MOSFET solutions due to superior robustness. Meanwhile, VIS continues expanding silicon carbide capabilities, targeting engineering samples in early 2027 to address future AI data center and automotive power applications.
Reiterate Buy; TP higher to NT$185 -Anticipating improving earnings outlook and better UTR, we lift our 2026/27/28 earnings projection by 3%/3%/18%. We maintain Buy with TP NT$185 (unchanged 25x PER but moving to 2027 EPS).
Figure 1. Vanguard - 2Q26 results comparison
© 2026 Citigroup Inc. No redistribution without Citigroup's written permission.
Source: Citi Research, Bloomberg
Figure 2. Vanguard - Estimates Revisions
| 2026E | 2026E | 2026E | 2027E | 2027E | 2027E | 2028E | 2028E | 2028E | |
|---|---|---|---|---|---|---|---|---|---|
| (NT$mn) | New | Old | Chg. | New | Old | Chg. | New | Old | Chg. |
| Sales | 59,310 | 59,120 | 0% | 78,094 | 75,406 | 4% | 89,205 | 85,738 | 4% |
| YoYgrowth | 22% | 22% | 32% | 28% | 14% | 14% | |||
| Gross profit | 19,530 | 19,390 | 1% | 26,756 | 25,899 | 3% | 31,710 | 28,117 | 13% |
| Opex | 7,304 | 7,358 | -1% | 9,744 | 9,412 | 4% | 10,916 | 10,492 | 4% |
| Operating profit | 12,226 | 12,032 | 2% | 17,012 | 16,487 | 3% | 20,794 | 17,625 | 18% |
| Pre-tax profit | 13,414 | 13,070 | 3% | 17,161 | 16,635 | 3% | 21,138 | 17,969 | 18% |
| Net income | 11,352 | 11,033 | 3% | 14,243 | 13,807 | 3% | 17,545 | 14,914 | 18% |
| EPS(NT$) | 5.91 | 5.93 | 0% | 7.41 | 7.42 | 0% | 9.13 | 8.01 | 14% |
| Gross margin | 32.9% | 32.8% | +0.1 ppt | 34.3% | 34.3% | -0.1 ppt | 35.5% | 32.8% | +2.8 ppt |
| Opexratio | 12.3% | 12.4% | -0.1 ppt | 12.5% | 12.5% | -0.0 ppt | 12.2% | 12.2% | +0.0ppt |
| Operating margin | 20.6% | 20.4% | +0.3 ppt | 21.8% | 21.9% | -0.1 ppt | 23.3% | 20.6% | +2.8 ppt |
| Net margin | 19.1% | 18.7% | +0.5 ppt | 18.2% | 18.3% | -0.1 ppt | 19.7% | 17.4% | +2.3 ppt |
© 2026 Citigroup Inc. No redistribution without Citigroup's written permission.
Source: Citi Research, Bloomberg
Figure s. Vanguard - Forecast summary
Figure 3. Vanguard - Forward P/E band
NT$
Unit: NTSmn
300
Revenue
250
COGS
Gross Profit
Operating Expense
200
EBIT
Net Interest Income
150
100
Net Other Income
Pre Tax Profit
50
Net Profit
0
EPS (NT$)
Margins (%)
2010
Gross Margin
@ 2026 Citioroun Inc. No redistribution without Citigroun's written permission.
Operating Margin
Net Margin
Sequential Growth (%)
Volume
Revenue
Gross Profit
EBIT
Net Profit
Prepared for Kevin Lu
2026
20
14,245
9,641
4,604
1,703
2,901
313.7
98.6
30E
15,837
10,516
5,321
1,980
3,342
212.7
50.0
Figure 4. Vanguard - Forward P/B band & ROE
NT$
250
40E
16,696
10,762
5,934
200
2,037
3,897
150
112.7
100
50.0
1QE
17,544
11,586
5,958
2,281
3,677
12.7
50.0
2027
20E
18,862
12,312
6,550
2,358
4,192
-37.3
50.0
30E
20,684
13,736
6,948
2,585
4,363
11.7
50.0
4QE
21,004
13,704
7,300
2,520
4,780
-38.3
50.0
2025
48,591
-34,937
13,654
-5,880
7,773
1,484.5
-7.1
2026E
59,310
-39,780
19,530
-7,304
12,226
964.3
223.5
2027E
78,094
-51,338
26,756
-9,744
17,012
-51.2
200.0
1,359
3,597
2,238
473.4
2,675
- 36.8
2025
3,280
1,384
1,897
390.6
94.5
3,312
1,480
1,832
307.0
-39.7
3,671
1,584
2,087
325.2
24.8
ROE
2028E
30%
31,710
-10,916
20,794
144.8
20%
200.0
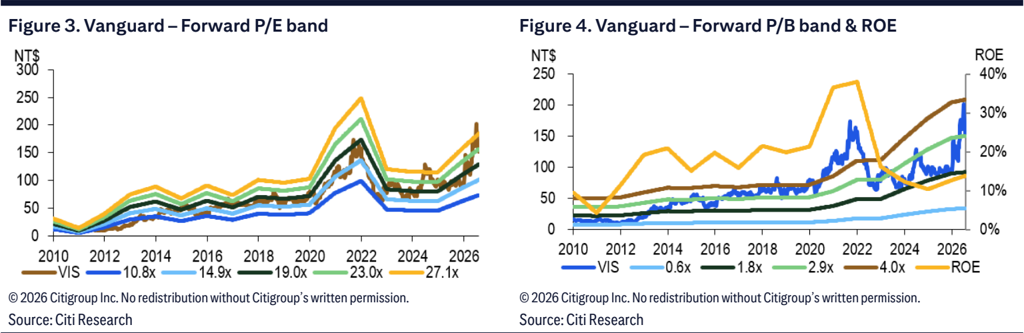
Figure 5. Vanguard - Forecast summary
© 2026 Citigroup Inc. No redistribution without Citigroup's written permission.
Source: Citi Research, Company Reports
10%
Prepared for Kevin Lu
Adding Upside 90-Day Short-Term View on Vanguard International Semi. (5347.TWO)
Direction:
Upside
Duration:
Within 90 Days
Category:
Thematic driven
We see VIS' improving gross margin on higher UTR and pricing to support its share price performance in the coming months.
NT$
222
185
148
111
74
Aug 25
A 29% Upside
NT$185.00
4 20% Upside
NT$ 120.00
• 22% Downside
Bull/Bear: Vanguard International Semi. (5347.TWO)
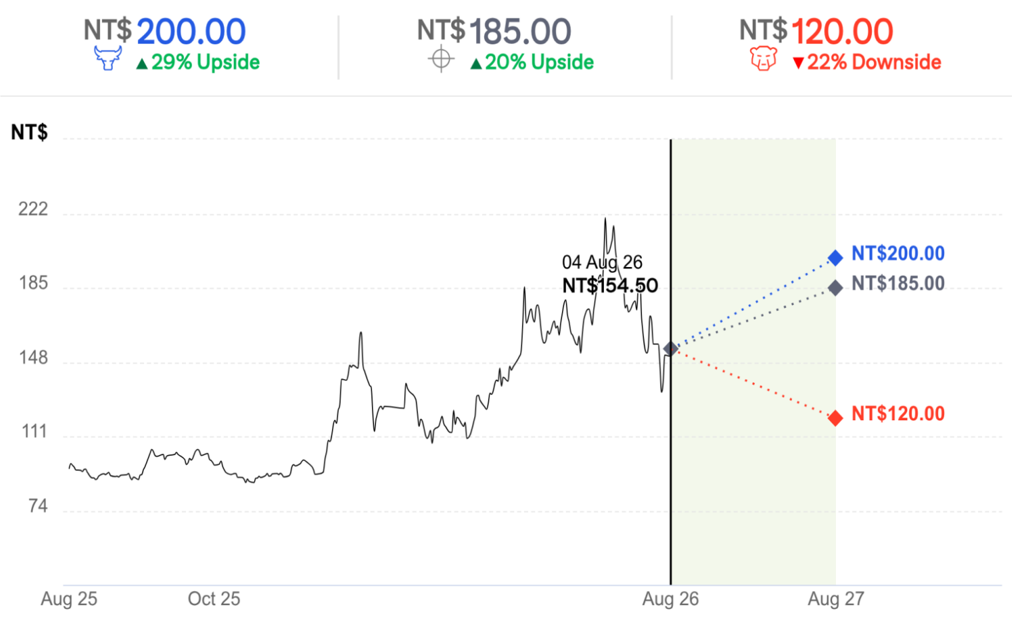
BASE Assumptions
• Robust sales gowth with some GM pressure from increasing depreciation
- Some margin impact from the Singapore fab
BEAR Assumptions
• Worse-than-expected 8-inch recovery
- Weaker-than-expected PMIC growth
Prepared for Kevin Lu
Prepared for Kevin Lu
Vanguard International Semi.
Company description
Vanguard International Semiconductor Corporation (VIS) is a specialty IC foundry service provider, with existing capacity mainly focused on 8-inch. VIS offers a wide range of process technologies, including high voltage, ultra-high voltage, and BCD. In 2024, VIS and NXP Semiconductors established the VSMC joint venture in Singapore, with its first 12-inch fab set to begin initial production in 2027.
Investment strategy
We rate Vanguard a Buy as we expect it to benefit from robust PMIC sales momentum, driven by strong AI demand and improving industrial demand. VIS is gaining market share in PMIC as clients are looking for non-Chinese suppliers. Moreover, we believe VIS should benefit from transfer orders from TSMC on the 8-inch wafer process. We think VIS has already passed its trough and expect a gradual recovery into 2027.
Valuation
Our target price for VIS of NT$185 is based on 25x 2027E P/E, which we see as justified by its robust PMIC sales growth momentum and increasing outflow order opportunity from TSMC with support from its consistent cash dividend policy. Our target price equates to 2026/27E P/B of 3.6x/3.5x.
Risks
Key downside risks to our target price include: 1) weaker 8-inch demand along with higher costs due to inflation or more severe ASP competition from Chinese peers; 2) lower UTR of the new capacity at the newly acquired fab, with depreciation burden; and 3) less-than-expected outsourcing opportunities from IDMs.
If you are visually impaired and would like to speak to a Citi representative regarding the details of the graphics in this document, please call USA 1-888-500-5008 (TTY: 711), from outside the US +1-210-677-3788