PDF 原檔:報告_UBS_環球晶6488_20260713_original.pdf
圖片清單(已驗證 2026-07-14)
| 檔名 | size | 分類 | 親眼所見內容 |
|---|---|---|---|
6488環球晶-目標價2000元-UBS_GWC_20260713_001.png |
62KB | 真資料圖 | Upside/Downside Spectrum:GlobalWafers 6488.TWO 股價圖(標示 TWD1485.0,13 Jul)+12 個月情境帶 upside 2300.0(+55%)/base 2000.0(+35%)/downside 1100.0(-26%);下方 Value drivers (2027E) 表:12" 稼動率 90/84/75%、12" ASP 全年成長 +28/+24/+7%、GM 37.2/34.9/26.6% |
6488環球晶-目標價2000元-UBS_GWC_20260713_002.png |
55KB | 真資料圖 | GWC GM(%) 曲線 2020–2030E,三階段標注:2020–2022 COVID 產業上行(GM 升至 ~43%)、2023–2025E 晶圓業持續擴產+終端庫存(GM 降至 ~23%)、2026E 之後 better wafer cycle+美國產能 ramp+SiC 新利潤驅動(GM 升至 2029E ~50% 後略降) |
6488環球晶-目標價2000元-UBS_GWC_20260713_005.png |
92KB | 真資料圖 | Price Target(NT$,階梯線)vs Stock Price(NT$,黑線)沿革圖 2023/4–2026/6,下方 Buy/Neutral 評等區間帶:約 2025/9 前為 Neutral、之後轉 Buy;2026 年股價急漲至 ~1,350、PT 階梯上調至 800 |
_003.png(32KB)、_004.png(34KB)未達 40KB 門檻未逐張驗證,依 trimmed 引用位置為 Figure 7/8 PE band 與 P/BV band,未列入可嵌清單。
原始內容
GlobalWafers
Micron's LTA leading another strong and likely longer upcycle
10-year contract with Micron to power US expansion
On 9 July, GWC announced a 10-year contract with Micron supporting the latter's US capacity expansion. We believe the long-term agreement (LTA) shows supply-demand conditions could improve more rapidly in the next 2-3 years, presenting an opportunity GWC is well placed to capture owing to its US expansion. Key points: 1) Micron will pay US$0.5bn in strategic financing support to facilitate GWC's second-phase expansion in the US; we think this contract implies 200-300kwpm of committed 12" wafer demand to support Micron's US expansion in Boise and New York. 2) The blended contract pricing could be possibly 40-50% above current contract price based on our estimate, given higher US production cost. 3) The collaboration involves co-development on nextgen products, strengthening GWC's market positioning in memory.
Other large clients to follow suit in new LTA negotiation
As the possibility that 8" and 12" wafer supply will tighten by 2028 has risen, our view has been that GWC's large clients could turn increasingly aggressive towards new LTA discussions to secure supply for 2028-29. Negotiations could take place even before current contracts expire. We expect most large logic and memory clients to prioritise supply security over cost in their wafer procurement, especially as memory clients are making 80% GMs, while TSMC could report a GM of 65%-plus in Q226E. In our view, the industry outlook is turning more favourable for silicon wafer makers, owing to the stronger demand for cloud AI accelerators, server CPUs, DRAM, HBM, NAND and advanced packaging. Even the mature 6"/8" wafer market segment is recovering on supply consolidation and rising demand from the server and auto/industrial sectors.
Entering an upcycle with robust price upside
Structurally, we expect price increases in this new upcycle to follow a trajectory closer to the 2017-18 cycle. We forecast GWC's blended 12" wafer prices to increase 30%/26% in 2027/28, and 8" wafer prices to rise 25%/20% in 2027/28. Key drivers of this cycle are the AI mega-trend, re-acceleration of memory capex and more robust margin profiles across most logic and memory clients. Market share gains in advanced nodes at logic foundries, such as TSMC, could also drive ASP upside for GWC.
Valuation: reiterate Buy; raise price target from NT$800 to NT$2,000
We maintain our Buy rating and raise our P/B-based PT from NT$800 to NT$2,000. We raise 2027/28E EPS by 80%/106% to NT$45.2/87.2 respectively. In addition, we raise our target 2027E P/B from 3.6x to 8.5x to reflect: 1) the long-term ROE rising from 18.5% to 30.8%; and 2) GWC's US re-shoring opportunities, market share gains in leading edge products, and the upside in 12' SiC wafers for AI GPUs in 2028E, which we believe justifies a premium to the historical upper end of its P/B range of 7x.
| Highlights (NT$m) | 12/23 | 12/24 | 12/25 | 12/26E | 12/27E | 12/28E | 12/29E | 12/30E |
|---|---|---|---|---|---|---|---|---|
| Revenues | 70,652 | 62,626 | 60,598 | 62,671 | 89,944 | 137,319 | 187,024 | 192,523 |
| EBIT (UBS) | 20,059 | 14,118 | 8,636 | 7,368 | 24,449 | 53,525 | 82,882 | 81,738 |
| Net earnings (UBS) | 19,772 | 9,846 | 7,312 | 8,025 | 21,592 | 41,674 | 62,341 | 61,483 |
| EPS (UBS, diluted) (NT$) | 43.73 | 20.94 | 15.28 | 16.75 | 45.08 | 87.00 | 130.15 | 128.36 |
| DPS (net) (NT$) | 20.07 | 11.00 | 5.70 | 6.71 | 18.06 | 34.86 | 0.00 | 0.00 |
| Net (debt) / cash | (28,942) | (27,857) | (54,769) | (26,922) | (14,490) | 11,973 | 57,667 | 109,680 |
| Profitability/valuation | 12/23 | 12/24 | 12/25 | 12/26E | 12/27E | 12/28E | 12/29E | 12/30E |
| EBIT (UBS) margin% | 28.4 | 22.5 | 14.3 | 11.8 | 27.2 | 39.0 | 44.3 | 42.5 |
| ROIC (EBIT)% | 42.7 | 15.2 | 7.3 | 6.1 | 22.5 | 47.8 | 74.5 | 80.7 |
| EV/EBITDA (UBS core) x | 7.6 | 10.5 | 10.6 | 33.0 | 15.6 | 8.4 | 5.9 | 6.2 |
| P/E (UBS, diluted) x | 11.6 | 24.1 | 24.1 | 80.6 | 29.9 | 15.5 | 10.4 | 10.5 |
| Equity FCF (UBS) yield% | (8.4) | (14.2) | (12.7) | 1.4 | (0.1) | 1.7 | 6.0 | 12.2 |
| Dividend yield (net)% | 4.0 | 2.2 | 1.6 | 0.5 | 1.3 | 2.6 | 0.0 | 0.0 |
Source: Company accounts, LSEG Eikon, UBS estimates. Metrics marked as (UBS) have had analyst adjustments applied. Valuations: based on an average share price that year, (E): based on a share price of NT$ 1,350.00 on 10-Jul-2026
| Equities | Equities | Equities | Equities |
|---|---|---|---|
| Taiwan | Taiwan | Taiwan | Taiwan |
| Semiconductors | Semiconductors | Semiconductors | Semiconductors |
| 12-month rating | 12-month rating | 12-month rating | Buy |
| 12m price target | 12m price target | 12m price target | NT$2,000.00 Prior : NT$800.00 |
| Price (10 Jul 2026) | Price (10 Jul 2026) | Price (10 Jul 2026) | NT$1,350 |
| RIC: 6488.TWO BBG: 6488 TT | RIC: 6488.TWO BBG: 6488 TT | RIC: 6488.TWO BBG: 6488 TT | RIC: 6488.TWO BBG: 6488 TT |
| Trading data and key metrics | Trading data and key metrics | Trading data and key metrics | Trading data and key metrics |
| 52-wk range | 52-wk range | 52-wk range | NT$1,350.00-310.00 |
| Market cap. | Market cap. | Market cap. | NT$645b/US$20.1b |
| Shares o/s | Shares o/s | Shares o/s | 478m (ORD) |
| Free float | Free float | Free float | 37% |
| Avg. daily volume ('000) | Avg. daily volume ('000) | Avg. daily volume ('000) | 7.58 |
| Avg. daily value (m) | Avg. daily value (m) | Avg. daily value (m) | NT$6.2 |
| Common s/h equity (12/26E) | Common s/h equity (12/26E) | Common s/h equity (12/26E) | NT$95.2b |
| P/BV (12/26E) | P/BV (12/26E) | P/BV (12/26E) | 6.8x |
| Net debt to EBITDA (12/26E) | Net debt to EBITDA (12/26E) | Net debt to EBITDA (12/26E) | 1.3x |
| EPS (UBS, diluted) (NT$) | EPS (UBS, diluted) (NT$) | EPS (UBS, diluted) (NT$) | EPS (UBS, diluted) (NT$) |
| From | To | %ch Cons. | |
| 12/26E | 17.01 | 16.75 | -2 21.45 |
| 12/27E | 25.12 | 45.08 | 79 28.70 |
| 12/28E | 42.35 | 87.00 | 105 40.00 |
| Sunny Lin Analyst sunny.lin@ubs.com +886-2-8722 7346 Ryan Sun Associate Analyst | |||
| ryan-za.sun@ubs.com | |||
| +886-2-8722 7267 | |||
| Christine Chen, CFA Associate Analyst christine.chen@ubs.com +886-2-8722 7361 |
Thesis Map UBS Research THESIS MAP a guide to our thinking and what´s where in this report
Pivotal Questions
UBS VIEW
EVIDENCE
WHAT´S PRICED IN?
Upside/Downside Spectrum
Company Description
Q: Will wafer supply-demand improve in 2027E/28E after the long downcycle since 2022?
The supply-demand situation for both 12" and 8" silicon wafers should improve meaningfully in 2027-28 after the 2024-25 trough. 1) We believe several wafer makers have slowed their greenfield capacity expansion since 2025. 2) The demand outlook for memory and logic is improving for the next 2-3 years led by cloud AI; we believe the industry's 12" wafer utilisation will incrementally recover from its trough of 79.1% in 2024 to 81.7/82.2% in 2025/2026E and rise further to 87.7%/93.6% in 2027E/28E. 3) We expect GWC's clients to be receptive to new LTA negotiations given increasing supply tightness; we expect supply-demand in the 8" wafer segment to also bottom out and improve from a trough of 71.9%/68.6% in 2024/25 to 78.7% in 2026E and further to 86.7%/93.7% in 2027E/28E.
Q: Will GlobalWafers' GM return to over 30% in the next three to four years?
We believe GlobalWafers' GM will recover to around 35% by 2027E, and improve further to 45.9%/50.8% by 2028E/2029E, driven by several factors, including: 1) improving supply-demand dynamics with LTA support; 2) a stronger US fab ramp by GlobalWafers, which will likely enable some share gain in advanced 12" products, as the US government is pushing for the localisation of the semiconductor supply chain; and 3) silicon carbide (SiC) opportunities for AI GPU cooling solutions should improve GlobalWafers' margin profile if the opportunity materialises in 2028E.
As the possibility that 8" and 12" wafer supply will tighten by 2028 has risen, our view has been that GWC's large clients could be more aggressive with new LTA discussions to secure supply for 2028-29. Negotiations could take place even before current contracts expire. We expect most large logic and memory clients to prioritise supply security over cost in their wafer procurement, especially as memory clients are making 80% GMs, while TSMC could report a 65%-plus GM in Q226. In our view, the industry outlook is turning more favourable for silicon wafer makers, owing to the stronger demand for cloud AI accelerators, DRAM, HBM, NAND and advanced packaging. Even the mature 6"/8" wafer market segment is recovering on supply consolidation and rising demand from the server and auto/industrial sectors.
On 9 July, GWC announced a 10-year contract with Micron supporting the latter's US capacity expansion. We believe the long-term agreement (LTA) shows supply-demand conditions could improve more rapidly in the next 2-3 years, presenting an opportunity GWC is well placed to capture owing to its US expansion. As industry supply tightens, we anticipate GWC's large clients will be more aggressive with new LTA discussions to secure supply for 2028-29.
The stock has rallied 266% YTD, which we believe reflects the improvement in the silicon wafer cycle. Now the question is how much pricing could increase in this cycle. We are more constructive as these industry dynamics evolve favorably to GWC and forecast GWC's blended 12" ASP to improve 30% in 2027E and 26% in 2028E.
| Value drivers (2027E) | 12" wafer utilisation rate | 12" wafer ASP growth throughout the year | GM |
|---|---|---|---|
| NT$2,300.00 upside | 90% | +28% | 37.2% |
| NT$2,000.00 base | 84% | +24% | 34.9% |
| NT$1,100.00 downside | 75% | +7% | 26.6% |
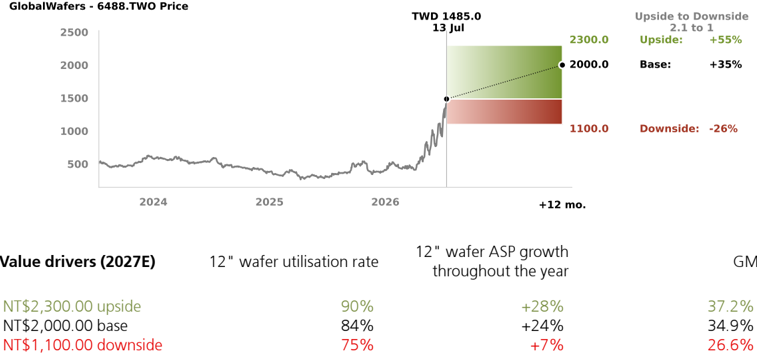
Source: UBS estimates
GlobalWafers (GWC) was founded in 2011 as a spin-off from Sino-American Silicon (SAS). It focuses on silicon raw wafer manufacturing, with a product portfolio of polished, epitaxial (EPI), annealed, diffused, non-polished, float zone (FZ) and silicon-on-insulator (SOI) types.
Figure 1: 12" wafer supply/demand model
| 2016 | 2017 | 2018 | 2019 | 2020 | 2021 | 2022 | 2023 | 2024 | 2025 | 2026E | 2027E | 2028E | 2029E | |
|---|---|---|---|---|---|---|---|---|---|---|---|---|---|---|
| Total inventory-adjusted demand (k pcs/mon) | 5,018 | 5,694 | 6,269 | 5,620 | 6,228 | 7,273 | 7,736 | 6,783 | 6,975 | 7,721 | 8,423 | 9,509 | 10,491 | 11,459 |
| YoY | 13.5% | 10.1% | -10.3% | 10.8% | 16.8% | 6.4% | -12.3% | 2.8% | 10.7% | 9.1% | 12.9% | 10.3% | 9.2% | |
| DRAM | 1,083 | 1,180 | 1,254 | 1,312 | 1,341 | 1,496 | 1,638 | 1,424 | 1,548 | 1,792 | 1,924 | 2,087 | 2,346 | 2,652 |
| NAND | 1,366 | 1,495 | 1,544 | 1,444 | 1,500 | 1,618 | 1,737 | 1,388 | 1,294 | 1,322 | 1,349 | 1,355 | 1,402 | 1,477 |
| Logic & others | 2,703 | 2,851 | 3,284 | 3,209 | 3,624 | 4,216 | 4,344 | 3,957 | 4,196 | 4,629 | 5,157 | 5,968 | 6,594 | 7,271 |
| Inventory adjustment | -135 | 168 | 188 | -345 | -238 | -58 | 18 | 13 | -63 | -21 | -8 | 0 | 0 | 0 |
| Total output (k pcs/mon) | 5,143 | 5,605 | 6,281 | 6,032 | 6,490 | 7,324 | 7,752 | 7,419 | 7,299 | 7,842 | 8,758 | 9,519 | 10,043 | 10,472 |
| YoY | 9.0% | 12.1% | -4.0% | 7.6% | 12.8% | 5.9% | -4.3% | -1.6% | 7.4% | 11.7% | 8.7% | 5.5% | 4.3% | |
| Shin-Etsu | 1,533 | 1,729 | 2,043 | 1,880 | 1,997 | 2,186 | 2,295 | 2,369 | 2,409 | 2,409 | 2,625 | 2,740 | 2,820 | 2,902 |
| SUMCO | 1,311 | 1,406 | 1,562 | 1,522 | 1,683 | 1,880 | 1,910 | 1,699 | 1,607 | 1,775 | 1,936 | 2,022 | 2,045 | 2,069 |
| Siltronic | 816 | 956 | 1,021 | 890 | 944 | 1,039 | 1,075 | 849 | 850 | 887 | 1,017 | 1,156 | 1,266 | 1,320 |
| GlobalWafers | 712 | 722 | 792 | 748 | 815 | 986 | 1,034 | 1,008 | 895 | 950 | 1,062 | 1,240 | 1,350 | 1,485 |
| SK Siltron | 770 | 791 | 863 | 993 | 1,052 | 1,128 | 1,256 | 1,213 | 1,146 | 1,093 | 1,142 | 1,187 | 1,300 | 1,347 |
| China and others effective capacity | 0 | 0 | 0 | 0 | 0 | 104 | 182 | 282 | 392 | 729 | 976 | 1,174 | 1,261 | 1,349 |
| Total Industry Capacity | 5,137 | 5,623 | 6,347 | 6,989 | 7,146 | 7,730 | 8,008 | 8,289 | 8,816 | 9,446 | 10,243 | 10,837 | 11,209 | 11,549 |
| Industry Utilization% | 97.7% | 101.3% | 98.8% | 80.4% | 87.1% | 94.1% | 96.6% | 81.8% | 79.1% | 81.7% | 82.2% | 87.7% | 93.6% | 99.2% |
Source: Company data, UBS estimates. Note: China and others refers to NSIG and other suppliers. Mon = month.
Figure 2: 8" wafer supply/demand model
| 2015 | 2016 | 2017 | 2018 | 2019 | 2020 | 2021 | 2022 | 2023 | 2024 | 2025 | 2026E | 2027E | 2028E | 2029E | |
|---|---|---|---|---|---|---|---|---|---|---|---|---|---|---|---|
| Wafer demand | |||||||||||||||
| Total inventory-adjusted demand (k pcs/mon) | 4,297 | 4,550 | 5,291 | 5,636 | 4,943 | 4,980 | 5,958 | 6,050 | 4,631 | 4,120 | 3,989 | 4,303 | 4,681 | 5,093 | 5,401 |
| YoY | 5.9% | 16.3% | 6.5% | -12.3% | 0.7% | 19.6% | 1.5% | -23.5% | -11.0% | -3.2% | 7.9% | 8.8% | 8.8% | 6.0% | |
| Inventory adjustment (k pcs/mon) | -100 | -50 | 30 | 30 | -130 | -60 | 70 | 150 | 0 | 0 | -20 | 0 | 0 | 10 | 10 |
| Total capacity (k pcs/mon) | 4,920 | 5,136 | 5,202 | 5,581 | 5,792 | 5,939 | 6,019 | 6,328 | 5,973 | 5,726 | 5,814 | 5,469 | 5,401 | 5,435 | 5,435 |
| YoY | 4.4% | 1.3% | 7.3% | 3.8% | 2.5% | 1.3% | 5.1% | -5.6% | -4.1% | 1.5% | -5.9% | -1.2% | 0.6% | 0.0% | |
| Shin-Etsu | 1,200 | 1,236 | 1,285 | 1,363 | 1,403 | 1,432 | 1,460 | 1,471 | 1,133 | 869 | 752 | 752 | 752 | 752 | 752 |
| SUMCO | 1,250 | 1,288 | 1,200 | 1,200 | 1,200 | 1,250 | 1,163 | 1,375 | 1,211 | 1,038 | 1,175 | 800 | 700 | 700 | 700 |
| GlobalWafers | 1,000 | 1,032 | 1,095 | 1,106 | 1,117 | 1,128 | 1,139 | 1,151 | 1,162 | 1,174 | 1,174 | 1,174 | 1,174 | 1,174 | 1,174 |
| Siltronic | 650 | 650 | 650 | 650 | 650 | 650 | 650 | 650 | 650 | 650 | 650 | 650 | 650 | 650 | 650 |
| SK Siltron | 550 | 630 | 649 | 655 | 662 | 669 | 675 | 682 | 689 | 696 | 696 | 696 | 696 | 696 | 696 |
| WaferWorks | 200 | 200 | 218 | 297 | 388 | 413 | 476 | 500 | 500 | 500 | 500 | 500 | 500 | 500 | 500 |
| Ferrotec JV | 0 | 0 | 51 | 100 | 100 | 100 | 100 | 100 | 100 | 100 | 100 | 100 | 100 | 100 | |
| China and others effective capacity | 70 | 100 | 105 | 259 | 272 | 298 | 355 | 399 | 528 | 700 | 767 | 798 | 830 | 863 | 863 |
Industry Utilization %
87.3% 88.6% 101.7% 101.0% 85.3% 83.9% 99.0% 95.6% 77.5% 71.9% 68.6% 78.7% 86.7% 93.7% 99.4%
Source: Company data, UBS estimates. Note: China and others refers to NSIG and other suppliers. Mon = month.
Figure 3: GWC's GM outlook improving with a better cycle, stronger ramp-up of US capacity, and SiC opportunities
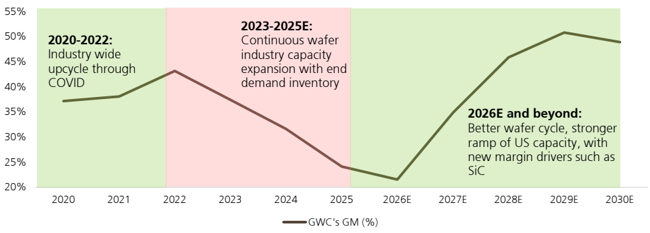
Source: UBS estimates
Forecast changes
Figure 4: Revisions to our earnings estimates
| (NT$m) | 2026E | New 2027E | 2028E | 2026E | Old 2027E | 2028E | 2026E | Change 2027E | 2028E |
|---|---|---|---|---|---|---|---|---|---|
| Revenue | 62,671 | 89,944 | 137,319 | 63,958 | 80,486 | 104,995 | -2% | 12% | 31% |
| - YoY chg | 3% | 44% | 53% | 6% | 26% | 30% | |||
| Revenue (US$m) | 1,958 | 2,811 | 4,291 | 1,999 | 2,515 | 3,281 | -2% | 12% | 31% |
| - YoY chg | 1% | 44% | 53% | 4% | 26% | 30% | |||
| Gross profit | 13,501 | 31,346 | 62,991 | 13,704 | 21,803 | 34,623 | -1% | 44% | 82% |
| - Gross margin | 21.5% | 34.9% | 45.9% | 21.4% | 27.1% | 33.0% | |||
| Operating profit | 7,368 | 24,449 | 53,525 | 7,816 | 15,379 | 26,773 | -6% | 59% | 100% |
| - Operating margin | 11.8% | 27.2% | 39.0% | 12.2% | 19.1% | 25.5% | |||
| Pretax profit | 10,519 | 28,789 | 55,565 | 10,668 | 16,019 | 27,013 | |||
| Net profit | 8,025 | 21,592 | 41,674 | 8,137 | 12,014 | 20,260 | -1% | 80% | 106% |
| - Net margin | 12.8% | 24.0% | 30.3% | 12.7% | 14.9% | 19.3% | |||
| EPS (NT$) | 16.78 | 45.16 | 87.16 | 17.02 | 25.13 | 42.37 | -1% | 80% | 106% |
| - YoY chg | 10% | 169% | 93% | 11% | 48% | 69% |
Source: UBS estimates. Note: Our EPS estimates here are based on basic EPS, and may differ from the table on the cover page.
Figure 5: Our earnings estimates vs consensus
| UBSe | UBSe | UBSe | Consensus | Consensus | Consensus | Difference | Difference | Difference | |
|---|---|---|---|---|---|---|---|---|---|
| (NT$m) | 2026E | 2027E | 2028E | 2026F | 2027F | 2028F | 2026E | 2027E | 2028E |
| Revenue | 62,671 | 89,944 | 137,319 | 64,646 | 81,288 | 95,547 | -3% | 11% | 44% |
| - YoY chg | 3% | 44% | 53% | 7% | 26% | 18% | |||
| Gross profit | 13,501 | 31,346 | 62,991 | 14,972 | 23,311 | 31,219 | -10% | 34% | 102% |
| - Gross margin | 21.5% | 34.9% | 45.9% | 23.2% | 28.7% | 32.7% | |||
| Operating profit | 7,368 | 24,449 | 53,525 | 8,799 | 16,326 | 23,225 | -16% | 50% | 130% |
| - Operating margin | 11.8% | 27.2% | 39.0% | 13.6% | 20.1% | 24.3% | |||
| Net profit | 8,025 | 21,592 | 41,674 | 9,880 | 14,640 | 19,868 | -19% | 47% | 110% |
| - Net margin | 12.8% | 24.0% | 30.3% | 15.3% | 18.0% | 20.8% | |||
| EPS (NT$) | 16.78 | 45.16 | 87.16 | 20.57 | 29.96 | 41.56 | -18% | 51% | 110% |
| - YoY chg | 10% | 169% | 93% | 35% | 46% | 39% |
Source: UBS estimates, Visible Alpha. Note: Our EPS estimates here are based on basic EPS, and may differ from the table on the cover page.
Figure 6: Our earnings forecasts
| (NT$ m) | 2025 | Q126 | Q226E | Q326E | Q426E | 2026E | Q127E | Q227E | Q327E | Q427E | 2027E | 2028E | 2029E | 2030E |
|---|---|---|---|---|---|---|---|---|---|---|---|---|---|---|
| Revenue | 60,598 | 13,985 | 15,214 | 16,274 | 17,198 | 62,671 | 19,238 | 21,162 | 23,898 | 25,646 | 89,944 | 137,319 | 187,024 | 192,523 |
| - YoY chg (%) | -3% | -10% | -5% | 12% | 19% | 3% | 38% | 39% | 47% | 49% | 44% | 53% | 36% | 3% |
| - QoQ chg (%) | - | -4% | 9% | 7% | 6% | - | 12% | 10% | 13% | 7% | - | - | - | - |
| Revenue (US$m) | 1,930 | 437 | 475 | 509 | 537 | 1,958 | 601 | 661 | 747 | 801 | 2,811 | 4,291 | 5,845 | 6,016 |
| - YoY chg (%) | -1% | -7% | -8% | 5% | 16% | 1% | 38% | 39% | 47% | 49% | 44% | 53% | 36% | 3% |
| - QoQ chg (%) | - | -5% | 9% | 7% | 6% | - | 12% | 10% | 13% | 7% | - | - | - | - |
| Blended ASP (US$/pcs) | ||||||||||||||
| <6" | 6.9 | 6.9 | 6.9 | 6.9 | 6.9 | 6.9 | 6.9 | 6.9 | 6.9 | 6.9 | 6.9 | 7.0 | 6.9 | 6.9 |
| 6" | 9.2 | 9.0 | 9.0 | 9.0 | 9.0 | 9.0 | 9.2 | 9.5 | 9.8 | 10.1 | 9.7 | 10.9 | 12.2 | 12.7 |
| 8" | 56.6 | 54.1 | 54.1 | 54.1 | 55.7 | 54.5 | 59.6 | 63.7 | 67.6 | 70.9 | 65.6 | 80.4 | 93.0 | 92.2 |
| 12" | 100.5 | 94.7 | 94.5 | 97.3 | 100.2 | 96.9 | 107.3 | 114.8 | 124.0 | 133.9 | 120.4 | 159.4 | 195.1 | 208.4 |
| Wafer shipment (k pcs) | ||||||||||||||
| <6" - YoY chg (%) | 9,030 4% | 2,310 | 2,310 | 2,310 | 2,310 | 9,240 2% | 2,310 | 2,310 | 2,310 | 2,310 | 9,240 0% | 10,080 9% | 10,080 0% | 10,080 0% |
| 6" - YoY chg (%) | 12,011 4% | 3,073 | 3,073 | 3,073 | 3,073 | 12,290 2% | 3,073 | 3,073 | 3,073 | 3,073 | 12,290 0% | 13,407 9% | 13,407 0% | 13,407 0% |
| 8" - YoY chg (%) | 8,756 3% | 2,100 | 2,132 | 2,229 | 2,262 | 8,724 0% | 2,423 | 2,520 | 2,617 | 2,585 | 10,145 16% | 11,341 12% | 11,567 2% | 10,985 -5% |
| 12" - YoY chg (%) | 11,457 6% | 2,682 | 3,076 | 3,272 | 3,403 | 12,433 9% | 3,578 | 3,701 | 3,964 | 4,010 | 15,252 23% | 17,304 13% | 19,116 10% | 19,297 1% |
| Gross profit | 14,624 | 2,914 | 3,284 | 3,499 | 3,805 | 13,501 | 5,152 | 6,898 | 9,038 | 10,258 | 31,346 | 62,991 | 95,033 | 94,164 |
| - Gross margin | 24.1% | 20.8% | 21.6% | 21.5% | 22.1% | 21.5% | 26.8% | 32.6% | 37.8% | 40.0% | 34.9% | 45.9% | 50.8% | 48.9% |
| Operating profit | 8,636 | 1,475 | 1,751 | 1,903 | 2,239 | 7,368 | 3,590 | 5,240 | 7,243 | 8,376 | 24,449 | 53,525 | 82,882 | 81,738 |
| - OP margin | 14.3% | 10.5% | 11.5% | 11.7% | 13.0% | 11.8% | 18.7% | 24.8% | 30.3% | 32.7% | 27.2% | 39.0% | 44.3% | 42.5% |
| Non-op income | 880 | 871 | 960 | 660 | 660 | 3,151 | 1,460 | 960 | 960 | 960 | 4,340 | 2,040 | 240 | 240 |
| Pre-tax profit | 9,516 | 2,347 | 2,711 | 2,563 | 2,899 | 10,519 | 5,050 | 6,200 | 8,203 | 9,336 | 28,789 | 55,565 | 83,122 | 81,978 |
| Net profit | 7,312 | 1,896 | 2,033 | 1,922 | 2,174 | 8,025 | 3,787 | 4,650 | 6,152 | 7,002 | 21,592 | 41,674 | 62,341 | 61,483 |
| - Net margin | ||||||||||||||
| Reported EPS (NT$) | 15.29 | 3.97 | 4.25 | 4.02 | 4.55 | 16.78 | 7.92 | 9.73 | 12.87 | 14.64 | 45.16 | 87.16 | 130.39 | 128.60 |
| - YoY chg (%) | -27% | 30% | 21% | -2% | -1% | 10% | 100% | 129% | 220% | 222% | 169% | 93% | 50% | -1% |
| - QoQ chg (%) | - | -14% | 7% | -5% | 13% | - | 74% | 23% | 32% | 14% | - | - | - | - |
Source: Company data, UBS estimates. Note: Our EPS estimates here are based on basic EPS, and may differ from the table on the cover page.
Figure 7: GWC 12-month forward PE band (x)
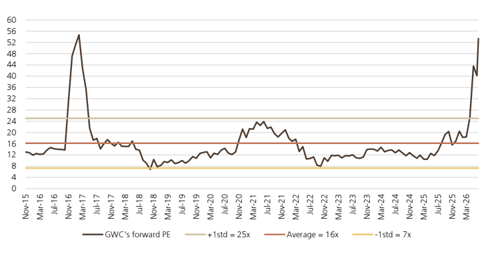
Source: LSEG, UBS
Figure 8: GWC 12-month forward P/BV band (x)
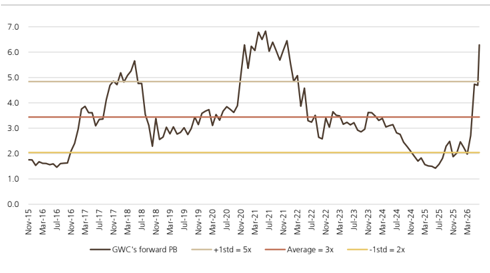
Source: LSEG, UBS
GlobalWafers (6488.TWO)
| Income Statement (NT$m) | 12/23 | 12/24 | 12/25 | 12/26E | %ch | 12/27E | %ch | 12/28E | 12/29E | 12/30E |
|---|---|---|---|---|---|---|---|---|---|---|
| Revenues | 70,652 | 62,626 | 60,598 | 62,671 | 3.4 | 89,944 | 43.5 | 137,319 | 187,024 | 192,523 |
| Gross profit | 26,441 | 19,804 | 14,624 | 13,501 | -7.7 | 31,346 | 132.2 | 62,991 | 95,033 | 94,164 |
| EBITDA (UBS) | 26,792 | 22,188 | 17,585 | 20,312 | 15.5 | 41,715 | 105.4 | 75,536 | 107,519 | 101,297 |
| Depreciation & amortisation | (6,734) | (8,069) | (8,949) | (12,944) | -44.6 | (17,266) | -33.4 | (22,011) | (24,638) | (19,559) |
| EBIT (UBS) | 20,059 | 14,118 | 8,636 | 7,368 | -14.7 | 24,449 | 231.8 | 53,525 | 82,882 | 81,738 |
| Associates & investment income | 0 | 0 | 0 | 30 | - | 40 | 33.3 | 40 | 40 | 40 |
| Other non-operating income | 3,822 | (2,789) | 1,412 | 3,238 | 129.3 | 4,500 | 39.0 | 2,200 | 400 | 400 |
| Net interest | 2,616 | 1,100 | (532) | (116) | 78.1 | (200) | -72.0 | (200) | (200) | (200) |
| Exceptionals (incl goodwill) | 0 | 0 | 0 | 0 | - | 0 | - | 0 | 0 | 0 |
| Pre-tax profit | 26,496 | 12,429 | 9,516 | 10,519 | 10.5 | 28,789 | 173.7 | 55,565 | 83,122 | 81,978 |
| Tax | (6,727) | (2,590) | (2,205) | (2,494) | -13.1 | (7,197) | -188.6 | (13,891) | (20,780) | (20,495) |
| Profit after tax | 19,770 | 9,839 | 7,312 | 8,025 | 9.8 | 21,592 | 169.1 | 41,674 | 62,341 | 61,484 |
| Preference dividends | 0 | 0 | 0 | 0 | - | 0 | - | 0 | 0 | 0 |
| Minorities | 2 | 7 | 0 | - | 0 | 0.0 | 0 | 0 | 0 | |
| Extraordinary | 0 | 0 | 0 | 0 0 | - | 0 | - | 0 | 0 | 0 |
| items Net earnings (local GAAP) | 19,772 | 9,846 | 7,312 | 8,025 | 9.7 | 21,592 | 169.1 | 41,674 | 62,341 | 61,483 |
| Net earnings (UBS) | 19,772 | 9,846 | 7,312 | 8,025 | 9.7 | 21,592 | 169.1 | 41,674 | 62,341 | 61,483 |
| Tax rate (%) | 25.4 | 20.8 | 23.2 | 23.7 | 2.3 | 25.0 | 5.4 | 25.0 | 25.0 | 25.0 |
| Per Share (NT$) | 12/23 | 12/24 | 12/25 | 12/26E | %ch | 12/27E | %ch | 12/28E | 12/29E | 12/30E |
| EPS (UBS, diluted) | 43.73 | 20.94 | 15.28 | 16.75 | 9.6 | 45.08 | 169.1 | 87.00 | 130.15 | 128.36 |
| EPS (local GAAP, diluted) | 43.73 | 20.94 | 15.28 | 16.75 | 9.6 | 45.08 | 169.1 | 87.00 | 130.15 | 128.36 |
| EPS (UBS, basic) | 45.41 | 16.37 | 16.78 | 45.16 | 87.16 | 128.60 | ||||
| DPS (net) (NT$) | 20.07 | 22.58 | 5.70 | 6.71 | 2.5 | 18.06 | 169.1 | 34.86 | 130.39 0.00 | |
| Cash EPS (UBS, diluted) 1 | 58.63 | 11.00 38.09 | 33.98 | 43.78 | 17.8 28.8 | 81.12 | 169.1 85.3 | 132.96 | 181.59 | 0.00 169.20 |
| Book value per share | 152.37 | 208.73 | 195.14 | 199.15 | 2.1 | 233.82 | 17.4 | 293.93 | 381.69 | 456.64 |
| Average shares (diluted) | 452 | 470 | 479 | 479 | 0.1 | 479 | 0.0 | 479 | 479 | 479 |
| Balance Sheet (NT$m) | 12/23 | 12/24 | 12/25 | 12/26E | %ch | 12/27E | %ch | 12/28E | 12/29E | 12/30E |
| Cash and equivalents Other current assets | 26,175 63,927 | 38,958 41,534 | 19,486 67,144 | 39,744 51,363 | 104.0 -23.5 | 52,176 77,184 | 31.3 50.3 | 78,639 115,064 | 124,333 152,764 | 176,346 150,037 |
| Total current assets | 90,101 | 80,492 | 86,629 | 91,107 | 129,360 | 42.0 | 193,702 | 277,097 | 326,383 | |
| Net tangible fixed assets | 72,251 | 119,074 | 107,241 | 104,696 | 5.2 -2.4 | 97,431 | -6.9 | 85,419 | 66,782 | 53,223 |
| Net intangible fixed assets | 2,347 | 2,448 | 2,319 | 2,357 | 1.7 | 2,357 | 0.0 | 2,357 | 2,357 | 2,357 |
| Investments / other assets | 24,290 | 22,566 | 22,153 | 24,677 | 11.4 | 29,281 | 18.7 | 36,045 | 42,776 | 42,269 |
| Total assets | 188,988 | 224,581 | 218,343 | 222,838 | 258,429 | 16.0 | 317,524 | 389,011 | 424,232 | |
| Trade payables & other ST liabilities | 33,699 | 35,927 | 23,098 | 28,392 | 2.1 | 31,032 | 9.3 | 37,369 | 42,992 | 44,106 |
| Short term debt | 40,575 | 29,137 | 31,010 | 37,445 | 22.9 20.7 | 37,445 | 0.0 | 37,445 | 37,445 | 37,445 |
| Total current liabilities | 74,274 | 65,065 | 54,109 | 65,836 | 21.7 | 68,477 | 4.0 | 74,814 | 80,436 | 81,550 |
| Long term debt | 29,221 | 0.0 | 29,221 | |||||||
| 14,542 | 37,678 | 43,244 | 29,221 | -32.4 | 29,221 | 29,221 | ||||
| Other long term liabilities | 33,719 | 30,810 | 27,695 | 32,569 | 17.6 | 48,941 | 50.3 | 72,960 | 96,865 | 95,137 |
| Preferred shares Total liabilities (incl pref | 0 122,534 | 0 133,553 | 0 125,048 | 0 127,626 | - 2.1 | 0 146,639 | - 14.9 | 0 176,995 | 0 206,523 | 0 205,908 |
| shares) Common s/h equity | 66,450 | 91,031 | 95,215 | 17.4 | (4) | 182,492 | ||||
| Minority interests | 4 | (3) | 93,299 (3) | (4) | 2.1 -2.0 | 111,793 (4) | 0.0 | 140,532 | (4) | 218,328 (4) |
| Total liabilities & equity | 188,988 | 224,581 | 218,343 | 222,838 | 2.1 | 258,429 | 16.0 | 317,524 | 389,011 | 424,232 |
| Cash Flow (NT$m) | 12/23 | 12/24 | 12/25 | 12/26E | %ch | 12/27E | %ch | 12/28E | 12/29E | 12/30E |
| Net income (before pref divs) | 19,772 | 9,846 | 7,312 | 8,025 | 9.7 | 21,592 | 169.1 | 41,674 | 62,341 | 61,483 |
| Depreciation & amortisation | 6,734 | 8,069 | 8,949 | 12,944 | 44.6 | 17,266 | 33.4 | 22,011 | 24,638 | 19,559 |
| Net change in working capital | (708) | (1,485) | (21) | 3,702 | - | (8,561) | - -257.3 | (11,748) | (11,810) | 1,395 |
| Other operating Operating cash flow | (7,862) | 306 | (3,125) | (5,884) | -88.3 | (21,027) 9,269 | (30,856) 21,081 | (30,710) 44,459 | 2,241 | |
| 17,936 | 16,737 | 13,114 | 18,786 | 43.2 | -50.7 | 84,678 | ||||
| Tangible capital expenditure | (36,475) 0 | (47,940) | (33,411) 0 | (10,000) | 70.1 | (10,000) | 0.0 | (10,000) | (6,000) | (6,000) |
| Intangible capital expenditure | 0 | 0 | - | 0 | - | 0 | 0 | |||
| Net (acquisitions) & disposals | 53 (36,620) | (6,846) 25,166 | (106) | 13 | - | 0 0 | - - | 0 | 0 0 | 0 0 |
| Other investing | (531) | 15,610 | - | 0 | 0 | |||||
| Investing cash flow | (73,042) | (29,620) | (34,049) | 5,623 | - | (10,000) | - | (10,000) | (6,000) | (6,000) |
| Equity dividends paid | (6,964) 0 | (8,748) | (5,259) 0 | (3,681) | 30.0 | (3,210) | 12.8 | (8,637) 0 | (16,669) 0 | (24,936) 0 |
| Share issues / (buybacks) | 21,891 | - | - | |||||||
| Other financing | (210) | (145) | 0 6,354 | 0 16,373 | 157.7 | 24,019 | 23,905 | (1,729) | ||
| Change in debt & pref shares | 5,270 | 12,743 | (172) 6,734 | (7,812) | - - | 0 | - | 0 | 0 | 0 |
| Financing cash flow Cash flow inc/(dec) in | (1,903) | 25,740 | 1,303 | (5,139) | - - | 13,163 | - -35.5 | 15,382 | 7,236 | (26,665) |
| cash | (57,009) | 12,857 | (19,631) | 19,270 | 12,432 0 | 26,463 | 45,694 0 | 52,013 0 | ||
| FX / non cash items cash | 2,660 | (74) | 159 | 988 | NM - | - | 0 | |||
| (54,349) | 12,784 | 20,258 | 12,432 | 45,694 | ||||||
| Balance sheet inc/(dec) in | (19,472) | 26,463 | ||||||||
| -38.6 | 52,013 |
Source: Company accounts, UBS estimates. (UBS) metrics use reported figures which have been adjusted by UBS analysts. 1 Cash EPS (UBS, diluted) is calculated using UBS net income adding back depreciation and amortization.
GlobalWafers (6488.TWO)
| Valuation (x) | 12/23 | 12/24 | 12/25 | 12/26E | 12/27E | 12/28E | 12/29E | 12/30E |
|---|---|---|---|---|---|---|---|---|
| P/E (local GAAP, diluted) | 11.6 | 24.1 | 24.1 | NM | 29.9 | 15.5 | 10.4 | 10.5 |
| P/E (UBS, diluted) | 11.6 | 24.1 | 24.1 | 80.6 | 29.9 | 15.5 | 10.4 | 10.5 |
| P/CEPS | 8.3 | 12.3 | 10.1 | 30.8 | 16.6 | 10.1 | 7.4 | 8.0 |
| Equity FCF (UBS) yield% | (8.4) | (14.2) | (12.7) | 1.4 | (0.1) | 1.7 | 6.0 | 12.2 |
| Dividend yield (net)% | 4.0 | 2.2 | 1.6 | 0.5 | 1.3 | 2.6 | 0.0 | 0.0 |
| P/BV | 3.3 | 2.4 | 1.9 | 6.8 | 5.8 | 4.6 | 3.5 | 3.0 |
| EV/revenues (core) | 2.9 | 3.7 | 3.1 | NM | 7.2 | 4.6 | 3.4 | 3.3 |
| EV/EBITDA (UBS core) | 7.6 | 10.5 | 10.6 | 33.0 | 15.6 | 8.4 | 5.9 | 6.2 |
| EV/EBIT (core) | 10.2 | 16.6 | 21.6 | 91.1 | 26.6 | 11.8 | 7.6 | 7.7 |
| EV/OpFCF (core) | NM | NM | NM | 47.9 | 28.1 | 11.7 | 7.0 | 6.5 |
| EV/op. invested capital | 4.4 | 2.5 | 1.6 | 5.6 | 6.0 | 5.6 | 5.7 | 6.2 |
| Enterprise value (NT$m) | 12/23 | 12/24 | 12/25 | 12/26E | 12/27E | 12/28E | 12/29E | 12/30E |
| Market cap. | 219,992 | 219,805 | 160,364 | 645,454 | 645,454 | 645,454 | 645,454 | 645,454 |
| Net debt (cash) | (1,129) | 28,400 | 41,313 | 40,845 | 20,706 | 1,258 | 1,258 | 1,258 |
| Buy out of minorities | 4 | 0 | 0 | 0 | 0 | 0 | 0 | 0 |
| Pension provisions/other | 0 | 0 | 0 | 0 | 0 | 0 | 0 | 0 |
| Total enterprise value | 218,868 | 248,205 | 201,677 | 686,299 | 666,160 | 646,712 | 646,712 | 646,712 |
| Non core assets | (14,184) | (14,280) | (14,811) | (15,481) | (15,462) | (15,444) | (15,425) | (15,407) |
| Core enterprise value | 204,684 | 233,924 | 186,866 | 670,818 | 650,697 | 631,268 | 631,287 | 631,306 |
| Growth (%) | 12/23 | 12/24 | 12/25 | 12/26E | 12/27E | 12/28E | 12/29E | 12/30E |
| Revenue | 0.5 | (11.4) | (3.2) | 3.4 | 43.5 | 52.7 | 36.2 | 2.9 |
| EBITDA (UBS) | (13.8) | (17.2) | (20.7) | 15.5 | 105.4 | 81.1 | 42.3 | (5.8) |
| EBIT (UBS) | (19.7) | (29.6) | (38.8) | (14.7) | NM | 118.9 | 54.8 | (1.4) |
| EPS (UBS, diluted) | 27.9 | (52.1) | (27.0) | 9.6 | 169.1 | 93.0 | 49.6 | (1.4) |
| Net DPS | 25.4 | (45.2) | (48.2) | 17.8 | 169.1 | 93.0 | (100.0) | - |
| Margins & Profitability (%) | 12/23 | 12/24 | 12/25 | 12/26E | 12/27E | 12/28E | 12/29E | 12/30E |
| Gross profit margin | 37.4 | 31.6 | 24.1 | 21.5 | 34.9 | 45.9 | 50.8 | 48.9 |
| EBITDA margin | 37.9 | 35.4 | 29.0 | 32.4 | 46.4 | 55.0 | 57.5 | 52.6 |
| EBIT (UBS) margin | 28.4 | 22.5 | 14.3 | 11.8 | 27.2 | 39.0 | 44.3 | 42.5 |
| Net earnings (UBS) margin | 28.0 | 15.7 | 12.1 | 12.8 | 24.0 | 30.3 | 33.3 | 31.9 |
| ROIC (EBIT) | 42.7 | 15.2 | 7.3 | 6.1 | 22.5 | 47.8 | 74.5 | NM |
| ROIC post tax | 31.9 | 12.0 | 5.6 | 4.7 | 16.9 | 35.8 | 55.9 | 60.5 |
| ROE (UBS) | 32.7 | 12.5 | 7.9 | 8.5 | 20.9 | 33.0 | 38.6 | 30.7 |
| Capital structure & Coverage (x) | 12/23 | 12/24 | 12/25 | 12/26E | 12/27E | 12/28E | 12/29E | 12/30E |
| Net debt / EBITDA | 1.1 | 1.3 | 3.1 | 1.3 | 0.3 | (0.2) | (0.5) | (1.1) |
| Net debt / total equity% | 43.6 | 30.6 | 58.7 | 28.3 | 13.0 | (8.5) | (31.6) | (50.2) |
| Net debt / (net debt + total equity)% | 30.3 | 23.4 | 37.0 | 22.0 | 11.5 | (9.3) | (46.2) | NM |
| Net debt/EV% | (0.5) | 11.4 | 20.5 | 6.0 | 3.1 | 0.2 | (5.4) | (12.9) |
| Capex / depreciation% | NM | NM | NM | 77.3 | 57.9 | 45.4 | 24.4 | 30.7 |
| Capex / revenue% | NM | NM | NM | 16.0 | 11.1 | 7.3 | 3.2 | 3.1 |
| EBIT / net interest | - | - | 16.2 | 63.6 | NM | NM | NM | NM |
| Dividend cover (UBS) | 2.3 | 2.1 | 2.9 | 2.5 | 2.5 | 2.5 | - | - |
| Div. payout ratio (UBS)% | 44.2 | 48.7 | 34.8 | 40.0 | 40.0 | 40.0 | - | - |
| Revenues by division (NT$m) | 12/23 | 12/24 | 12/25 | 12/26E | 12/27E | 12/28E | 12/29E | 12/30E |
| Raw wafers | 70,652 | 62,626 | 60,598 | 62,671 | 89,944 | 137,319 | 187,024 | 192,523 |
| Others | 0 | 0 | 0 | 0 | 0 | 0 | 0 | 0 |
| Total | 70,652 | 62,626 | 60,598 | 62,671 | 89,944 | 137,319 | 187,024 | 192,523 |
| (NT$m) | ||||||||
| EBIT (UBS) by division | 12/23 | 12/24 | 12/25 | 12/26E | 12/27E | 12/28E | 12/29E | 12/30E |
| Raw wafers Others | 20,059 0 | 14,118 0 | 8,636 0 | 7,368 0 | 24,449 0 | 53,525 0 | 82,882 0 | 81,738 0 |
| Total | 53,525 | 82,882 | ||||||
| 20,059 | 14,118 | 8,636 | 7,368 | 24,449 | 81,738 |
Source: Company accounts, UBS estimates. (UBS) metrics use reported figures which have been adjusted by UBS analysts.
Forecast returns
| Forecast price appreciation | 48.1% |
|---|---|
| Forecast dividend yield | 0.5% |
| Forecast stock return | 48.6% |
| Market return assumption | 6.3% |
| Forecast excess return | 42.4% |
Company Description
GlobalWafers (GWC) was founded in 2011 as a spin-off from Sino-American Silicon (SAS). It focuses on silicon raw wafer manufacturing, with a product portfolio of polished, epitaxial (EPI), annealed, diffused, non-polished, float zone (FZ) and silicon-on-insulator (SOI) types. The company has around a 17% market share of the global silicon wafer market, and ranks as the third-largest, following several acquisitions (GlobiTech in 2008, Covalent in 2012, Topsil and SunEdison Semiconductor in 2016).
Valuation Method and Risk Statement
For GlobalWafers, we derive our price target using a target PB multiple relative to industry peers. We believe GlobalWafers faces a variety of upside and downside risks, including volatile end demand, intense competition, high capital investment, industry capacity expansion and FX uncertainty. Key risks we identify for silicon-wafer manufacturers include lower semiconductor demand due to economic contraction, lower wafer demand caused by rapid miniaturisation progress, inventory adjustments in the supply chain, price competition stemming from oversupply caused by expansion of production capacity, the growing presence of Chinese manufacturers and FX fluctuation.
Quantitative Research Review
UBS Global Research publishes a quantitative assessment of its analysts' responses to certain questions about the likelihood of an occurrence of a number of short term factors in a product known as the 'Quantitative Research Review'. The views for this month can be found below. Views contained in this assessment on a particular stock reflect only the views on those short term factors which are a different timeframe to the 12-month timeframe reflected in any equity rating set out in this note. For previous responses please make reference to (i) previous UBS Global Research reports; and (ii) where no applicable research report was published that month, the Quantitative Research Review which can be found at https://neo.ubs.com/quantitative, or contact your UBS sales representative for access to the report or the Quantitative Research Team on ubs-quant-answers@ubs.com. A consolidated report which contains all responses is also available and again you should contact your UBS sales representative for details and pricing or the Quantitative Research Team on the email above.
GlobalWafers
| Question | Response |
|---|---|
| 1. Is the industry structure facing the firm likely to improve or deteriorate over the next six months? Rate on a scale of 1-5 (1 = getting worse, 3 = no change, 5 = getting better, N/A = no view) | 4 |
| 2. Is the regulatory/government environment facing the firm likely to improve or deteriorate over the next six months? Rate on a scale of 1-5 (1 = getting tougher 3 = no change, 5 = getting better, N/A = no view) | 3 |
| 3. Over the last 3-6 months in broad terms have things been improving/no change/getting worse for this stock? Rate on a scale of 1-5 (1 = getting a lot worse, 3 = not much change, 5 = getting a lot better, N/A = no view) | 4 |
| 4. Relative to the current CONSENSUS EPS forecast, is the next company EPS update likely to lead to: (1 = negative surprise vs consensus, 3 = in-line with consensus, 5 = positive surprise vs consensus expectations, N/A = no view) | 3 |
| 5. What's driving the difference? | |
| 6. Relative to YOUR current earnings forecast, is there relatively greater risk at the next earnings result of:(1 = downside skew risk to earnings, 3 = equal upside or downside risk to earnings, 5 = upside skew risk to earnings, N/A = no view) | 3 |
| 7. What's driving the difference? | |
| 8. Is there an upcoming catalyst for the company over the next three months? | |
| 9. Is there an actual or approximate date for the catalyst? | |
| 10. Is the catalyst date an actual or approximate date? | |
| 11. What is the catalyst? |
Required Disclosures
This document has been prepared by UBS Securities Pte. Ltd., Taipei Branch, an affiliate of UBS AG. UBS AG, its subsidiaries, branches and affiliates, including former Credit Suisse AG and its subsidiaries, branches and affiliates are referred to herein as "UBS".
For information on the ways in which UBS manages conflicts and maintains independence of its UBS Global Research product; historical performance information; certain additional disclosures concerning UBS Global Research recommendations; and terms and conditions for certain third party data used in research report, please visit https://www.ubs.com/disclosures. Unless otherwise indicated, information and data in this report are based on company disclosures including but not limited to annual, interim, quarterly reports and other company announcements. The figures contained in performance charts refer to the past; past performance is not a reliable indicator of future results. Additional information will be made available upon request. UBS Securities Co. Limited is licensed to conduct securities investment consultancy businesses by the China Securities Regulatory Commission. UBS acts or may act as principal in the debt securities (or in related derivatives) that may be the subject of this report. This recommendation was finalized on: 13 July 2026 10:22 AM GMT. UBS has designated certain UBS Global Research department members as Derivatives Research Analysts where those department members publish research principally on the analysis of the price or market for a derivative, and provide information reasonably sufficient upon which to base a decision to enter into a derivatives transaction. Where Derivatives Research Analysts coauthor research reports with Equity Research Analysts or Economists, the Derivatives Research Analyst is responsible for the derivatives investment views, forecasts, and/or recommendations. Quantitative Research Review: UBS Global Research publishes a quantitative assessment of its analysts' responses to certain questions about the likelihood of an occurrence of a number of short term factors in a product known as the 'Quantitative Research Review'. Views contained in this assessment on a particular stock reflect only the views on those short term factors which are a different timeframe to the 12-month timeframe reflected in any equity rating set out in this note. For the latest responses, please see the Quantitative Research Review Addendum at the back of this report, where applicable. For previous responses please make reference to (i) previous UBS Global Research reports; and (ii) where no applicable research report was published that month, the Quantitative Research Review which can be found at https://neo.ubs.com/ quantitative, or contact your UBS sales representative for access to the report or the Quantitative Research Team on ubs-quantanswers@ubs.com. A consolidated report which contains all responses is also available and again you should contact your UBS sales representative for details and pricing or the Quantitative Research team on the email above.