PDF 原檔:報告_UBS_大立光3008_20260709_original.pdf
圖片清單(已驗證 2026-07-13)
| 檔名 | size | 分類 | 親眼所見內容 |
|---|---|---|---|
_001.png |
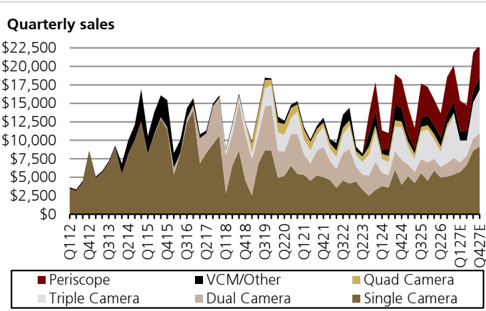
78337 | 真資料圖 | Quarterly sales by lens type 堆疊長條圖(Q112~Q427E),分 Single/Dual/Triple/Quad Camera、VCM/Other、Periscope 六類 |
_002.png |
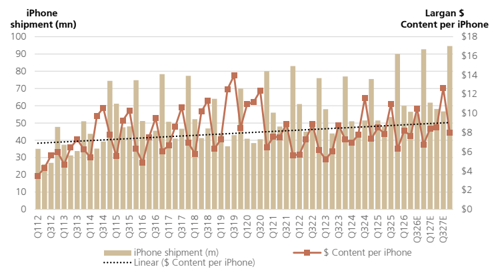
58982 | 真資料圖 | iPhone shipment(mn)vs Largan $ content per iPhone 雙軸圖(Q112~Q327E),含線性趨勢線 |
_003.png |
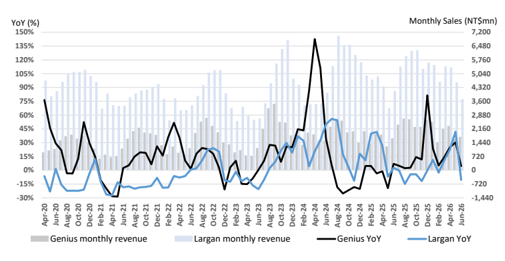
73159 | 真資料圖 | Genius vs Largan monthly revenue YoY 比較圖(Apr-20~Jun-26) |
_004.png |
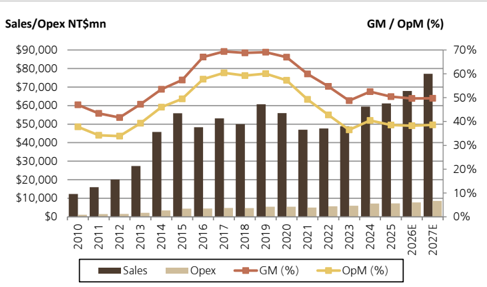
53346 | 真資料圖 | Sales/Opex(NT$mn)vs GM/OpM(%)雙軸柱狀+折線圖(2010~2027E) |
_005.png |
53704 | 真資料圖 | Smartphone shipment(mn)vs Largan $ content per smartphone 雙軸圖(Q112~Q327E),含線性趨勢線 |
_006.png |
65453 | 真資料圖 | Operating CF/Capex(NT$bn)vs FCF/Dividend per share(NT$)雙軸圖(2010~2027E) |
_007.png |
63629 | 真資料圖 | Largan share price vs NTM P/E(x) 圖(Jul-02~Jul-26),含 Avg P/E 16x、+1SD 18x、-1SD 13x |
_008.png |
45513 | 真資料圖 | Net cash(NT$mn)vs Net cash/share(NT$)柱狀圖(2010~2027E) |
_009.png |
41212 | 真資料圖 | Largan share price vs FWD EPS(NT$)雙軸圖(Jul-02~Jul-26) |
_010.png |
92319 | 真資料圖 | Price Target vs Stock Price 階梯圖(01-Apr-23~Jul-26),下方標示 Buy 評等區間色帶 |
原始內容
First Read
Largan Precision
Q226 Results: Progress continues on CPO amid mild smartphone upgrades
CPO sampling progress continues toward production ramps H227-28
Largan updated on its CPO development at its results call July 9th. The company targets the fiber array component ahead of its prism micro-lens array (PMLA), citing a competitive advantage on high precision fiber alignment, high yield and automated high volume production leveraging in-house tooling. Largan views its technology addressing grating coupling for the FAU attach to be mainstream for most designs for the next 3 years versus edge coupling (addressed by Corning's glass bridge). Largan targets pilot production complete in late Q326, 2-3 weeks to send sample, 2-8 weeks for customer acceptance and mass production by mid-2027 at the earliest. We maintain our base/upside/downside expected value of NT$13bn sales and NT$36 EPS in 2028, with swing factors around market adoption, Largan's share (where it expects to be in dual sourcing) and ASPs ranging from US$50 for sub-components to US$150-200 for FAUs.
Q226 results broadly in-line and up YoY on the good iPhone 17 cycle
Q226 sales were up 16% YoY / -12% QoQ to NT$13.7bn on the strength of the iPhone 17 cycle with upgraded periscope lens to 48MP . Product mix was 10-20% 20MP+, 5060% 10MP, 0-10% 8MP, and 20-30% others. GM/OpM were stable QoQ at 49.4%/37.7% as yields stabilized on periscope lens. Largan also booked NT$751mn non-op gain including NT$160mn FX to take EPS to NT$35.72, slightly light of street.
Spec upgrades should overcome pressure on volumes from higher memory cost
Largan guided for slight increase in July sales and further pick-up into the fall model launches in August with utilization reaching full capacity and later peak season continuing in Q426 after a later start to the build. We model Q326 up 5% YoY and 36% QoQ to NT$18.6bn and full year 2026-27 at +11-14% YoY growth reflecting continued spec upgrades. Sales are supported by content gains with new variable aperture lens adding US$2-3 additional content and new foldable model supporting sales despite risk of volume drag from hiking memory prices. For the following 1-2 years model launches, management sees potential periscope upgrades adding more lens, resolution upgrades and clearer zooming along with new specs for the main camera.
Maintain Buy with NT$5,000 PT on resilient core and CPO optionality
From slightly lower Q2 base in the core business, we slightly trim '26E/27E EPS from NT $195/NT$220 to NT$190/NT$214. We keep our SOTP valuation intact at NT$5,000 PT valuing smartphone business base value at NT$3,270 on15x 2027 P/E and CPO option at NT$1,730 based on scenario expected value of NT$36 EPS and 48x P/E. This implies a SOTP valuation of NT$5,000, which we expect to be contingent on design-in progress and CPO switch scale-up, with NT$130bn net cash (NT$994/share) as additional support.
| Highlights (NT$m) | 12/23 | 12/24 | 12/25 | 12/26E | 12/27E | 12/28E | 12/29E | 12/30E |
|---|---|---|---|---|---|---|---|---|
| Revenues | 48,842 | 59,458 | 61,148 | 67,869 | 77,189 | 83,044 | 88,315 | 93,870 |
| EBIT (UBS) | 17,807 | 24,033 | 23,558 | 25,937 | 29,796 | 34,945 | 35,215 | 37,516 |
| Net earnings (UBS) | 18,047 | 22,480 | 23,613 | 24,315 | 28,011 | 32,819 | 33,158 | 35,187 |
| EPS (UBS, diluted) (NT$) | 135.22 | 168.43 | 176.92 | 185.76 | 214.00 | 250.74 | 253.32 | 268.83 |
| DPS (net) (NT$) | 85.50 | 67.50 | 97.50 | 80.00 | 95.35 | 107.40 | 125.84 | 127.13 |
| Net (debt) / cash | 111,655 | 117,781 | 122,309 | 133,536 | 149,684 | 165,674 | 181,481 | 200,184 |
| Profitability/valuation | 12/23 | 12/24 | 12/25 | 12/26E | 12/27E | 12/28E | 12/29E | 12/30E |
| EBIT (UBS) margin% | 36.5 | 40.4 | 38.5 | 38.2 | 38.6 | 42.1 | 39.9 | 40.0 |
| ROIC (EBIT)% | 39.3 | 46.2 | 40.9 | 46.5 | 58.3 | 67.1 | 65.8 | 70.2 |
| EV/EBITDA (UBS core) x | 7.7 | 7.1 | 6.0 | 10.6 | 8.8 | 7.7 | 7.2 | 6.4 |
| P/E (UBS, diluted) x | 16.2 | 15.1 | 13.3 | 21.3 | 18.5 | 15.8 | 15.6 | 14.7 |
| Equity FCF (UBS) yield% | 2.0 | 4.3 | 3.0 | 5.0 | 5.6 | 5.9 | 6.3 | 6.9 |
| Dividend yield (net)% | 3.9 | 2.7 | 4.1 | 2.0 | 2.4 | 2.7 | 3.2 | 3.2 |
Source: Company accounts, LSEG Eikon, UBS estimates. Metrics marked as (UBS) have had analyst adjustments applied. Valuations: based on an average share price that year, (E): based on a share price of NT$ 3,950.00 on 09-Jul-2026
Equities
Taiwan
Electric Components & Equipment
12-month rating
12m price target
Price (09 Jul 2026)
RIC:
3008.TW
BBG:
3008 TT
Trading data and key metrics
52-wk range
Market cap.
Shares o/s
Free float
Avg. daily volume ('000)
Avg. daily value (m)
Common s/h equity (12/26E)
P/BV (12/26E)
NT$5,195.00-2,025.00
NT$519b/US$16.1b
131m (ORD)
70%
2,485
NT$9,080.8
NT$195b
2.7x
Net debt to EBITDA (12/26E)
NM
| EPS (UBS, diluted) (NT$) | EPS (UBS, diluted) (NT$) | EPS (UBS, diluted) (NT$) | EPS (UBS, diluted) (NT$) | EPS (UBS, diluted) (NT$) |
|---|---|---|---|---|
| From | To | %ch | Cons. | |
| 12/26E | 192.00 | 185.76 | -3 | 185.57 |
| 12/27E | 220.00 | 214.00 | -3 | 199.46 |
| 12/28E | 266.43 | 250.74 | -6 | 215.36 |
Randy Abrams
Analyst randy.abrams@ubs.com +886-2-8722 7338
Diana Chang
Analyst diana.chang@ubs.com +886-2-8722 7335
Annie Chen
Associate Analyst annie.chen@ubs.com +886-2-8722 7281
Buy
NT$5,000.00
NT$3,950
Figure 1: UBS vs. VA Consensus Q126A-Q326E and 2025A-27E
| Q126 | Q226 | Q226 | Q226 | Q326E | Q326E | Q326E | 2025 | 2026E | 2026E | 2026E | 2027E | 2027E | 2027E | |
|---|---|---|---|---|---|---|---|---|---|---|---|---|---|---|
| (NT$m) | Actual | Actual | UBSe prior | VA | UBSe | UBSe prior | VA | Actual | UBSe | UBSe prior | VA | UBSe | UBSe prior | VA |
| Revenue | 15,544 | 13,665 | 14,518 | 13,429 | 18,566 | 19,931 | 18,486 | 61,148 | 67,869 | 70,171 | 66,621 | 77,189 | 79,591 | 72,693 |
| - QoQ / YoY | -9.7% | -12.1% | -6.6% | -13.6% | 35.9% | 37.3% | 35.3% | 2.8% | 11.0% | 14.8% | 9.0% | 13.7% | 13.4% | 9.1% |
| Gross profit | 7,680 | 6,752 | 7,287 | 6,659 | 9,242 | 10,143 | 9,209 | 30,837 | 33,717 | 35,378 | 33,525 | 38,405 | 40,360 | 37,086 |
| - Gross margin | 49.4% | 49.4% | 50.2% | 49.6% | 49.8% | 50.9% | 49.8% | 50.4% | 49.7% | 50.4% | 50.3% | 49.8% | 50.7% | 51.0% |
| Operating profit | 5,812 | 5,148 | 5,590 | 5,050 | 7,144 | 7,891 | 7,032 | 23,558 | 25,937 | 27,343 | 25,728 | 29,796 | 31,444 | 28,760 |
| - OP margin | 37.4% | 37.7% | 38.5% | 37.6% | 38.5% | 39.6% | 38.0% | 38.5% | 38.2% | 39.0% | 38.6% | 38.6% | 39.5% | 39.6% |
| Non-op profit | 1,476 | 951 | 1,030 | 1,072 | 1,033 | 1,043 | 1,095 | 2,342 | 4,529 | 4,629 | 4,863 | 4,702 | 4,747 | 4,654 |
| Pre-tax profit | 7,288 | 6,099 | 6,621 | 6,122 | 8,176 | 8,934 | 8,127 | 25,900 | 30,466 | 31,972 | 30,590 | 34,498 | 36,192 | 33,496 |
| Tax | -1,112 | -1,403 | -1,788 | -1,365 | -1,390 | -1,723 | -1,327 | -4,340 | -5,418 | -6,312 | -5,582 | -6,287 | -7,301 | -6,418 |
| - Tax rate | 15.3% | 23.0% | 27.0% | 22.3% | 17.0% | 19.3% | 16.3% | 16.8% | 17.8% | 19.7% | 18.2% | 18.2% | 20.2% | 19.2% |
| Net profit | 6,123 | 4,670 | 4,833 | 4,750 | 6,736 | 7,211 | 6,792 | 21,275 | 24,869 | 25,607 | 24,964 | 28,011 | 28,890 | 26,999 |
| EPS (NT$) | 46.63 | 35.72 | 36.81 | 35.91 | 51.52 | 54.91 | 50.95 | 159.41 | 190.00 | 195.00 | 187.52 | 214.00 | 220.00 | 202.41 |
Source: Company data, Visible Alpha, UBS estimates. Note: EPS based on reported and may differ with cover page financials.
Figure 2: UBS Quarterly Sales by Lens Type
Source: Company data, UBS estimates
Figure 4: Largan content per iPhone on a rising trend
Source: UBS estimates
Figure 6: Largan and Genius sales in-line in Q126
Source: Company data
Figure 3: Largan margins stabilizing in recent years
Source: Company data, UBS estimates
Figure 5: Largan content per phone also rising
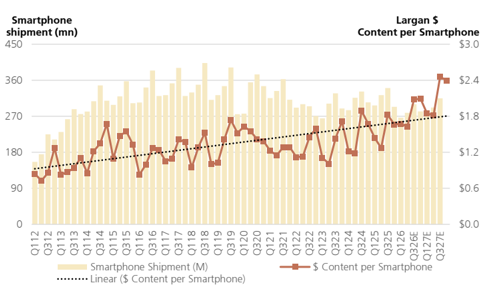
Source: UBS estimates
Figure 7: Largan operating metrics
| Segment Totals (NT$mn) | Q126 | Q226 | Q326E | Q426E | Q127E | Q227E | Q327E | Q427E | 2024 | 2025 | 2026E | 2027E |
|---|---|---|---|---|---|---|---|---|---|---|---|---|
| <=8MP lens revenue (NT$mn) | 448 | 577 | 411 | 419 | 429 | 363 | 452 | 479 | $1,552 | $1,778 | $1,855 | $1,723 |
| YoY (%) | 99% | 86% | -18% | -43% | -4% | -37% | 10% | 14% | -26% | 15% | 4% | -7% |
| QoQ (%) | -40% | 29% | -29% | 2% | 2% | -15% | 25% | 6% | ||||
| 10mp+ lens revenue (NT$mn) | 7,374 | 5,662 | 7,817 | 8,319 | 6,950 | 6,602 | 9,368 | 10,047 | $25,757 | $25,940 | $29,171 | $32,968 |
| YoY (%) | 28% | 28% | -3% | 8% | -6% | 17% | 20% | 21% | 8% | 1% | 12% | 13% |
| QoQ (%) | -4% | -23% | 38% | 6% | -16% | -5% | 42% | 7% | ||||
| 20mp+ lens revenue (NT$mn) | 3,033 | 2,951 | 3,956 | 4,982 | 3,428 | 3,722 | 5,716 | 6,740 | $14,006 | $14,184 | $14,923 | $19,605 |
| YoY (%) | -21% | -16% | 22% | 38% | 13% | 26% | 44% | 35% | 22% | 1% | 5% | 31% |
| QoQ (%) | -16% | -3% | 34% | 26% | -31% | 9% | 54% | 18% | ||||
| Periscope shipment (k units) | 17,000 | 16,000 | 23,000 | 23,000 | 20,000 | 17,000 | 24,000 | 21,000 | 60,500 | 74,000 | 79,000 | 82,000 |
| Periscope blended ASP (US$) | $6.40 | $6.38 | $6.78 | $6.68 | $6.37 | $6.47 | $6.66 | $6.57 | $7.47 | $7.22 | $7.29 | $7.13 |
| Periscope revenue (NT$mn) | $3,491 | $3,276 | $5,005 | $4,931 | $4,092 | $3,531 | $5,134 | $4,427 | $12,619 | $14,924 | $16,703 | $17,183 |
| YoY (%) | -7% | 20% | 8% | 29% | 17% | 8% | 3% | -10% | 92% | 18% | 12% | 3% |
| QoQ (%) | -8% | -6% | 53% | -1% | -17% | -14% | 45% | -14% | ||||
| VCM/Other revenue (NT$mn) | $1,198 | $1,199 | $1,377 | $1,443 | $1,260 | $1,206 | $1,572 | $1,671 | $5,522 | $4,323 | $5,217 | $5,710 |
| Total Revenue (NT$mn) | $15,544 | $13,665 | $18,566 | $20,094 | $16,159 | $15,424 | $22,241 | $23,364 | $59,458 | $61,148 | $67,869 | $77,189 |
| YoY (%) | 7% | 17% | 5% | 17% | 4% | 13% | 20% | 16% | 22% | 3% | 11% | 14% |
| QoQ (%) | -10% | -12% | 36% | 8% | -20% | -5% | 44% | 5% |
Source: Company data, UBS estimates
Figure 8: UBS P&L for Largan- mild growth at stable margins for its lens business in recent years
| Ticker Shares outstanding (mn) | Ticker Shares outstanding (mn) | 3008.TW 133.5 | Current Price (NT$) Mkt cap (NT$ mn) | Current Price (NT$) Mkt cap (NT$ mn) | Current Price (NT$) Mkt cap (NT$ mn) | $3,950 $527,179 |
|---|---|---|---|---|---|---|
| Year | 2022 | 2023 | 2024 | 2025 | 2026E | 2027E |
| Revenues (NT$ mn) | $47,675 | $48,842 | $59,458 | $61,148 | $67,869 | $77,189 |
| YoY Growth (%) | 2.4% | 21.7% | 2.8% | 11.0% | 13.7% | |
| Gross profit (NT$mn) | $26,083 | $23,794 | $31,209 | $30,837 | $33,717 | $38,405 |
| GM (%) | 54.7% | 48.7% | 52.5% | 50.4% | 49.7% | 49.8% |
| Operating profit (NT$mn) | $20,384 | $17,807 | $24,033 | $23,558 | $25,937 | $29,796 |
| OPM (%) | 42.8% | 36.5% | 40.4% | 38.5% | 38.2% | 38.6% |
| Net profit (NT$ mn) | $22,625 | $17,902 | $25,915 | $21,275 | $24,869 | $28,011 |
| EPS (NT$) | $169.52 | $134.13 | $194.17 | $159.41 | $190.00 | $214.00 |
| EPS growth (%) | -21% | 45% | -18% | 19% | 13% | |
| P/E (x) | 23.3 | 29.4 | 20.3 | 24.8 | 20.8 | 18.5 |
| Dividend yield (%) | 3% | 1.8% | 2.1% | 2.2% | 2.0% | 2.4% |
| P/B (x) | 3.4 | 3.2 | 2.8 | 2.8 | 2.7 | 2.5 |
| ROE (%) | 15% | 11% | 14% | 11% | 13% | 13% |
| Quarters | Q325 | Q425 | Q126 | Q226 | Q326E | Q426E |
|---|---|---|---|---|---|---|
| Revenues (NT$ mn) | $17,677 | $17,219 | $15,544 | $13,665 | $18,566 | $20,094 |
| QoQ Growth (%) | -2.6% | -9.7% | -12.1% | 35.9% | 8.2% | |
| Gross profit (NT$mn) | $8,352 | $8,260 | $7,680 | $6,752 | $9,242 | $10,044 |
| GM (%) | 47.2% | 48.0% | 49.4% | 49.4% | 49.8% | 50.0% |
| Operating profit (NT$mn) | $6,265 | $6,329 | $5,812 | $5,148 | $7,144 | $7,833 |
| OPM (%) | 35.4% | 36.8% | 37.4% | 37.7% | 38.5% | 39.0% |
| Net profit (NT$ mn) | $7,080 | $6,720 | $6,123 | $4,670 | $6,736 | $7,339 |
| EPS (NT$) | $53.05 | $50.35 | $45.88 | $34.99 | $51.47 | $56.07 |
Source: Company data, UBS estimates. Note: 2026E EPS based on reported.
Figure 9: UBS Cash Flow Summary - staying solidly positive
Annual (NT$mn)
Revenue
Capital spending
Capex/revenue (%)
Dep and amort
Depr/revenue (%)
Operating cash flow
Free cash flow
2021
$46,962
$5,850
12%
$4,650
10%
$20,878
$15,028
2022
$47,675
$8,256
17%
$5,031
11%
$44,207
$35,951
2023
$48,842
$8,080
17%
$5,299
11%
$18,199
$10,118
2024
$59,458
$11,126
19%
$6,038
10%
$31,579
$20,453
2025
$61,148
$12,338
20%
$7,511
12%
$26,080
$13,743
2026E
$67,869
$11,721
17%
$10,127
15%
$35,556
$23,835
2027E
$77,189
$11,135
14%
$11,862
15%
$39,764
$28,629
21-25 Avg
$52,817
$9,130
17%
$5,706
11%
$28,188
$19,058
| FCF and Dividends | 2021 | 2022 | 2023 | 2024 | 2025 | 2026E | 2027E | 21-25 Avg |
|---|---|---|---|---|---|---|---|---|
| FCF / share (NT$) | $112 | $269 | $76 | $153 | $103 | $182 | $219 | $143 |
| FCF / EV Yield (%) | 4% | 9% | 3% | 5% | 3% | 6% | 7% | 5% |
| FCF Yield (%) | 3% | 7% | 2% | 4% | 3% | 5% | 6% | 4% |
| Dividend/share (NT$) | $91.51 | $109.66 | $72.50 | $81.00 | $85.50 | $80.00 | $97.23 | $88.03 |
| Payout rate (%) | 50% | 79% | 43% | 60% | 44% | 50% | 51% | 55% |
| Dividend amount (NT$) | $12,274 | $14,636 | $9,676 | $10,811 | $11,412 | $10,471 | $12,726 | $11,762 |
| Pre-Dividend close (NT$) | $3,040.00 | $1,990.00 | $2,310.00 | $3,120.00 | $2,260.00 | $3,950.00 | $3,950.00 | |
| Dividend Yield (%) | 3.0% | 5.5% | 3.1% | 2.6% | 3.8% | 2.0% | 2.5% | 3.6% |
Source: Company data, UBS estimates
Figure 10: Op CF remains above its capex levels
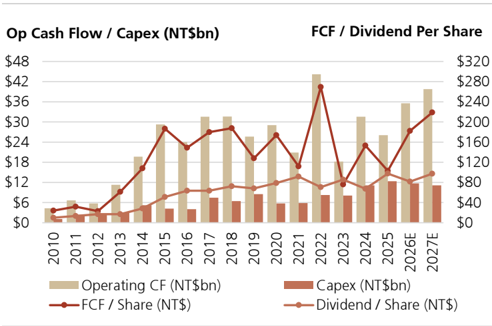
Source: Company data, UBS estimates
Figure 12: Largan trading above the high-end of its historical P/E Band
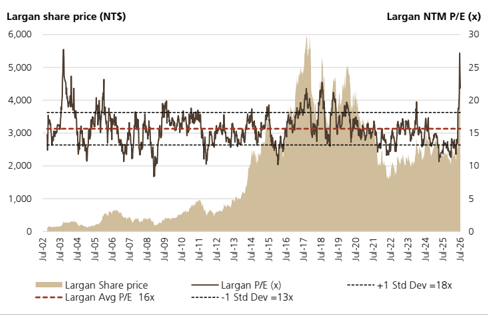
Source: LSEG Workspace
Figure 11: Rising net cash share provides room for more payouts
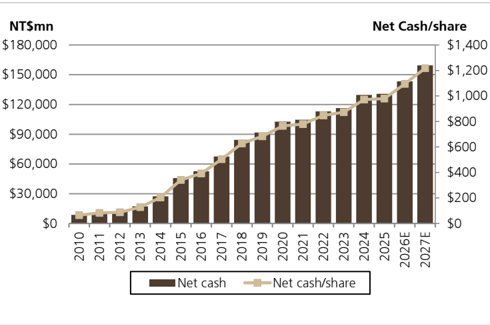
Source: Company data, UBS estimates
Figure 13: Largan re-rated by the market with its CPO optionality, though in correction recently
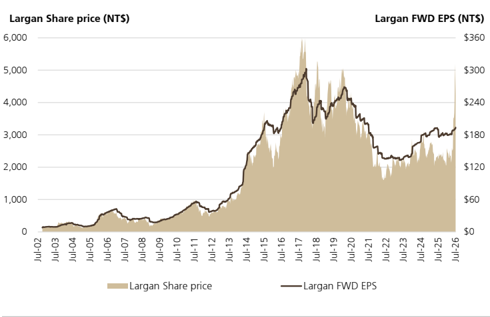
Source: LSEG Workspace
Figure 14: Largan base/upside/downside case for its opportunity and share
| Annual Scenario | Case | CPO switches (k) | FAUs/switch | FAUs (mn) | ASP (US$) | TAM (US$mn) | Share | Sales (NT$mn) | Op Profit | EPS |
|---|---|---|---|---|---|---|---|---|---|---|
| Downside/Slow adoption | 1/3 | 50 | 32 | 1.6 | $50 | $80 | 5% | $120 | $52 | $0 |
| Base | 1/3 | 100 | 64 | 6.4 | $150 | $960 | 15% | $4,320 | $1,879 | $12 |
| Upside/fast adoption | 1/3 | 200 | 96 | 19.2 | $200 | $3,840 | 30% | $34,560 | $15,034 | $95 |
| OpM (%) | 44% | |||||||||
| Tax Rate (%) | 17% | |||||||||
| Share count (mn) | 131 | |||||||||
| Industry / Largan average | 117 | 64 | 9.1 | $133 | $1,627 | 17% | $13,000 | $5,655 | $36 |
Source: UBS estimates
Figure 15: UBS Upside/Downside/Base Case Scenario
| (NT$) | New UBS | New UBS | Prior UBS | Prior UBS | Upside Case | Upside Case | Downside Case | Downside Case | |
|---|---|---|---|---|---|---|---|---|---|
| 2025 | 2026 | 2027 | 2026 | 2027 | 2026 | 2027 | 2026 | 2027 | |
| Base smartphone business | Base smartphone business | Base smartphone business | Base smartphone business | Base smartphone business | Base smartphone business | Base smartphone business | Base smartphone business | Base smartphone business | Base smartphone business |
| Sales | $61,148 | $67,869 | $77,189 | $70,171 | $79,591 | $71,262 | $81,048 | $61,082 | $68,713 12.5% |
| YoY Growth | 2.8% | 11.0% | 13.7% | 14.8% | 13.4% | 16.5% | 13.7% | -0.1% | |
| Gross Profit | $30,837 | $33,717 | $38,405 | $35,378 | $40,360 | $37,184 | $41,946 | $28,513 | $31,925 |
| GM% | 50.4% | 49.7% | 49.8% | 50.4% | 50.7% | 52.2% | 51.8% | 46.7% | 46.5% |
| Opex | $7,279 | $7,780 | $8,609 | $8,035 | $8,916 | $7,974 | $8,782 | $7,391 | $8,137 |
| Op Profit | $23,558 | $25,937 | $29,796 | 27,343 | 31,444 | 29,210 | 33,165 | 21,122 | 23,788 |
| OpM% | 38.5% | 38.2% | 38.6% | 39.0% | 39.5% | 41.0% | 40.9% | 34.6% | 34.6% |
| Non-Op | $2,342 | $4,529 | $4,702 | $4,629 | $4,747 | $4,529 | $4,702 | $4,529 | $4,702 |
| Pretax | $25,900 | $30,466 | $34,498 | $31,972 | $36,192 | $33,739 | $37,867 | $25,651 | $28,490 |
| Tax rate | -17% | -18% | -18% | -20% | -20% | -18% | -18% | -18% | -18% |
| Tax | ($4,340) | ($5,418) | ($6,287) | ($6,312) | ($7,301) | ($6,000) | ($6,901) | ($4,562) | ($5,192) |
| Minority/other | ($285) | ($179) | ($200) | ($53) | $0 | ($179) | ($200) | ($179) | ($200) |
| Net income | $21,275 | $24,869 | $28,011 | $25,607 | $28,890 | $27,560 | $30,766 | $20,910 | $23,098 |
| EPS | $159.41 | $190.00 | $214.00 | $195.00 | $220.00 | $210.55 | $235.05 | $159.75 | $176.47 |
| Shares | 133 | 131 | 131 | 131 | 131 | 131 | 131 | 131 | 131 |
| EPS vs. base case | 10.8% | 9.8% | -15.9% | -17.5% | |||||
| Current Price | $3,950 | ||||||||
| P/E | 15 | 15 | 16 | 14 | |||||
| Implied Valuation | $3,270 | $3,300 | $3,655 | $2,470 |
CPO Expected Value
EPS
EPS vs. base case
P/E
Implied Valuation
Total Largan
Implied Share Price
Upside/Downside
$36
48
$1,730
$5,000
27%
Source: Company data, UBS estimates. Note: 2026E EPS based on reported.
$35
48
$1,700
$5,000
$68
88.3%
48
$3,270
$6,925
75%
$4
-88.3%
48
$200
$2,670
-32%
Forecast returns
| Forecast price appreciation | 26.6% |
|---|---|
| Forecast dividend yield | 2.0% |
| Forecast stock return | 28.6% |
| Market return assumption | 6.3% |
| Forecast excess return | 22.3% |
Company Description
Founded in 1987, Largan Precision (Largan) is one of the world's leading manufacturers of lenses used in cameras and IT products. It specialises in plastic/hybrid lenses and, to a lesser extent, glass lenses and modules. In 2022, 20MP+ camera lenses were 10-20% of Largan's shipment mix, 10MP lenses were 50-60%, 8MP lenses were 0-10% and other lenses were 30-40%.
UBS EPS and Consensus EPS
The UBS EPS is an adjusted diluted EPS metric. It is calculated using the UBS analyst's interpretation of earnings suitable for valuation purposes divided by the diluted number of shares. This may differ to the way the consensus EPS metric has been calculated.
Valuation Method and Risk Statement
Our price target is based on PE multiple valuation.
We think Largan's downside risks include: 1) ongoing pricing pressure from smartphone OEM clients and increasingly intense competition among lens suppliers; and 2) a slower-thanexpected smartphone demand recovery in China.
Quantitative Research Review
UBS Global Research publishes a quantitative assessment of its analysts' responses to certain questions about the likelihood of an occurrence of a number of short term factors in a product known as the 'Quantitative Research Review'. The views for this month can be found below. Views contained in this assessment on a particular stock reflect only the views on those short term factors which are a different timeframe to the 12-month timeframe reflected in any equity rating set out in this note. For previous responses please make reference to (i) previous UBS Global Research reports; and (ii) where no applicable research report was published that month, the Quantitative Research Review which can be found at https://neo.ubs.com/quantitative, or contact your UBS sales representative for access to the report or the Quantitative Research Team on ubs-quant-answers@ubs.com. A consolidated report which contains all responses is also available and again you should contact your UBS sales representative for details and pricing or the Quantitative Research Team on the email above.
Largan Precision
| Question | Response |
|---|---|
| 1. Is the industry structure facing the firm likely to improve or deteriorate over the next six months? Rate on a scale of 1-5 (1 = getting worse, 3 = no change, 5 = getting better, N/A = no view) | 3 |
| 2. Is the regulatory/government environment facing the firm likely to improve or deteriorate over the next six months? Rate on a scale of 1-5 (1 = getting tougher 3 = no change, 5 = getting better, N/A = no view) | 3 |
| 3. Over the last 3-6 months in broad terms have things been improving/no change/getting worse for this stock? Rate on a scale of 1-5 (1 = getting a lot worse, 3 = not much change, 5 = getting a lot better, N/A = no view) | 4 |
| 4. Relative to the current CONSENSUS EPS forecast, is the next company EPS update likely to lead to: (1 = negative surprise vs consensus, 3 = in-line with consensus, 5 = positive surprise vs consensus expectations, N/A = no view) | 4 |
| 5. What's driving the difference? | |
| 6. Relative to YOUR current earnings forecast, is there relatively greater risk at the next earnings result of:(1 = downside skew risk to earnings, 3 = equal upside or downside risk to earnings, 5 = upside skew risk to earnings, N/A = no view) | 5 |
| 7. What's driving the difference? | |
| 8. Is there an upcoming catalyst for the company over the next three months? | |
| 9. Is there an actual or approximate date for the catalyst? | |
| 10. Is the catalyst date an actual or approximate date? | |
| 11. What is the catalyst? |
Required Disclosures
This document has been prepared by UBS Securities Pte. Ltd., Taipei Branch, an affiliate of UBS AG. UBS AG, its subsidiaries, branches and affiliates, including former Credit Suisse AG and its subsidiaries, branches and affiliates are referred to herein as "UBS".
For information on the ways in which UBS manages conflicts and maintains independence of its UBS Global Research product; historical performance information; certain additional disclosures concerning UBS Global Research recommendations; and terms and conditions for certain third party data used in research report, please visit https://www.ubs.com/disclosures. Unless otherwise indicated, information and data in this report are based on company disclosures including but not limited to annual, interim, quarterly reports and other company announcements. The figures contained in performance charts refer to the past; past performance is not a reliable indicator of future results. Additional information will be made available upon request. UBS Securities Co. Limited is licensed to conduct securities investment consultancy businesses by the China Securities Regulatory Commission. UBS acts or may act as principal in the debt securities (or in related derivatives) that may be the subject of this report. This recommendation was finalized on: 09 July 2026 02:42 PM GMT. UBS has designated certain UBS Global Research department members as Derivatives Research Analysts where those department members publish research principally on the analysis of the price or market for a derivative, and provide information reasonably sufficient upon which to base a decision to enter into a derivatives transaction. Where Derivatives Research Analysts coauthor research reports with Equity Research Analysts or Economists, the Derivatives Research Analyst is responsible for the derivatives investment views, forecasts, and/or recommendations. Quantitative Research Review: UBS Global Research publishes a quantitative assessment of its analysts' responses to certain questions about the likelihood of an occurrence of a number of short term factors in a product known as the 'Quantitative Research Review'. Views contained in this assessment on a particular stock reflect only the views on those short term factors which are a different timeframe to the 12-month timeframe reflected in any equity rating set out in this note. For the latest responses, please see the Quantitative Research Review Addendum at the back of this report, where applicable. For previous responses please make reference to (i) previous UBS Global Research reports; and (ii) where no applicable research report was published that month, the Quantitative Research Review which can be found at https://neo.ubs.com/ quantitative, or contact your UBS sales representative for access to the report or the Quantitative Research Team on ubs-quantanswers@ubs.com. A consolidated report which contains all responses is also available and again you should contact your UBS sales representative for details and pricing or the Quantitative Research team on the email above.