PDF 原檔:報告_MS_研華2395_20261007_original.pdf
圖片清單(已驗證 2026-10-09)
| 檔名 | size | 分類 | 親眼所見內容 |
|---|---|---|---|
報告_MS_研華2395_20261007_001.png |
46KB | 真資料圖 | Exhibit 1:研華股價(藍線,左軸 NT$)vs 月營收(橘線,右軸 NT$mn)雙軸走勢圖,2010-2026 |
報告_MS_研華2395_20261007_002.png |
49KB | 真資料圖 | 目標價(紅色虛線階梯,終點標示 720)vs 股價(藍色線)歷史走勢圖,2023-10 至 2026-10,另標註多次 O/I 評等變動點 |
原始內容
M Update October 7, 2026 11:36 AM GMT
Advantech | Asia Pacific
September Sales +3% MoM/ +73% YoY
In this report, we focus on Advantech s monthly sales, which we believe could be a catalyst for its share price.
Details:
- September sales were NT$10,749mn (+3% MoM/+73% YoY ,
- 3Q26 revenue reached NT$32,440mn (+24% QoQ/+83% YoY , a new quarterly record high, and surpassing our estimate of NT$28,185mn (+8% QoQ/+59% YoY by 15% and consensus of NT$29,269mn (+12% QoQ/+65% YoY by 11%.
- By region, North America (+108% outperformed; other markets, including Europe (+38% , China (+68% , Taiwan (+86% , Japan (+94% , and Korea (+68% also performed strongly. Meanwhile, emerging markets grew in single digits (% YoY .
- By segment, Intelligent Systems was +50% YoY, IoT Automation was +25% YoY, while Intelligent Service grew in single digits (% YoY. The Embedded segment grew 40% YoY, within which Embedded IoT grew 58% YoY, while Applied Computing grew 19% YoY.
Our view:
- Management attributed the strength in September to demand from markets including semis, cloud infrastructure, and testing equipment.
- Overall book-to-billratio in 3Q26 was stronger than it was in 2Q26, pointing to a sustained solid revenue outlook in the coming quarters.
- We remain constructive on Advantech. It is well positioned to benefit from accelerating IoT market growth amid edge AI proliferation.
| Morgan Stanley Taiwan Limited+ Derrick Yang Equity Analyst D rrick.Yang@morganstanl y.com | +886 2 2730-2862 |
|---|---|
| Vivi Huang R s arch Associat Vivi.Huang@morganstanl y.com | +886 2 2730-2860 |
| Morgan Stanley Asia Limited+ Andy Meng, CFA Equity Analyst Andy.M ng@morganstanl y.com | +852 2239-7689 |
Advantech(2395.TW, 2395 TT)
Greater China Technology Hardware | Taiwan
| Stock Rating - Industry View | Overweight - In-Line | |||
|---|---|---|---|---|
| Price target | NT$720.00 | |||
| Up/downside to price target | (%) | (2) | ||
| Shr price, c ose (Oct 7, 2026) | NT$733.00 | |||
| 52-Week Range | NT$754.00-271.00 | |||
| Sh out, di , curr (mn) | 864 | |||
| Mkt cap, curr (mn) | US$19,940 | |||
| EV, curr (mn) | US$19,183 | |||
| Avg dai y trading va ue (mn) | US$44 | |||
| Fiscal Year Ending | 12/25 | 12/26e | 12/27e | 12/28e |
| EPS (NT$)** | 12.25 | 20.27 | 23.77 | 26.97 |
| Prior EPS (NT$)** | - | - | - | - |
| EPS (NT$)§ | 11.43 | 20.11 | 24.18 | 28.19 |
| Revenue, net (NT$ mn) | 70,882102,882117,458129,338 | |||
| EBITDA (NT$ mn) | 12,777 | 20,941 | 24,975 | 28,349 |
| Mode Ware net inc (NT | 10,593 | 17,527 | 20,547 | 23,317 |
| $ mn) | ||||
| P/E | 23.5 | 36.2 | 30.8 | 27.2 |
| P/BV | 4.5 | 10.2 | 9.2 | 8.3 |
| RNOA (%) | 35.0 | 53.1 | 62.2 | 67.1 |
| ROE (%) | 20.5 | 31.8 | 33.2 | 33.9 |
| EV/EBITDA | 17.6 | 28.8 | 24.0 | 20.9 |
| Div y d (%) | 2.9 | 1.5 | 2.0 | 2.4 |
| FCF y d ratio (%) | 2.2 | 2.4 | 2.7 | 3.4 |
| Leverage (EOP) (%) | (43.7) | (48.6) | (51.1) | (55.3) |
Un ess otherwise noted, a metrics are based on Morgan Stan ey Mode Ware framework
** = Based on consensus methodo ogy
§ = Consensus data is provided by Refinitiv Estimates
e = Morgan Stan ey Research estimates
Morgan Stanley does and seeks to do business with companies covered in Morgan Stanley Research. As a result, investors should be aware that the firm may have a conflict of interest that could affect the objectivity of Morgan Stanley Research. Investors should consider Morgan Stanley Research as only a single factor in making their investment decision.
For analyst certification and other important disclosures, refer to the Disclosure Section, located at the end of this report.
= Analysts employed by non-U.S. affiliates are not registered with FINRA, may not be associated persons of the member and may not be subject to FINRA restrictions on communications with a subject company, public appearances and trading securities held by a research analyst account.
M Update
xhibit 1: Advant ch's monthly sal s vs. its shar pric sinc 2010
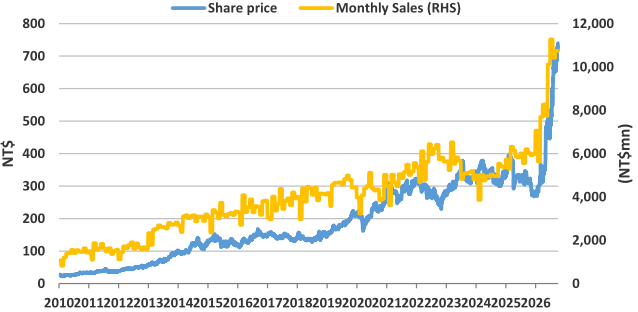
Not : Past p rformanc is no guarant of futur r sults. R sults shown do not includ transaction costs. Sourc : Company data, TEJ, Morgan Stanl y R s arch.
M Update
AlphaSignals Catalyst vent Reaction
| Company / Cata yst | Date | Impact to thesis | Cata yst versus expectation |
|---|---|---|---|
| Advantech 2395.TW | |||
| September 2026 sa es | 07 Oct 2026 | Unchanged | Modest upside surprise |
M Update
Valuation Methodology and Risks
Advantech (2395.TW)
Base case, 30x 2027e P/E. We view our target multiple as justified by our 30% earnings CAGR forecast for 2025-28. It implies a PEG of 1.0, vs. the stock's average one-year forward P/E of 25x in 2015-22 and the earnings CAGR of 8% during that period, with a PEG of 3.5.
Risks to Upside
- n Stronger-than-expected macroeconomic conditions
- nMore top- and bottom-line growth from the platform and applications
Risks to Downside
- nWeaker macro environment
- n Slower progress in edge AI implementation
M Update
Disclosure ection
The information and opinions in Morgan Stanley Research were prepared or are disseminated by Morgan Stanley Asia Limited (which accepts the responsibility for its contents) and/or Morgan Stanley Asia (Singapore) Pte. (Registration number 199206298Z) and/or Morgan Stanley Asia (Singapore) Securities Pte Ltd (Registration number 200008434H), regulated by the Monetary Authority of Singapore (which accepts legal responsibility for its contents and should be contacted with respect to any matters arising from, or in connection with, Morgan Stanley Research), and/or Morgan Stanley Taiwan Limited and/or Morgan Stanley & Co International plc, Seoul Branch, and/or Morgan Stanley Australia Limited (A.B.N. 67 003 734 576, holder of Australian financial services license No. 233742, which accepts responsibility for its contents), and/or Morgan Stanley Wealth Management Australia Pty Ltd (A.B.N. 19 009 145 555, holder of Australian financial services license No. 240813, which accepts responsibility for its contents), and/or Morgan Stanley India Company Private Limited having Corporate Identification No (CIN) U22990MH1998PTC115305, regulated by the Securities and Exchange Board of India ('SEBI') and holder of licenses as a Research Analyst (SEBI Registration No. INH000001105); Stock Broker (SEBI Stock Broker Registration No. INZ000244438), Merchant Banker (SEBI Registration No. INM000011203), and depository participant with National Securities Depository Limited (SEBI Registration No. IN-DP-NSDL-567-2021) having registered office at Altimus, Level 39 & 40, Pandurang Budhkar Marg, Worli, Mumbai 400018, India; Telephone no. +91-22-61181000; Compliance Officer Details: Mr. Tejarshi Hardas, Tel. No.: +91-22-61181000 or Email: tejarshi.hardas@morganstanley.com; Grievance officer details: Mr. Tejarshi Hardas, Tel. No.: +91-22-61181000 or Email: msic-compliance@morganstanley.com which accepts the responsibility for its contents and should be contacted with respect to any matters arising from, or in connection with, Morgan Stanley Research, and their affiliates (collectively, "Morgan Stanley"). Morgan Stanley India Company Private Limited (MSICPL) may use AI tools in providing research services. All recommendations contained herein are made by the duly qualified research analysts.
For important disclosures, stock price charts and equity rating histories regarding companies that are the subject of this report, please see the Morgan Stanley Research Disclosure Website at www.morganstanley.com/eqr/disclosures/webapp/generalresearch, or contact your investment representative or Morgan Stanley Research at 1585 Broadway, (Attention: Research Management), New York, NY, 10036 USA.
For valuation methodology and risks associated with any recommendation, rating or price target referenced in this research report, please contact the Client Support Team as follows: US/Canada +1 800 303-2495; Hong Kong +852 2848-5999; Latin America +1 718 754-5444 (U.S.); London +44 (0)20-7425-8169; Singapore +65 6834-6860; Sydney +61 (0)2-9770-1505; Tokyo +81 (0)3-6836-9000. Alternatively you may contact your investment representative or Morgan Stanley Research at 1585 Broadway, (Attention: Research Management), New York, NY 10036 USA.