PDF 原檔:報告_MS_環球晶6488_20260804_original.pdf
圖片清單(已驗證 2026-08-06)
| 檔名 | size | 分類 | 親眼所見內容 |
|---|---|---|---|
報告_MS_環球晶6488_20260804_003.png |
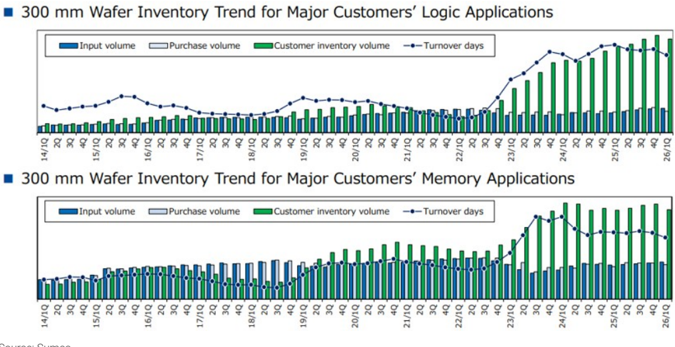
249KB | 真資料圖 | Exhibit 4:300mm Wafer Inventory Trend for Major Customers(上:Logic Applications;下:Memory Applications),各為 Input/Purchase/Customer inventory volume 柱狀+Turnover days 折線,14/1Q-26/1Q,來源 Sumco |
報告_MS_環球晶6488_20260804_002.png |
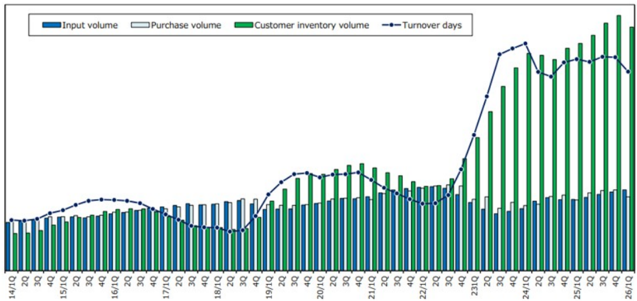
111KB | 真資料圖 | Exhibit 3:客戶 12 吋晶圓庫存趨勢(單一合併圖),Input volume/Purchase volume/Customer inventory volume 柱狀+Turnover days 折線,14/1Q-26/1Q,來源 Sumco |
報告_MS_環球晶6488_20260804_008.png |
67.5KB | 真資料圖 | Exhibit 11:GlobalWafers 一年期 forward P/E 走勢圖(2014-2025),標示 +2SD 32x/+1SD 25x/Average 18x/-1SD 10x 四條參考線 |
報告_MS_環球晶6488_20260804_001.png |
66.5KB | 裝飾·banner | 版頭 logo/機構資訊裝飾圖 |
報告_MS_環球晶6488_20260804_009.png |
63.2KB | 真資料圖 | Consensus Price Target Distribution(NT$470-2,000,MS PT 標示點)+ Risk Reward Chart:現價 NT$952(Aug'26),情境目標價 Bull NT$1,140(+19.75%)/Base NT$900(-5.46%)/Bear NT$450(-52.73%) |
報告_MS_環球晶6488_20260804_004.png |
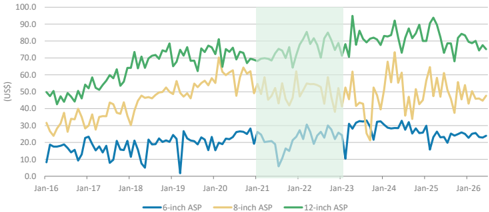
54.7KB | 真資料圖 | 6-inch/8-inch/12-inch 晶圓 ASP 走勢圖(US$,Jan-16 至 Jan-26),中段標示灰綠色區間帶(約 2021-2023) |
報告_MS_環球晶6488_20260804_006.png |
45.2KB | 真資料圖 | 日本/韓國/德國三地 12 吋晶圓價格比較走勢圖(US$,Jun-16 至 Jun-26) |
報告_MS_環球晶6488_20260804_007.png |
47.9KB | 真資料圖 | Formosa Sumco 月營收(NT$mn,柱狀)+YoY%(折線,右軸)走勢圖,Jun-15 至 Jun-26,作為 12 吋現貨指標 |
報告_MS_環球晶6488_20260804_005.png |
46.4KB | 真資料圖 | Wafer Works 月營收(NT$mn,柱狀)+YoY%(折線,右軸)走勢圖,Jun-15 至 Jun-26,作為 8 吋現貨指標 |
報告_MS_環球晶6488_20260804_010.png |
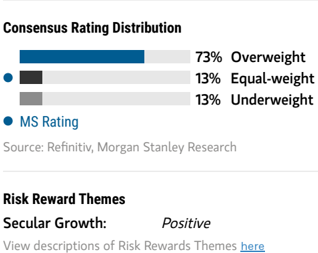
31.99KB | 真資料圖 | Consensus Rating Distribution:73% Overweight/13% Equal-weight/13% Underweight+MS Rating 標示點;下方 Risk Reward Themes:Secular Growth=Positive(雖 <40KB 仍列入,因位置緊鄰其他已驗證真資料圖) |
報告_MS_環球晶6488_20260804_011.png |
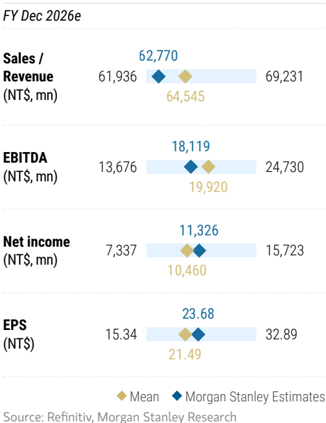
43.1KB | 真資料圖 | MS Estimates vs. Consensus(FY Dec 2026e):Sales/Revenue、EBITDA、Net income、EPS 四項區間圖,各標示 Mean 與 Morgan Stanley Estimates 菱形點(Sales 62,770 vs Mean 64,545;EPS 23.68 vs Mean 21.49) |
報告_MS_環球晶6488_20260804_012.png |
62.2KB | 真資料圖 | GlobalWafers Ratings and Target Price History 走勢圖(2023-08 至 2026-08),股價藍線+目標價紅色階梯線(500→550→500→430→375→608→588→750→900),標示 E/A、O/A 評等變動點 |
原始內容
M August 4, 2026 04:04 PM GMT
GlobalWafers Co Ltd | Asia Pacific
LTA negotiations ongoing; price hikes have never been easy
AlphaSignals Earnings Reaction
Unchanged
Impact to our thesis
Source: Company data, Morgan Stanley Research
Despite existing capacity operating near full utilization, we believe 2027 price increases could be more modest than the bull camp expects. Stay EW.
New LTA negotiations ongoing; price hikes have never been easy: Management indicated that more customers are actively discussing new LTAs (long-term agreements) to secure localized sourcing, but reiterated that pricing negotiations have never been easy. GWC noted that it "aims to gain customers' understanding and support" for new pricing. This aligns with our preview that 2027 price increases may be less aggressive than some bulls expect. On the positive side, management expects 2Q26 to mark the trough for prepayments, with levels increasing in subsequent quarters as payments from Micron are received, followed by a larger step-up in 1H27 from other customers.
New LTAs may incorporate flexible pricing and longer durations: When asked how the new LTAs could differ from 2021-22, mgmt said negotiations no longer focus solely on pricing or volume commitments. Instead, they increasingly emphasize longer-term, more flexible partnerships that include pricing adjustment mechanisms and localized supply. The longest LTAs signed in the previous cycle had terms of 5-8 years, while the recent Micron/GWC agreements cover 10 years of supply. However, ASPs from overseas fabs (GWA, Novara) do not necessarily need to exceed those of existing fabs given lower transportation costs. Flexible pricing could help GWC protect margins by reflecting underlying costs, but they do not necessarily imply continuous price increases over the next 5-10 years, as the raw wafer industry remains cyclical in our view.
Fire at Novara fab in Italy weighs on near-term supply; 2027 should see significant recovery: The fire at the Novara fab will have a greater impact on 3Q26 revenue than on 2Q26, suggesting 2026 revenue could be flat or increase only modestly YoY. Management expects meaningful rev. growth in 2027, driven by: (1) ramp-up of new greenfield capacity, (2) recovery at the Novara 8-inch fab, and (3) potential price increases. We forecast rev. growth of 4%/40% in 2026/27.
We stay EW as we believe buy-side expectations for 2027 price increases are too high despite improving raw wafer fundamentals. We note that 2027e LTA wafer pricing has not yet been finalized. We could become more constructive if pricing ultimately exceeds our expectations. Our PT of NT$900 implies 25x 2027e EPS.
Modest upside
Financial results versus consensus
Largely unchanged
Direction of next 12-month consensus EPS
Idea
| Morgan Stanley Taiwan Limited+ Charlie Chan Equity Analyst Charlie.Chan@morganstanley.com | +886 2 2730-1725 |
|---|---|
| Daniel Yen, CFA Equity Analyst Daniel.Yen@morganstanley.com | +886 2 2730-2863 |
| Lucas Wang Research Associate Lucas.Wang@morganstanley.com | +886 2 2730-2875 |

GlobalWafers Co Ltd (6488.TWO, 6488 TT)
Greater China Technology Semiconductors | Taiwan
Stock Rating
Industry View
Price target
Up/downside to price target (%)
Shr price, close (Aug 4, 2026)
52-Week Range
Sh out, dil, curr (mn)
Mkt cap, curr (mn)
EV, curr (mn)
Avg daily trading value (mn)
Equal-weight
Attractive
NT$900.00
(5)
NT$952.00
NT$1,600.00-333.00
437
NT$416,262
NT$456,217
NT$3,403
| Fiscal Year Ending | 12/25 | 12/26e | 12/27e | 12/28e |
|---|---|---|---|---|
| EPS (NT$)** | 15.28 | 23.68 | 35.56 | 51.09 |
| Prior EPS (NT$)** | - | 27.70 | 35.81 | 50.94 |
| EPS (NT$)§ | 14.68 | 21.49 | 32.77 | 55.44 |
| Revenue, net (NT$ mn) | 60,598 | 62,770 | 90,337 | 113,424 |
| EBITDA (NT$ mn) | 17,585 | 18,119 | 31,788 | 45,348 |
| ModelWare net inc (NT | 7,312 | 11,326 | 17,012 | 24,437 |
| $ mn) | ||||
| P/E | 26.6 | 40.2 | 26.8 | 18.6 |
| P/BV | 2.1 | 4.6 | 4.2 | 3.7 |
| RNOA (%) | 6.2 | 4.6 | 11.1 | 15.9 |
| ROE (%) | 8.0 | 12.1 | 17.3 | 22.5 |
| EV/EBITDA | 13.3 | 24.8 | 14.0 | 9.6 |
| Div yld (%) | 2.7 | 1.2 | 1.5 | 2.2 |
| FCF yld ratio (%)** | (11.1) | 2.3 | 2.3 | 4.8 |
| Leverage (EOP) (%) | 42.8 | 34.3 | 27.8 | 15.2 |
Unless otherwise noted, all metrics are based on Morgan Stanley ModelWare framework
§ = Consensus data is provided by Refinitiv Estimates
** = Based on consensus methodology
e = Morgan Stanley Research estimates
Morgan Stanley does and seeks to do business with companies covered in Morgan Stanley Research. As a result, investors should be aware that the firm may have a conflict of interest that could affect the objectivity of Morgan Stanley Research. Investors should consider Morgan Stanley Research as only a single factor in making their investment decision.
For analyst certification and other important disclosures, refer to the Disclosure Section, located at the end of this report.
+= Analysts employed by non-U.S. affiliates are not registered with FINRA, may not be associated persons of the member and may not be subject to FINRA restrictions on communications with a subject company, public appearances and trading securities held by a research analyst account.
M
Better supply/demand dynamics into 2027/28e
2Q26 earnings and 3Q26 outlook review: 2Q26 gross margin missed both our estimate and consensus expectations due to continued margin dilution from new capacity and the fire at the Novara 8-inch fab in Italy. Looking ahead to 3Q26, management expects a larger revenue impact from the fire, leading to more modest quarterly revenue growth than 2Q (+8.8% Q/Q), while full-year 2026 revenue may be flat to up slightly YoY.
Exhibit 1: GWC: 2Q26 earnings review
| (NT$ mn) | 2Q26 | 2Q26 | 2Q26 | 2Q26 | 2Q26 |
|---|---|---|---|---|---|
| (NT$ mn) | Actual | Q/Q | Y/Y | MS Est. | Consensus |
| Financials | |||||
| Revenue | 15,214 | 8.8% | -5.0% | 15,214 | 15,467 |
| Opex | (1,717) | 19.4% | 1.9% | (1,481) | (1,517) |
| EPS (NT$) | 7.90 | 99.2% | 124.6% | 12.18 | 6.39 |
| Ratios | |||||
| GM (%) | 20.6% | -19bps | -512bps | 23.3% | 23.0% |
| Opex (%) | 11.3% | 100bps | 76bps | 9.7% | 9.8% |
| OPM (%) | 9.4% | -120bps | -588bps | 13.6% | 13.2% |
Source: Company Data, Visible Alpha, Morgan Stanley Research estimates
Exhibit 2: GWC: 3Q26 outlook review
| (NT$ mn) | 3Q26 | 3Q26 | 3Q26 | 3Q26 | 3Q26 |
|---|---|---|---|---|---|
| (NT$ mn) | Guidance | MS Est. | Q/Q | Y/Y | Consensus |
| Financials | |||||
| Revenue | Larger impact from the fire | 16,702 | 9.8% | 15.2% | 16,686 |
| Opex | (1,531) | -10.8% | 6.9% | (1,595) | |
| EPS (NT$) | 5.52 | -30.2% | 34.0% | 4.94 | |
| Ratios | |||||
| GM (%) | 25.7% | 505bps | 732bps | 23.4% | |
| Opex (%) | 9.2% | -212bps | -72bps | 9.6% | |
| OPM (%) | 16.5% | 717bps | 803bps | 13.8% |
Source: Company Data, Visible Alpha, Morgan Stanley Research estimates
New Micron/GWC deal marks a new milestone for GWC
Micron Technology and GlobalWafers announced a deeper strategic partnership on July 9, 2026, centered on a 10-year supply agreement and US$500mn of strategic financing from Micron to support GlobalWafers' new 12-inch silicon wafer facility in Sherman, Texas. The agreement secures significant raw silicon wafer capacity for Micron's long-term manufacturing plans, with the financing linked to the buildout of GlobalWafers America's (GWA) Sherman facility.
GlobalWafers Chairwoman Doris Hsu described the agreement as the largest and longest contract in the company's history. The two companies will also collaborate on nextgeneration wafer technologies and process innovation. The Sherman plant is notable as the only US-based source of advanced 12-inch wafers.
The agreement forms part of Micron's broader US$3bn commitment to strengthen the US semiconductor supply chain and accompanies its target of manufacturing 40% of its DRAM output domestically by the mid-2030s. We believe GWC is well positioned to support ongoing foundry and memory capacity expansion in the US, not only for Micron but also for TSMC and Samsung, which are already GWC's two largest customers. We currently assume Micron/GWC LTA pricing could be 20-30% above current LTA pricing (after discounts), reflecting the higher US cost base. This would be broadly in line with, or
M
slightly above, L TAs signed in 2021-22.
Current inventory levels remain higher than during the 2021-22 upcycle when existing LTAs were signed
Notably, customer inventories of 12-inch wafers remain well above levels seen during the previous industry upcycle. According to SUMCO's inventory trend data (see Exhibit 3 ), inventory volumes and turnover days were near the lowest levels of the 2014-2026 period during 2021-22, reflecting a lean and highly utilized supply chain. By contrast, the current cycle presents the opposite picture: shipment volumes are approaching record highs, but customer inventories are also near record levels, with inventory days and absolute inventory exceeding those seen even at the peak of the 2021-22 upcycle.
This backdrop differs meaningfully from the 2021-22 environment and, in our view, supports a more moderate and delayed pricing recovery in 2027 rather than a repeat of the broad-based increases seen during the prior cycle. In 2021-22, wafer makers held significant pricing leverage as customer inventories sat near cycle lows despite record shipment volumes. Fabs consumed nearly all purchased wafers with minimal inventory buffers, creating a tight supply environment that enabled wafer manufacturers to implement meaningful price increases across 12-inch wafers.
Today, while shipment volumes remain elevated, customers also hold substantial inventory. This provides a buffer against demand growth and moderate supply disruptions, reducing the urgency to secure incremental wafer supply. Historically, this dynamic weakens suppliers' pricing power. Until inventories normalize meaningfully, wafer makers are likely to have less pricing leverage than they did entering the 2021-22 upcycle. We believe SUMCO's comment that "long-term contract prices [will be] maintained" is broadly consistent with our view that 2027 LTA negotiations will focus primarily on removing current discounts rather than driving nominal price increases.
That said, silicon wafer capacity investment remained notably more disciplined during the 2023-25 downturn than during the 2021-22 boom. In addition, raw wafer capacity requires long lead times to bring online, with equipment lead times currently ranging from 12-18 months. This underpins the strategic rationale for Micron's recent US$500mn, 10year agreement with GlobalWafers. As a result, we expect wafer pricing to continue improving in 2027, albeit in a more selective and gradual manner than during the 2021-22 cycle. We broadly expect industry pricing increases of 10-20%, with GWC's US-based capacity potentially achieving higher gains of 20-30%.
uustutter Ie mel ware mivetory trefluway. 14, 4u40)
EXIble. customer I< men walet mvemory tellu Lugie Vo. memory, May. 14, 4U4U)
• 300 mm Wafer Inventory Trend for Major Customers' Logic Applications
• 300 mm Wafer Inventory Trend for Major Customers
= Input volume Purchase volume Customer inventory volume - - Turnover days
M
Exhibit 3: Customer 12-inch wafer inventory trend (May. 12, 2026)
-Input volume Purchase volume Customer inventory volume -- Turnover days
Source: Sumco
Exhibit 4: Customer 12-inch wafer inventory trend (Logic vs. memory; May. 12, 2026)
Source: Sumco
What was pricing like during the prior wafer up-cycle?
Back in 2022, average 12-inch wafer prices (including both LTA and spot pricing) increased by approximately 12%, while 8-inch wafer pricing remained weak, suggesting that LTAs primarily supported demand for 12-inch wafers. Given that reported pricing reflects a blend of LTA and spot transactions, we estimate that nominal 12-inch LTA pricing likely increased by at least 20-30% during the 2021-22 cycle. In our view, this could represent the upper bound for potential 2027e price increases.
M
Exhibit 5: We expect memory to lift 12-inch wafer prices
Source: Taiwan Customs CPT Single Window, Morgan Stanley Research
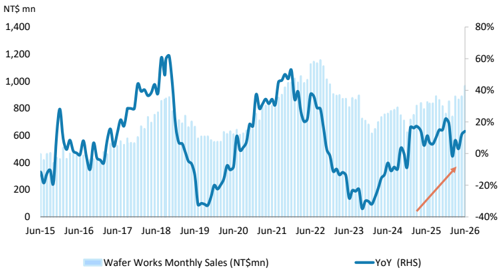
Exhibit 7: Wafer Works' monthly sales as 8-inch spot indicator
Source: TEJ, Morgan Stanley Research
Exhibit 6: Japan 12-inch wafer prices have seen consecutive quarters of decline
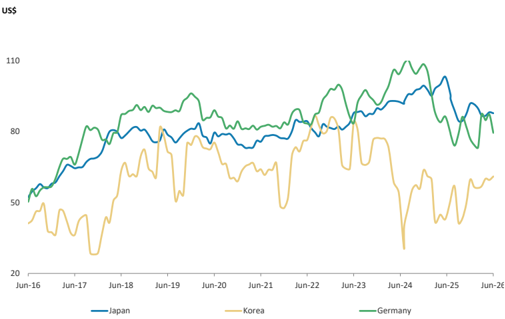
Source: Taiwan Customs CPT Single Window, Morgan Stanley Research
Exhibit 8: Formosa Sumco's monthly sales as 12-inch spot
indicator
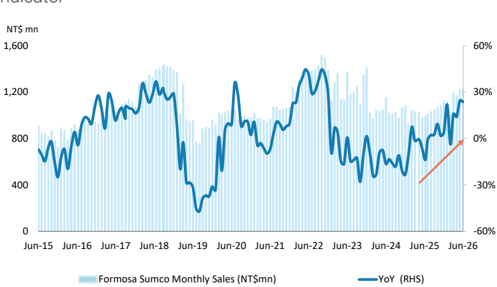
Source: TEJ, Morgan Stanley Research
M
Estimate Revisions
We cut our EPS estimates by 14.5%, 1.0%, and 0% for 2026-28, respectively. The reductions to our 2026 and 2027 forecasts primarily reflect lower investment income from Siltronic and the impact of the fire at the Novara fab.
Exhibit 9: GlobalWafers: Earnings estimate revisions
| (NT$ mn) | New 2026e | Old 2026e | Diff.% | New 2027e | Old 2027e | Diff.% | New 2028e | Old 2028e | Diff.% |
|---|---|---|---|---|---|---|---|---|---|
| Net sales | 62,770 | 63,873 | -2% | 90,337 | 90,728 | 0% | 113,424 | 113,214 | 0% |
| Gross profit | 14,282 | 15,353 | -7% | 26,102 | 26,267 | -1% | 36,821 | 36,724 | 0% |
| Operating profit | 8,258 | 9,333 | -12% | 19,486 | 19,643 | -1% | 29,394 | 29,301 | 0% |
| Pretax income | 14,466 | 16,998 | -15% | 22,683 | 22,840 | -1% | 32,582 | 32,489 | 0% |
| Net income | 11,326 | 13,248 | -15% | 17,012 | 17,130 | -1% | 24,437 | 24,367 | 0% |
| EPS for Consensus | 23.68 | 27.70 | -15% | 35.56 | 35.81 | -1% | 51.09 | 50.94 | 0% |
| Margins | |||||||||
| Gross margin | 22.8% | 24.0% | 28.9% | 29.0% | 32.5% | 32.4% | |||
| Operating margin | 13.2% | 14.6% | 21.6% | 21.7% | 25.9% | 25.9% | |||
| Pretax margin | 23.0% | 26.6% | 25.1% | 25.2% | 28.7% | 28.7% | |||
| Net margin | 18.0% | 20.7% | 18.8% | 18.9% | 21.5% | 21.5% |
Source: Company data, Morgan Stanley Research (e) estimates
M
Valuation Methodology
We keep our price target at NT$900: All of our key assumptions are unchanged, including a cost of equity of 11% (beta of 1.5, risk premium of 6% and risk-free rate of 2%), an intermediate growth rate of 13%, and a terminal growth rate of 4%.
Our bull- and bear-case values also remained NT$1,140 and NT$450, respectively, implying P/Es of 32x and 13x 2027e.
Exhibit 10: GWC: Residual income model
| (NT$ mn) | 2026e | 2027e | 2028e | 2029e | 2030e | 2031e | 2032e | 2033e | 2034e | 2035e | 2036e | 2037e |
|---|---|---|---|---|---|---|---|---|---|---|---|---|
| Total Equity | 98,534 | 108,684 | 122,913 | 129,974 | 137,952 | 146,968 | 157,156 | 168,668 | 181,677 | 196,377 | 212,988 | 231,759 |
| Net Profit | 11,438 | 17,012 | 24,437 | 27,613 | 31,203 | 35,259 | 39,843 | 45,023 | 50,876 | 57,490 | 64,963 | 73,408 |
| ROAE | 11.9% | 16.4% | 21.1% | 21.8% | 23.3% | 24.8% | 26.2% | 27.6% | 29.0% | 30.4% | 31.7% | 33.0% |
| Residual Income | 863 | 5,340 | 10,980 | 13,322 | 15,977 | 18,969 | 22,342 | 26,145 | 30,433 | 35,270 | 40,726 | 46,881 |
| Spread | 0.9% | 5.4% | 10.1% | 10.8% | 12.3% | 13.8% | 15.2% | 16.6% | 18.0% | 19.4% | 20.7% | 22.0% |
| Ending Equity Capital | 98,534 | |||||||||||
| PV of Forecast Period | 111,119 | |||||||||||
| PV of Continuing Value | 220,996 | |||||||||||
| Equity Value | 430,649 | |||||||||||
| No. of Shares | 478 | |||||||||||
| Projected Price (NT$) | 900 |
Source: Company data, Morgan Stanley Research (e) estimates
Exhibit 11: GlobalWafers: One-year forward P/E chart
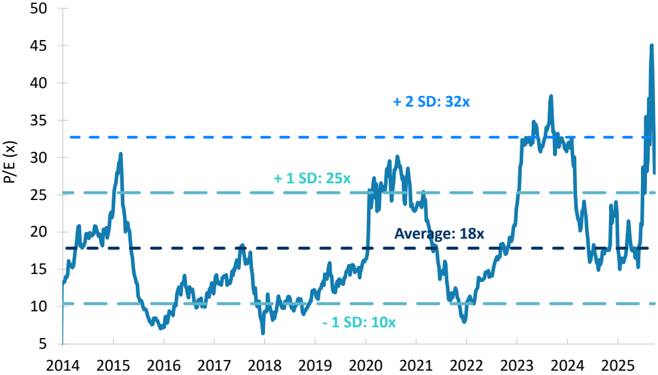
Source: Company data, Morgan Stanley Research estimates
M
Quarterly Financials
Exhibit 12: GlobalWafers: Quarterly financials
| (NT$ mn) | 1Q26 | 2Q26e | 3Q26e | 4Q26e | 1Q27e | 2Q27e | 3Q27e | 4Q27e | 2024 | 2025 | 2026e | 2027e | 2028e |
|---|---|---|---|---|---|---|---|---|---|---|---|---|---|
| Total Revenues Sequential Change | 13,985 -3.6% | 15,214 8.8% | 16,172 6.3% | 17,399 7.6% | 20,137 15.7% | 22,582 12.1% | 23,339 3.3% | 24,279 4.0% | 62,626 | 60,598 | 62,770 | 90,337 | 113,424 |
| Change vs Year Ago | -10.3% | -5.0% | 11.6% | 20.0% | 44.0% | 48.4% | 44.3% | 39.5% | -11.4% | -3.2% | 3.6% | 43.9% | 25.6% |
| Cost of Sales | (11,071) | (12,074) | (12,417) | (12,925) | (14,307) | (16,057) | (16,496) | (17,374) | (42,823) | (45,974) | (48,488) | (64,234) | (76,603) |
| Gross Profit | 2,914 | 3,140 20.6% | 3,755 23.2% | 4,474 25.7% | 5,831 29.0% | 6,525 | 6,842 | 6,904 | 19,804 | 14,624 24.1% | 14,282 22.8% | 26,102 28.9% | 36,821 |
| Gross Margin Total Opex | 20.8% (1,438) 10.3% | (1,717) 11.3% | (1,415) 8.8% | (1,453) 8.4% | (1,592) 7.9% | 28.9% | 29.3% | 28.4% (1,697) | 31.6% (5,685) | (5,987) 9.9% | (6,024) 9.6% | (6,616) | 32.5% (7,427) |
| Percent of Revenues R&D | (471) 3.4% (375) | (476) 3.1% | (481) 3.0% | (486) 2.8% | (600) 3.0% | (1,651) 7.3% | (1,675) 7.2% | 7.0% (620) 2.6% | 9.1% (2,363) 3.8% | (2,218) 3.7% | (1,914) 3.0% (1,685) | 7.3% (2,445) | 6.5% (2,740) |
| Percent of Revenues | (408) | (467) | 1.8% (630) | (406) 1.8% | 2.6% (420) | (437) | (1,352) | 2.7% (2,424) | 1.8% (2,545) 2.8% | 1.8% | |||
| Percent of Revenues Sales and Marketing | 2.7% (592) | 2.7% (832) | (434) 2.7% (500) | 2.7% (500) | (362) | (610) 2.7% | (615) | 2.2% | (1,600) 2.6% (2,169) | 3.9% | 2.7% (1,626) | 2.4% (2,042) (2,645) | |
| General and Admin Percent of Revenues | 4.2% 1,475 | 5.5% 1,423 | 3.1% 2,339 1,059 | 3,021 17.4% | 4,238 21.0% | (635) | 1.8% (640) | 1.8% (640) | (1,970) 3.1% | 3.6% 880 9,516 | 6,208 | 19,486 | 29,394 25.9% |
| Operating Income Percent of Revenues | 10.5% 871 | 9.4% | 14.5% | 2.9% | 3.1% | 2.8% | 2.7% | 2.6% | 14,118 | 8,636 14.3% | 8,258 13.2% | 2.3% | |
| 2,347 | 1,116 | 4,873 21.6% | 5,167 22.1% | 5,207 21.4% | 22.5% | 21.6% | |||||||
| Total Non-operating Income(Loss) Profit Before Taxes Percent of Revenues | 16.8% 10.0% | 4,585 30.1% | 3,398 21.0% | 4,137 23.8% | 5,060 25.1% | 5,652 25.0% | 794 5,961 | 803 6,010 | 12,429 19.8% | (2,205) | 14,466 23.0% | 22,683 25.1% | 3,188 32,582 |
| Change vs Year Ago Taxes Tax Rate | (451) 19.2% | 3,162 100.3% | 55.4% | 42.3% | 821 | 779 | 25.5% 75.4% | 24.8% | (1,690) | 15.7% | (3,141) | 3,197 | 28.7% |
| 1,896 | 17.6% | (849) 25.0% | 25.0% | (1,265) | (1,413) 25.0% | 25.0% | 23.2% | 21.7% | |||||
| (806) | (1,034) | 115.6% | 23.3% | (1,490) | 45.3% (1,503) | (8,146) 25.0% | |||||||
| 25.0% | 25.0% | (2,590) 20.8% | 7,312 | (5,671) 25.0% | |||||||||
| Net Income, Cont Ops Percent of Revenues | 13.6% | 3,779 24.8% | 2,548 15.8% | 3,103 17.8% | 3,795 | 4,239 | 4,471 19.2% | 4,508 | 9,839 15.7% | 12.1% | 11,326 18.0% | 17,012 | 24,437 |
| Minority Interest | (0) | (0) 3,779 | (0) | 18.8% | 18.8% | (0) | 18.6% (0) | 18.8% | 21.5% | ||||
| 1,896 | 24.8% | 2,548 | (0) | 19.2% | (0) | (0) | (0) | ||||||
| 3,103 | (0) | (0) | 4,471 | 7 | 0 | ||||||||
| Income (TW Percent of Revenues | 15.8% | 17.8% | 3,795 | 4,239 | 4,507 | 7,312 | |||||||
| 13.6% 30.2% | 18.8% | 18.8% | 18.0% | 18.8% | 24,437 21.5% | ||||||||
| Reported | 9,846 15.7% | 11,326 | 17,012 | ||||||||||
| GAAP) Change vs Year Ago | 29.4% | 75.4% | 18.6% 45.3% | 12.1% -25.7% | |||||||||
| 124.7% | 40.7% | 100.2% | 12.2% | -50.2% | 54.9% | 50.2% | 43.6% | ||||||
| Reported Diluted EPS (NT$, TW GAAP) | 3.96 | 7.90 | 5.33 | 6.49 | 7.93 | 8.86 | 9.35 | 9.42 | 21.14 | 15.28 | 23.68 | 35.56 | 51.09 |
| Reported Basic EPS (NT$, GAAP) | 3.97 | 7.90 | 5.33 | 6.49 | 7.94 | 9.35 | 9.43 | 21.06 | 15.29 | 35.58 | 51.11 | ||
| 8.87 | 23.69 |
Source: Company data, Morgan Stanley Research (e) estimates
M
Risk Reward - GlobalWafers Co Ltd (6488.TWO) Risk Reward - GlobalWafers Co Ltd (6488.TWO)
More balanced set-up from here
NT$900.00 PRICE TARGET
Base-case, residual income model. We assume a cost of equity of 11.0% (risk-free rate of 2.0%, beta of 1.5 and equity risk premium of 6.0%), intermediate-term growth rate of 13%, and terminal growth rate of 4.0%.
NT$969.71
BASE CASE
25x 2027e EPS
Semiconductor industry recovers from a down-cycle. Pure foundry and memory players start to see recovery in utilization rate, while both spot price and LTA amount also increase gradually. GWC's total revenue CAGR rises to >15% in 2025-28 vs. 8% in 2021-23. Gross margin stays above 25%.
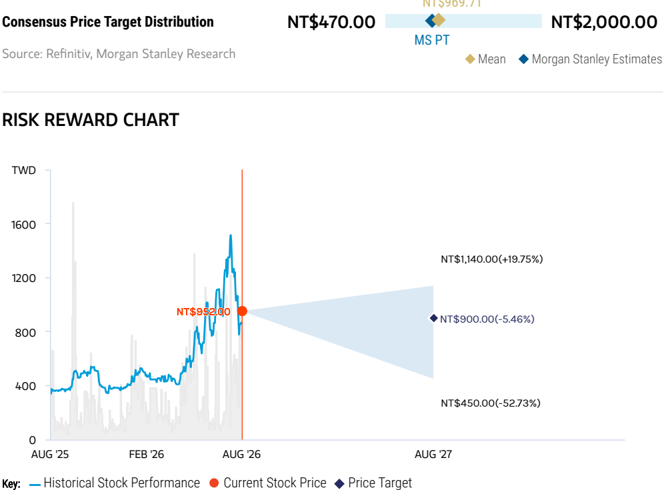
Source: Refinitiv, Morgan Stanley Research
BULL CASE
32x 2027e EPS
Semiconductor industry recovers faster than expected. Pure foundry players' utilization rates rebound to 100%, and memory players start to pull in more raw wafers. GWC's total revenue CAGR picks up to >30% in 2025-28 vs. 8% in 2021-23. Gross margin recovers to over 40% vs. 37.4% in 2023.
NT$1,140.00
NT$900.00
EQUAL-WEIGHT THESIS
- The 2H26 pricing recovery, improving LTA fulfillment, and compound semiconductor progress are constructive.
- However, we believe much of this is increasingly reflected in expectations. ▪
- At the same time, higher production costs and new capacity ramp up could limit the pace of margin recovery.
- With pricing upside back-end-loaded and cost pressure still visible, we see a more balanced set-up from here.
BEAR CASE
13x 2027e EPS
Semiconductor industry recovers more slowly than expected during this downcycle. Pure foundry players start to breach LTAs and memory players start to cut more raw wafer orders. GWC's total revenue CAGR slows to 0% in 2025-28 vs. 8% in 2021-23. Gross margin declines to <20% vs. 37.4% in 2023.
NT$450.00
M
Risk Reward - GlobalWafers Co Ltd (6488.TWO)
KEY EARNINGS INPUTS
| Drivers | Dec 2025 | Dec 2026e | Dec 2027e | Dec 2028e |
|---|---|---|---|---|
| Total Wafer Shipment (NT$, 000s) | 32,501 | 33,263 | 37,382 | 32,035 |
| GWC Utilization Rate (%) | 60.1 | 59.0 | 63.7 | 60.4 |
| Blended ASP Per Wafer (NT$) | 60 | 61 | 78 | 61 |
INVESTMENT DRIVERS
- Monthly sales inflection
- Stronger outlooks from key customers
- Extension of LTA pricing or shipments by GWC or peers
GLOBAL REVENUE EXPOSURE
Source: Morgan Stanley Research Estimate View explanation of regional hierarchies here
MS ALPHA MODELS
3 Month
Horizon
Source: Refinitiv, FactSet, Morgan Stanley Research; 1 is the highest favored Quintile and 5 is the least favored Quintile
RISKS TO PT/RATING
RISKS TO UPSIDE
- Margins improve as loosening competition boosts overall wafer ASP.
- Wafer supply remains stable or even goes into shortage amid stronger-than-expected wafer demand.
RISKS TO DOWNSIDE
- Global semiconductor growth slows again, triggering less wafer demand.
- Margins erode as rising competition lowers overall wafer ASP.
- Global wafer supply rises unexpectedly from new projects.
OWNERSHIP POSITIONING
Inst. Owners, % Active
65.4%
Source: Refinitiv, Morgan Stanley Research
MS ESTIMATES VS. CONSENSUS
M
M
Financial Summary
| Income Statement, 2024-2028e, | Year End Dec | Year End Dec | 2026e | 2027e | Balance sheet | 2024 | 2025 | 2026e | 2027e | 2028e | |
|---|---|---|---|---|---|---|---|---|---|---|---|
| (NT$ mn) | 2024 | 2025 | 2028e | (NT$ mn) | |||||||
| Turnover | 62,626 | 60,598 | 62,770 | 90,337 | 113,424 | Assets | |||||
| YoY Growth | -11.4% | -3.2% | 3.6% | 43.9% | 25.6% | Cash & Equivalents | 38,929 | 19,484 | 57,431 | 100,965 | 152,451 |
| Less: COGS | (42,823) | (45,974) | (48,488) | (64,234) | (76,603) | Marketable Security A/R & N/R | 29 10,265 | 1 10,113 | 21 12,612 | 21 17,600 | 21 22,465 |
| Variable costs | (35,056) | (37,362) | (38,998) | (52,395) | (61,249) | Inventories | 11,238 | 10,399 | 12,842 | 17,263 | 20,870 |
| Depreciation & amort | (7,766) | (8,612) | (9,490) | (11,839) | (15,354) | Other Current Asset | 20,030 | 46,632 | 31,636 | 31,636 | 31,636 |
| Gross profit | 19,804 | 14,624 | 14,282 | 26,102 | 36,821 | Total current assets | 81,349 | 87,237 | 115,205 | 168,147 | 228,106 |
| YoY Growth | -25.1% | -26.2% | -2.3% | 82.8% | 41.1% | LT Investment | 14,280 | 14,811 | 15,495 | 15,495 | 15,495 |
| %margin | 31.6% | 24.1% | 22.8% | 28.9% | 32.5% | Total Fixed Assets | 119,074 | 107,241 | 116,929 | 115,584 | 110,939 |
| Operating Expenses: | (5,685) | (5,987) | (6,024) | (6,616) | (7,427) | Total Other Assets Total Assets | 9,877 224,581 | 9,054 218,343 | 9,270 256,898 | 9,502 308,728 | 9,734 364,274 |
| R&D | (2,363) | (2,218) | (1,914) | (2,445) | (2,740) | ||||||
| Sales and Marketing | (1,352) | (1,600) | (1,685) | (1,626) | (2,042) | ||||||
| General and Admin | (1,970) | (2,169) | (2,424) | (2,545) | (2,645) | A/P & N/P | 5,371 | 4,161 | 4,686 | 6,299 | 7,615 |
| Operating Profit | 14,118 | 8,636 | 8,258 | 19,486 | 29,394 | Accrued Expenses | 0 | 0 | 0 | 0 | 0 |
| YoY Growth | -29.6% | -38.8% | -4.4% | 136.0% | 50.8% | Other Payable | 4,650 | 3,613 | 5,597 | 5,597 | 5,597 |
| %margin | 22.5% | 14.3% | 13.2% | 21.6% | 25.9% | Total Current Liab. | 65,065 | 54,109 | 63,043 | 64,656 | 65,972 |
| (1,690) | 880 | 3,188 | L-T Liabilities | 37,678 | 43,244 | 69,221 | 109,221 | 149,221 26,213 | |||
| Total Non-op | 6,208 | 3,197 | Total Other L-T Liab | 30,810 | 27,695 | 26,213 | 26,213 | ||||
| Total Liabilities | 133,553 | 125,048 | 158,476 | 200,089 | 241,406 | ||||||
| Pretax Profit | 12,429 | 9,516 | 14,466 | 22,683 | 32,582 | Common Stock Preferred Stock | 4,781 | 4,781 | 4,781 | 4,781 | 4,781 |
| YoY Growth | -53.1% | -23.4% | Capital Reserve | 44,764 | 44,764 | 44,764 | 44,764 | ||||
| %margin | 19.8% | 52.0% | 56.8% | 43.6% | 45,720 | ||||||
| 15.7% | 23.0% | 25.1% | 28.7% | Retained earnings | 40,530 | 43,753 | 48,881 | 59,097 | 73,327 | ||
| Tax | (2,590) | (2,205) | (3,141) | (5,671) | (8,146) | Total Equity | 91,028 | 93,295 | 98,422 | 108,639 | 122,868 |
| Reported Net Income | 9,846 | 7,312 | 11,326 | 17,012 | 24,437 | ||||||
| EPS (NT$) | 21.14 | 15.28 | 23.68 | 35.56 | 51.09 | Cash Flow Statement | |||||
| (NT$ mn) Net Income | 2024 9,846 | 2025 7,312 | 2026e 11,326 | 2027e 17,012 | 2028e 24,437 | ||||||
| Key Ratios | 2024 | 2025 | 2026e | 2027e | 2028e | Depreciation | 8,069 | 8,949 | 9,861 | 12,301 | 15,954 |
| Return (%) | Net Investment Losses (Gains) | (49) | 48 | (89) | (89) | (89) | |||||
| ROAA ROAE | 4.4% 11.3% | 2.7% 7.1% | 3.9% 10.7% | 5.5% 15.5% | 7.3% 21.1% | Others Cash Flow-Operating | (2,825) 15,041 | (3,564) 12,745 | (6,902) 14,194 | (7,795) 21,429 | (7,157) 33,145 |
| OP. ATO | 51.1% | 38.6% | 39.3% | 54.3% | 67.1% | ||||||
| (Purchase) of FA | (48,319) | (33,497) | (19,117) | (10,867) | (11,220) | ||||||
| Net Debt/ Equity | (0.0x) 1.3x | 0.3x 1.6x | 0.1x 1.8x | 0.1x 2.6x | (0.0x) 3.5x | (Purchase)L-T Inv. | 0 0 | 0 | 0 | 0 | 0 |
| Current Ratio Quick Ratio | Sale of L-T Inv. | 0 | 0 | 0 | 0 | ||||||
| 0.8x | 0.5x | 1.1x | 1.8x | 2.7x | Sale(Pur.)S-T Inv. | (6,846) | (106) | 13 | 0 | 0 | |
| Cash Flow-Investing | (29,620) | (34,049) | (3,633) | (11,099) | (11,452) | ||||||
| Operating Cycle AR/NR Turnover (days) | 62 | 87 | 90 | 70 | 64 | Inc(Dec)-S-T Debt | 8,222 | (3,977) | (3,382) | 0 | 0 |
| Inventory Turnover (days) | 92 | 114 | 114 | 95 | 90 | Dividend Paid | (8,748) | (5,259) | (5,343) | (6,795) | (10,207) |
| AP Turnover (days) | 40 | 44 | 42 | 35 | 33 | Dir.&Emp.Bonus | 0 | 0 | 0 | 0 | 0 |
| Cash Conversion (days) | 114 | 156 | 162 | 130 | 120 | Proceed from New Issue | 21,891 | 0 | 0 | 0 | 0 |
| 0 | |||||||||||
| Dec/Inc-TreasureSt | 0 | 0 | 0 | 0 | |||||||
| Others | 4,375 | 10,540 | 35,568 | 40,000 | 40,000 | ||||||
| e = Morgan Stanley Research Estimates | e = Morgan Stanley Research Estimates | e = Morgan Stanley Research Estimates | e = Morgan Stanley Research Estimates | e = Morgan Stanley Research Estimates | e = Morgan Stanley Research Estimates | 37,947 | 43,534 | 51,485 | |||
| Source: Company Data, Morgan Stanley Research | Source: Company Data, Morgan Stanley Research | Source: Company Data, Morgan Stanley Research | Source: Company Data, Morgan Stanley Research | Source: Company Data, Morgan Stanley Research | Source: Company Data, Morgan Stanley Research | Change in Cash Net cash/(debt), b/f | 12,765 26,165 | (19,445) 38,929 | 19,484 | 57,431 | 100,965 |
M
Risk Reward Reference links
- View explanation of Options Probabilities methodology -Options_Probabilities_Exhibit_Link.pdf
- View descriptions of Risk Rewards Themes - RR_Themes_Exhibit_Link.pdf
-
View explanation of regional hierarchies - GEG_Exhibit_Link.pdf
-
View explanation of Theme/Exposure methodology -
-
ESG_Sustainable_Solutions_External_Link.pdf
- View explanation of HERS methodology - ESG_HERS_External_Link.pdf
M
Disclosure Section
The information and opinions in Morgan Stanley Research were prepared or are disseminated by Morgan Stanley Asia Limited (which accepts the responsibility for its contents) and/or Morgan Stanley Asia (Singapore) Pte. (Registration number 199206298Z) and/or Morgan Stanley Asia (Singapore) Securities Pte Ltd (Registration number 200008434H), regulated by the Monetary Authority of Singapore (which accepts legal responsibility for its contents and should be contacted with respect to any matters arising from, or in connection with, Morgan Stanley Research), and/or Morgan Stanley Taiwan Limited and/or Morgan Stanley & Co International plc, Seoul Branch, and/or Morgan Stanley Australia Limited (A.B.N. 67 003 734 576, holder of Australian financial services license No. 233742, which accepts responsibility for its contents), and/or Morgan Stanley Wealth Management Australia Pty Ltd (A.B.N. 19 009 145 555, holder of Australian financial services license No. 240813, which accepts responsibility for its contents), and/or Morgan Stanley India Company Private Limited having Corporate Identification No (CIN) U22990MH1998PTC115305, regulated by the Securities and Exchange Board of India ('SEBI') and holder of licenses as a Research Analyst (SEBI Registration No. INH000001105); Stock Broker (SEBI Stock Broker Registration No. INZ000244438), Merchant Banker (SEBI Registration No. INM000011203), and depository participant with National Securities Depository Limited (SEBI Registration No. IN-DP-NSDL-567-2021) having registered office at Altimus, Level 39 & 40, Pandurang Budhkar Marg, Worli, Mumbai 400018, India; Telephone no. +91-22-61181000; Compliance Officer Details: Mr. Tejarshi Hardas, Tel. No.: +91-22-61181000 or Email: tejarshi.hardas@morganstanley.com; Grievance officer details: Mr. Tejarshi Hardas, Tel. No.: +91-22-61181000 or Email: msic-compliance@morganstanley.com which accepts the responsibility for its contents and should be contacted with respect to any matters arising from, or in connection with, Morgan Stanley Research, and their affiliates (collectively, "Morgan Stanley"). Morgan Stanley India Company Private Limited (MSICPL) may use AI tools in providing research services. All recommendations contained herein are made by the duly qualified research analysts.
For important disclosures, stock price charts and equity rating histories regarding companies that are the subject of this report, please see the Morgan Stanley Research Disclosure Website at www.morganstanley.com/eqr/disclosures/webapp/generalresearch, or contact your investment representative or Morgan Stanley Research at 1585 Broadway, (Attention: Research Management), New York, NY, 10036 USA.
For valuation methodology and risks associated with any recommendation, rating or price target referenced in this research report, please contact the Client Support Team as follows: US/Canada +1 800 303-2495; Hong Kong +852 2848-5999; Latin America +1 718 754-5444 (U.S.); London +44 (0)20-7425-8169; Singapore +65 6834-6860; Sydney +61 (0)2-9770-1505; Tokyo +81 (0)3-6836-9000. Alternatively you may contact your investment representative or Morgan Stanley Research at 1585 Broadway, (Attention: Research Management), New York, NY 10036 USA.