PDF 原檔:報告_GS_大立光3008_20260713_original.pdf
圖片清單(已驗證 2026-07-14)
| 檔名 | size | 分類 | 親眼所見內容 |
|---|---|---|---|
260713_gs_largan_001.png |
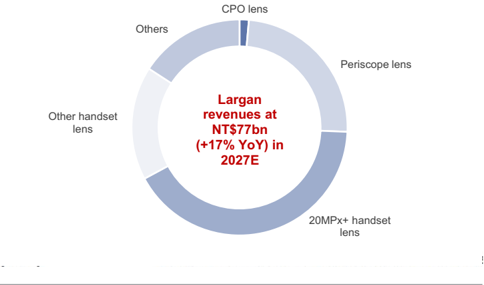
26KB | 真資料圖 | Largan 營收結構甜甜圈圖(Exhibit 1),中心文字「Largan revenues at NT$77bn (+17% YoY) in 2027E」,外圈分 CPO lens/Periscope lens/20MPx+ handset lens/Other handset lens/Others 五塊區段 |
260713_gs_largan_002.png |
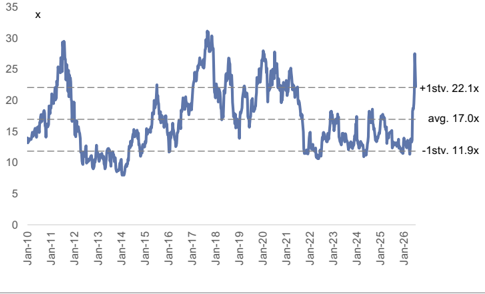
42KB | 真資料圖 | Largan 12 個月遠期本益比走勢圖(Jan-10 至 Jan-26),標示 +1 個標準差 22.1x、平均 17.0x、-1 個標準差 11.9x 三條水平虛線 |
260713_gs_largan_003.png |
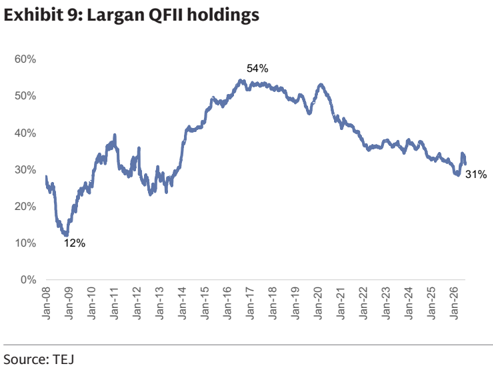
39KB | 真資料圖 | Exhibit 9:Largan QFII(外資)持股比例走勢圖(Jan-08 至 Jan-26),標示歷史高點 54%(約 2017 年)、低點 12%(約 2009 年)、最新值 31% |
260713_gs_largan_004.png |
79KB | 真資料圖 | Largan(3008.TW)Goldman Sachs 評等與目標價歷史圖(2023-08 至 2026-07),藍色方塊標註歷次目標價數字(2845→2257→2517→2553→3000→2926→3231→3021→3004→3013→3015→3460→3485→3356→3595→3644→3549→3423→6231),灰線為股價、淺灰線為台灣加權指數,圖表右下標註「Covered by Verena Jeng」 |
原始內容
For the exclusive use of KEVINLU@LENOVO.COM
Largan (3008.TW): CPO lens in progress; High-end handset lens to ramp up in 3Q26; Buy
We are positive on Largan and expect sequential revenue growth ahead following the slow season in 2Q26, driven by the ramp up of new models at its major smartphone brand customers and launches of China smartphone fl agship models. We expect premium smartphone brands to expand market share under high memory costs, and Largan's focus on high-end lens would continue to support peer outperformance with GM expansion. On CPO, despite its small contribution in the near term, we view it as a new market that could allow Largan to bene fi t from strong end demand and fast speci fi cation migration, supporting long term growth and valuation re-rating. Maintain Buy.
Exhibit 1: Largan revenues by products
Source: Goldman Sachs Global Investment Research
Key takeaways from 2Q26 earnings call
- CPO opportunities: Management highlights its focus on FA and glass-molding PMLA for FAU in CPO switches. On FA, Largan aims to start sampling in coming 2-3 weeks, with customers usually taking 2-4 weeks for quali fi cation. Largan will enter mass production once quali fi cation is passed. The company aims to complete the pilot line for FA in late 3Q26. Overall, management commented the mass production timeline could be at mid 2027 the earliest. Management highlights it currently has one project aiming for mass production (one-row FA), while other projects (e.g. two-row FA, multi-row FA) are still at an POC (proof of concept) stage. High-precision alignment is the company's key advantage, which Largan has developed active alignment and testing equipment in house, and aims to deliver high-precision FA even when the purchased V-grooves or fi bers are not of perfect quality.
Goldman Sachs does and seeks to do business with companies covered in its research reports. As a result, investors should be aware that the fi rm may have a con fl ict of interest that could a ff ect the objectivity of this report. Investors should consider this report as only a single factor in making their investment decision. For Reg AC certi fi cation and other important disclosures, see the Disclosure Appendix, or go to www.gs.com/research/hedge.html. Analysts employed by non-US a ffi liates are not registered/quali fi ed as research analysts with FINRA in the U.S.
Verena Jeng
+852-2978-1681 | verena.jeng@gs.com Goldman Sachs (Asia) L.L.C.
Allen Chang
+852-2978-2930 | allen.k.chang@gs.com Goldman Sachs (Asia) L.L.C.
Yifan Hu
+852-2978-0996 | yifan.hu@gs.com Goldman Sachs (Asia) L.L.C.
e92c7a75ab8b4efbba794e6b187208c8
For the exclusive use of KEVINLU@LENOVO.COM
-
GlassBridge impact: Management highlights that GlassBridge is designed for edge coupling CPO switches while the current mainstream is grating coupling. Also, GlassBridge is still at an early stage for commercialization (i.e. takes time for mass production, ecosystem development, and customer quali fi cation). Largan's FA is mainly used for grating coupling, and does not directly compete with GlassBridge. The precision level of FA for edge computing is also lower compared to grating coupling.
-
Near-term outlook: Largan 2Q26 revenues were up 17% YoY, mainly driven by 10-19MPx handset lens. Management expects revenues to sequentially increase in both July and August, driven by new models from its major smartphone brand customer. Variable aperture lens are more di ffi cult to produce compared to periscope lens given the more complicated design and higher requirements on particle control. GM in 2Q26 was 49.4% mainly on major customers' model transitions, while variable aperture lens were in initial ramp up with room to enhance yield rate. 3Q26 GM could improve if new lens yield rates continue to improve. Management highlights handset lens would continue to bene fi t from speci fi cation upgrade in 2027E, such as more pieces of lenses for periscope lens, periscope lens with inner zooming, higher resolution in variable aperture lens, etc.
Earnings revisions: We raise 2027-28E net income by 2% / 1% mainly on higher revenues, re fl ecting our positive view on Largan's handset lens product mix upgrade on the back of premium smartphone models gaining more market share and Largan's leading market position in high-end lens, along with continuous speci fi cation upgrade. We factor in 2Q26 results (in line) and keep our 2026 estimates largely unchanged.
Exhibit 2: Earnings revision
| 2026E | 2026E | 2026E | 2027E | 2027E | 2027E | 2028E | 2028E | 2028E | |
|---|---|---|---|---|---|---|---|---|---|
| NTm | Old | New | Chg | Old | New | Chg | Old | New | Chg |
| Revenue | 65,588 | 65,503 | 0% | 75,755 | 76,562 | 1% | 84,529 | 85,021 | 1% |
| GP | 33,715 | 33,681 | 0% | 41,290 | 42,012 | 2% | 47,458 | 47,968 | 1% |
| OP | 25,982 | 25,995 | 0% | 32,268 | 32,893 | 2% | 37,306 | 37,757 | 1% |
| Net income | 25,006 | 24,904 | 0% | 28,536 | 28,976 | 2% | 31,642 | 31,937 | 1% |
| EPS (Diluted) | 185.88 | 185.12 | 0% | 211.22 | 214.48 | 2% | 235.08 | 237.27 | 1% |
| Margins | |||||||||
| GM | 51.4% | 51.4% | 54.5% | 54.9% | 56.1% | 56.4% | |||
| OPM | 39.6% | 39.7% | 42.6% | 43.0% | 44.1% | 44.4% | |||
| NM | 38.1% | 38.0% | 37.7% | 37.8% | 37.4% | 37.6% |
Source: Goldman Sachs Global Investment Research
Exhibit 3: Largan 2Q26 results snapshot
| NT m | 2Q25 | 1Q26 | 2Q26 | QoQ | YoY | GS | Act / GS | Cons. | Act/Cons. |
|---|---|---|---|---|---|---|---|---|---|
| Revenue | 11,673 | 15,544 | 13,665 | -12% | 17% | 13,750 | -1% | 13,343 | 2% |
| GP | 6,260 | 7,680 | 6,752 | -12% | 8% | 6,820 | -1% | 6,649 | 2% |
| OP | 4,879 | 5,812 | 5,148 | -11% | 6% | 5,168 | 0% | 5,095 | 1% |
| Net income | 1,032 | 6,123 | 4,670 | -24% | 352% | 5,139 | -9% | 4,776 | -2% |
| Margins | |||||||||
| GM | 53.6% | 49.4% | 49.4% | 49.6% | 49.8% | ||||
| OPM | 41.8% | 37.4% | 37.7% | 37.6% | 38.2% | ||||
| NM | 8.8% | 39.4% | 34.2% | 37.4% | 35.8% |
Source: Company data, Goldman Sachs Global Investment Research, Bloomberg
Compared to Bloomberg consensus, we are 1% / 14% higher in operating income in 2026 / 27E, mainly on higher revenues and GM, re fl ecting our positive view on Largan's leading market position in high-end lens and the company's pixel mix upgrade, along with market share gains by premium models under high memory costs.
e92c7a75ab8b4efbba794e6b187208c8
For the exclusive use of KEVINLU@LENOVO.COM
Exhibit 4: GS vs. Bloomberg consensus
| 2026E | 2026E | 2026E | 2027E | 2027E | 2027E | |
|---|---|---|---|---|---|---|
| NT m | GS | BB | Diff% | GS | BB | Diff% |
| Revenue | 65,503 | 66,138 | -1% | 76,562 | 71,389 | 7% |
| GP | 33,681 | 33,320 | 1% | 42,012 | 36,980 | 14% |
| OP | 25,995 | 25,709 | 1% | 32,893 | 28,789 | 14% |
| Net income | 24,904 | 24,795 | 0% | 28,976 | 27,062 | 7% |
| Margins | ||||||
| GM | 51.4% | 50.4% | 54.9% | 51.8% | ||
| OPM | 39.7% | 38.9% | 43.0% | 40.3% | ||
| NM | 38.0% | 37.5% | 37.8% | 37.9% |
Source: Goldman Sachs Global Investment Research, Bloomberg
We expect sequential revenue growth in coming three months, driven by the ramp up of new models from its major smartphone brand customers. The growing foldable phones would also bring speci fi cation upgrade (e.g. slim camera, under display camera), along with more fl agship model launches in 2H26 with speci fi cation upgrade to support Largan's revenues and GM increase.
Exhibit 5: Largan monthly revenue preview
| Apr 2026 | May 2026 | Jun 2026 | Jul 2026E | Aug 2026E | Sep 2026E | 1Q26 | 2Q26 | 3Q26E | |
|---|---|---|---|---|---|---|---|---|---|
| Rev (NT$m) | 5,362 | 4,593 | 3,712 | 4,826 | 6,756 | 7,285 | 15,544 | 13,665 | 18,866 |
| YoY | 24% | 43% | -10% | -11% | 13% | 17% | 7% | 17% | 7% |
| MoM/QoQ | -1% | -14% | -19% | 30% | 40% | 8% | -10% | -12% | 38% |
| GS estimates (NT$m) | 4,769 | 3,243 | 3,795 | 14,180 | 13,750 | ||||
| Act. Vs. GS | 12% | 42% | -2% | 10% | -1% |
Source: Company data, Goldman Sachs Global Investment Research
Exhibit 6: Largan P&L
| NT$m | 1Q25 | 2Q25 | 3Q25 | 4Q25 | 1Q26 | 2Q26E | 3Q26E | 4Q26E | 2023 | 2024 | 2025 | 2026E | 2027E | 2028E |
|---|---|---|---|---|---|---|---|---|---|---|---|---|---|---|
| Revenues | 14,579 | 11,673 | 17,677 | 17,219 | 15,544 | 13,665 | 18,866 | 17,428 | 48,842 | 59,458 | 61,148 | 65,503 | 76,562 | 85,021 |
| GP | 7,965 | 6,260 | 8,352 | 8,260 | 7,680 | 6,752 | 9,339 | 9,910 | 23,808 | 31,209 | 30,837 | 33,681 | 42,012 | 47,968 |
| OP income | 6,086 | 4,879 | 6,265 | 6,329 | 5,812 | 5,148 | 7,094 | 7,940 | 17,821 | 24,033 | 23,558 | 25,995 | 32,893 | 37,757 |
| Net income | 6,443 | 1,032 | 7,080 | 6,720 | 6,123 | 4,670 | 6,699 | 7,411 | 17,902 | 25,915 | 21,275 | 24,904 | 28,976 | 31,937 |
| EPS, diluted (NT$) | 47.73 | 7.70 | 52.61 | 49.17 | 46.11 | 34.57 | 49.59 | 54.86 | 132.62 | 191.44 | 157.21 | 185.12 | 214.48 | 237.27 |
| YoY | ||||||||||||||
| Revenues | 29% | 6% | -7% | -5% | 7% | 17% | 7% | 1% | 2% | 22% | 3% | 7% | 17% | 11% |
| GP | 43% | 18% | -13% | -23% | -4% | 8% | 12% | 20% | -9% | 31% | -1% | 9% | 25% | 14% |
| OP income | 54% | 25% | -20% | -24% | -5% | 6% | 13% | 25% | -13% | 35% | -2% | 10% | 27% | 15% |
| Net income | 5% | -77% | 7% | -23% | -5% | 352% | -5% | 10% | -21% | 45% | -18% | 17% | 16% | 10% |
| EPS, diluted (NT$) | 5% | -77% | 7% | -22% | -3% | 349% | -6% | 12% | -21% | 44% | -18% | 18% | 16% | 11% |
| QoQ | ||||||||||||||
| Revenues | -20% | -20% | 51% | -3% | -10% | -12% | 38% | -8% | ||||||
| GP | -26% | -21% | 33% | -1% | -7% | -12% | 38% | 6% | ||||||
| OP income | -27% | -20% | 28% | 1% | -8% | -11% | 38% | 12% | ||||||
| Net income | -26% | -84% | 586% | -5% | -9% | -24% | 43% | 11% | ||||||
| EPS, diluted (NT$) | -24% | -84% | 583% | -7% | -6% | -25% | 43% | 11% | ||||||
| Margins | ||||||||||||||
| GM | 54.6% | 53.6% | 47.2% | 48.0% | 49.4% | 49.4% | 49.5% | 56.9% | 48.7% | 52.5% | 50.4% | 51.4% | 54.9% | 56.4% |
| OPM | 41.7% | 41.8% | 35.4% | 36.8% | 37.4% | 37.7% | 37.6% | 45.6% | 36.5% | 40.4% | 38.5% | 39.7% | 43.0% | 44.4% |
| NM | 44.2% | 8.8% | 40.1% | 39.0% | 39.4% | 34.2% | 35.5% | 42.5% | 36.7% | 43.6% | 34.8% | 38.0% | 37.8% | 37.6% |
| Ratios | ||||||||||||||
| Opex ratio | 13% | 12% | 12% | 11% | 12% | 12% | 12% | 11% | 12% | 12% | 12% | 12% | 12% | 12% |
| Tax rate | 15% | 42% | 12% | 17% | 15% | 22% | 16% | 16% | 19% | 19% | 17% | 17% | 22% | 24% |
Source: Company data, Goldman Sachs Global Investment Research
Valuation: We continue to derive our target price from 2027E PE, and update our target PE multiple from 29.5x to 29.2x. Our target PE multiple (29.2x) is derived from (1) peers' avg. ratio of trading PE to forward year fundamentals (NI YoY and OPM), which is at 0.5x (vs. 0.5x previously), and (2) Largan's forward year fundamentals: 2027-28E NI YoY at 13% on avg. (vs. 13% previously) and OPM at 44% on avg (vs. 43% previously). The new target PE multiple of 29.2x is within Largan's historical trading range of 8.0x to 31.2x, re fl ecting our positive view on Largan's expansion from handset lens to CPO lens. Our new target price is at NT$6,263 (vs. NT$6,231 previously). Maintain Buy.
e92c7a75ab8b4efbba794e6b187208c8
For the exclusive use of KEVINLU@LENOVO.COM
Exhibit 7: Largan peers comparison
| Company | Ticker | Rating | PE | NI YoY | NI YoY | OPM | OPM | Ratio |
|---|---|---|---|---|---|---|---|---|
| 2027E | 2027E | 2028E | 2027E | 2028E | ||||
| Largan | 3008.TW | Buy | 18.4 | 16% | 10% | 43.0% | 44.4% | 0.3 |
| Largan (TP implied) | 3008.TW | Buy | 29.2 | 16% | 10% | 43.0% | 44.4% | 0.5 |
| Peers | ||||||||
| AAC | 2018.HK | Buy | 12.0 | 12% | 12% | 9.7% | 10.0% | 0.6 |
| Genius | 3406.TW | NC | 14.5 | 11% | 7% | 20.4% | 20.7% | 0.5 |
| T&S | 300570.SZ | NC | 55.2 | 90% | 52% | 24.7% | 24.0% | 0.6 |
| VPEC | 2455.TW | Buy | 34.8 | 55% | 40% | 33.4% | 35.3% | 0.4 |
| Average | 29.1 | 42% | 28% | 22.1% | 22.5% | 0.5 |
NC: Not Covered; data from Bloomberg consensus
Source: Goldman Sachs Global Investment Research, Bloomberg
Exhibit 8: Largan 12M forward PE ratio
Source: Company data, Goldman Sachs Global Investment Research, Bloomberg
Price Target Risks and Methodology - Largan
Valuation : We are Buy rated on Largan and have a 12-month target price of NT$6,263, which is based on 2027E P/E. Our target P/E multiple of 29.2x is derived from (1) peers' avg. ratio of trading PE to forward year fundamentals (NI YoY and OPM), which is at 0.5x, and (2) Largan's forward year fundamentals: 2027-28E NI YoY at 13% on avg. and OPM at 44% on avg. The target PE multiple of 29.2x is within Largan's historical trading range of 8.0x to 31.2x, re fl ecting our positive view on Largan's expansion from handset lens to CPO lens.
Key risks : (1) slower-than-expected smartphone market growth, (2) fi ercer competition in handset lenses, (3) slower-than-expected smartphone camera lens speci fi cation upgrades or Largan's handset lens pixel mix upgrade, (4) slower-than-expected CPO lens ramp up, and (5) fi ercer competition in CPO lens.
e92c7a75ab8b4efbba794e6b187208c8
For the exclusive use of KEVINLU@LENOVO.COM
3008.TW
12m Price Target:
NT$6,263.00
Price:
NT$4,345.00
Upside:
44.1%
| Buy | GS Forecast | ||||
|---|---|---|---|---|---|
| 12/25 | 12/26E | 12/27E | 12/28E | ||
| Market c ap: NT$584.5b n / $ 1 8. 1 b n En terpr is e v a lu e: NT$45 7 . 3 b n / $ 1 4. 2 b n 3m AD T V : NT$ 9 . 3 b n / $ 292 .5 mn Ta iw a n G reater Chin a Te chnology M &A R a n k: 3 L ea s e s incl . in n et d ebt & EV? : N o | Revenue ( NT$m n ) N e w | 61 , 1 4 7 .9 | 65 , 5 03.4 | 76 , 561 . 8 | 85 ,0 2 0. 5 |
| Market c ap: NT$584.5b n / $ 1 8. 1 b n En terpr is e v a lu e: NT$45 7 . 3 b n / $ 1 4. 2 b n 3m AD T V : NT$ 9 . 3 b n / $ 292 .5 mn Ta iw a n G reater Chin a Te chnology M &A R a n k: 3 L ea s e s incl . in n et d ebt & EV? : N o | Revenue (NT$ mn) Old | 61,147.9 | 65,588.5 | 75,755.3 | 84,529.2 |
| Market c ap: NT$584.5b n / $ 1 8. 1 b n En terpr is e v a lu e: NT$45 7 . 3 b n / $ 1 4. 2 b n 3m AD T V : NT$ 9 . 3 b n / $ 292 .5 mn Ta iw a n G reater Chin a Te chnology M &A R a n k: 3 L ea s e s incl . in n et d ebt & EV? : N o | EBITDA (NT$ mn) | 31,290.3 | 34,560.3 | 41,440.9 | 46,364.1 |
| Market c ap: NT$584.5b n / $ 1 8. 1 b n En terpr is e v a lu e: NT$45 7 . 3 b n / $ 1 4. 2 b n 3m AD T V : NT$ 9 . 3 b n / $ 292 .5 mn Ta iw a n G reater Chin a Te chnology M &A R a n k: 3 L ea s e s incl . in n et d ebt & EV? : N o | E PS ( NT$) N e w | 15 9.4 1 | 187 .34 | 217 . 11 | 2 39. 2 9 |
| Market c ap: NT$584.5b n / $ 1 8. 1 b n En terpr is e v a lu e: NT$45 7 . 3 b n / $ 1 4. 2 b n 3m AD T V : NT$ 9 . 3 b n / $ 292 .5 mn Ta iw a n G reater Chin a Te chnology M &A R a n k: 3 L ea s e s incl . in n et d ebt & EV? : N o | EPS (NT$) Old | 159.41 | 188.11 | 213.81 | 237.08 |
| Market c ap: NT$584.5b n / $ 1 8. 1 b n En terpr is e v a lu e: NT$45 7 . 3 b n / $ 1 4. 2 b n 3m AD T V : NT$ 9 . 3 b n / $ 292 .5 mn Ta iw a n G reater Chin a Te chnology M &A R a n k: 3 L ea s e s incl . in n et d ebt & EV? : N o | P/E (X) | 14.8 | 23.2 | 20.0 | 18.2 |
| Market c ap: NT$584.5b n / $ 1 8. 1 b n En terpr is e v a lu e: NT$45 7 . 3 b n / $ 1 4. 2 b n 3m AD T V : NT$ 9 . 3 b n / $ 292 .5 mn Ta iw a n G reater Chin a Te chnology M &A R a n k: 3 L ea s e s incl . in n et d ebt & EV? : N o | P/B (X) | 1.7 | 2.9 | 2.7 | 2.5 |
| Market c ap: NT$584.5b n / $ 1 8. 1 b n En terpr is e v a lu e: NT$45 7 . 3 b n / $ 1 4. 2 b n 3m AD T V : NT$ 9 . 3 b n / $ 292 .5 mn Ta iw a n G reater Chin a Te chnology M &A R a n k: 3 L ea s e s incl . in n et d ebt & EV? : N o | Dividend yield (%) | 3.3 | 2.1 | 2.4 | 2.7 |
| Market c ap: NT$584.5b n / $ 1 8. 1 b n En terpr is e v a lu e: NT$45 7 . 3 b n / $ 1 4. 2 b n 3m AD T V : NT$ 9 . 3 b n / $ 292 .5 mn Ta iw a n G reater Chin a Te chnology M &A R a n k: 3 L ea s e s incl . in n et d ebt & EV? : N o | CROCI (%) | 12.5 | 16.0 | 16.1 | 15.8 |
| Market c ap: NT$584.5b n / $ 1 8. 1 b n En terpr is e v a lu e: NT$45 7 . 3 b n / $ 1 4. 2 b n 3m AD T V : NT$ 9 . 3 b n / $ 292 .5 mn Ta iw a n G reater Chin a Te chnology M &A R a n k: 3 L ea s e s incl . in n et d ebt & EV? : N o | 6/26 | 9 /26E | 12/26E | 3 /27E | |
| Market c ap: NT$584.5b n / $ 1 8. 1 b n En terpr is e v a lu e: NT$45 7 . 3 b n / $ 1 4. 2 b n 3m AD T V : NT$ 9 . 3 b n / $ 292 .5 mn Ta iw a n G reater Chin a Te chnology M &A R a n k: 3 L ea s e s incl . in n et d ebt & EV? : N o | EPS (NT$) | 34.99 | 50.20 | 55.53 | 50.33 |
Source: Company data, Goldman Sachs Research estimates, FactSet. Price as of 13 Jul 2026 close.
e92c7a75ab8b4efbba794e6b187208c8
For the exclusive use of KEVINLU@LENOVO.COM