PDF 原檔:報告_Daiwa_晶碩6491_20260731_original.pdf
圖片清單(已驗證 2026-08-03)
| 檔名 | size | 分類 | 親眼所見內容 |
|---|---|---|---|
260731_daiwa_Pegavision_002.png |
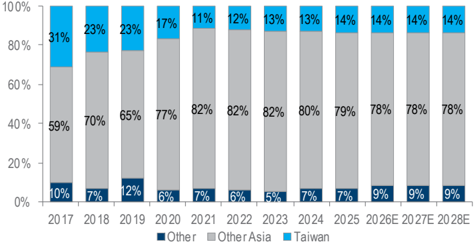
45KB | 真資料圖 | 營收地區占比堆疊長條圖(2017-2028E),Taiwan/Other Asia/Other 三色分層,Other Asia(多為日本)占比自 2020 起穩定在 77-82%,2026E-28E 略降至 78% |
260731_daiwa_Pegavision_003.png |
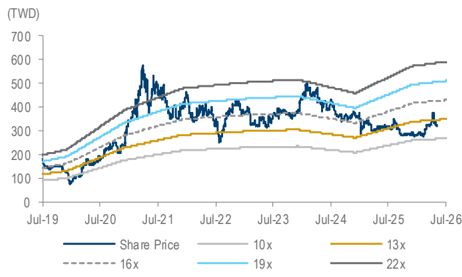
45KB | 真資料圖 | 股價 vs. 1 年期 forward PER 帶狀圖(Jul-19 至 Jul-26),標示 10x/13x/16x/19x/22x 五條估值線 |
260731_daiwa_Pegavision_001.png |
28KB | 裝飾·logo·banner | <40KB 未逐張 Read,預設 logo(股價表現區塊小標) |
原始內容
Taiwan
Pegavision Corp (6491 TT)
Target price:
TWD375.00 (from TWD335.00)
Share price (31 Jul): TWD324.00 | Up/downside: +15.7%
2Q26 results review: better than expected
- 2Q26 results beat both Daiwa and Bloomberg estimates
- Intact outlook for silicone hydrogel contact lenses and Japan market
- Reaffirming our Outperform (2) rating; raising 12-month TP to TWD375
What's new: Pegavision released its 2Q26 results on 31 July after market hours. The company maintained a positive view on the Japan market and its product roadmap for silicone hydrogel contact lenses in multiple regions, including Japan and Europe. We reaffirm our Outperform (2) call.
What's the impact: 2Q26 results beat. Pegavision's 2Q26 revenue of TWD2,115m (+12.1% QoQ; +30.0% YoY) beat our estimate and the Bloomberg consensus by 14.3% and 1.1%, respectively, mainly due to the Japan market in light of its order share gains following vendor consolidation. Its gross margin of 53.0% (vs. 53.3% in 1Q26 and 50.9% in 2Q25) was roughly in line with our estimate (53.0%) and the Bloomberg consensus estimate (53.2%). Operating margin of 27.6% (vs. 28.8% in 1Q26 and 23.3% in 2Q25) beat our estimate (25.5%) but was slightly below the Bloomberg consensus estimate (28.2%). Its 2Q26 operating profit of TWD585m (+7.7% QoQ; +54.3% YoY) beat our estimate by 23.9% but was in line with consensus. Due to some non-op gains and a lower-thanexpected tax rate, its 2Q26 net profit came in at TWD544m (+15.2% QoQ; +73.6% YoY), beating our and Bloomberg consensus estimates by 33.8% and 10.6%, respectively. Its 2Q26 EPS was TWD7.07. Japan accounted for 60%+ of its revenue in 1H26 while China accounted for 10%+.
Bright 2H26 revenue; capacity expansion plans in Vietnam and
Taiwan. Pegavision targets revenue to grow QoQ in 2H26, driven by the ramp-up of silicone hydrogel daily contact lenses, which accounted for 10% of 2Q26 revenue and is targeted to contribute 15% of 4Q26 revenue, and a solid order outlook from the Japan market. In China, Pegavision remains cautious on the price war despite its China revenue rising 10% YoY in 1H26. For 2026-28, Pegavision aims for revenue to grow a double digit % YoY vs. its 1H26 revenue growth of 24.2% YoY. It plans to launch its new Vietnam plant in 2027. We raise our 2026-27E EPS by 11-18%, mainly on our more aggressive revenue forecasts, and introduce our 2028 forecasts.
What we recommend: We reaffirm our Outperform (2) rating and raise our 12M TP to TWD375 (from TWD335), now based on a PER of 14x (from 15x) on its slightly decelerating earnings momentum, lower than the midpoint (16x) of its past-3-year trading range of 10-22x, applied to our 12month forward EPS forecast. However, we believe the launch of silicone hydrogel contact-lens products will likely be a share-price catalyst, with a dividend yield of 3.1-3.8% over 2026-28E to support the share price. Downside risks: a macroeconomic slowdown and increased competition.
How we differ: Our 2027E EPS is 8% below Bloomberg consensus, likely as we are more conservative on Pegavision's revenue expansion.
31 July 2026
Daiwa
Outperform
5
Helen Chien
Helen Chien
(886) 2 8758 6254
helen.chien@daiwacm-cathay.com.tw
Neil Teng, CFA (886) 2 8758 6256 neil.teng@daiwacm-cathay.com.tw
Forecast revisions (%)
| Year to 31 Dec | 26E | 27E | 28E |
|---|---|---|---|
| Revenue change | 7.9 | 9.9 | n.a. |
| Net profit change | 17.6 | 11.3 | n.a. |
| Core EPS (FD) change | 17.7 | 11.4 | n.a. |
Source: Daiwa forecasts
Share price performance
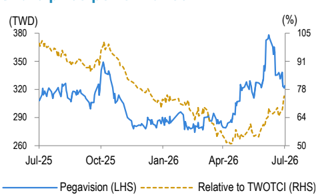
| 12-month range | 274.50-378.00 |
|---|---|
| Market cap (USDbn) | 0.78 |
| 3m avg daily turnover (USDm) | 6.35 |
| Shares outstanding (m) | 78 |
| Major shareholder | Kinsus investment (30.3%) |
Financial summary (TWD)
| Year to 31 Dec | 26E | 27E | 28E |
|---|---|---|---|
| Revenue (m) | 8,271 | 9,098 | 10,008 |
| Operating profit (m) | 2,270 | 2,458 | 2,696 |
| Net profit (m) | 2,046 | 2,156 | 2,388 |
| Core EPS (fully-diluted) | 26.054 | 27.452 | 30.409 |
| EPS change (%) | 26.4 | 5.4 | 10.8 |
| Daiwa vs Cons. EPS (%) | 2.2 | (8.2) | n.a. |
| PER (x) | 12.4 | 11.8 | 10.7 |
| Dividend yield (%) | 3.1 | 3.6 | 3.8 |
| DPS | 10.0 | 11.8 | 12.4 |
| PBR (x) | 2.1 | 1.9 | 1.7 |
| EV/EBITDA (x) | 6.8 | 6.0 | 5.2 |
| ROE (%) | 17.3 | 17.1 | 17.1 |
Source: FactSet, Daiwa forecasts
→
Pegavision: revisions to revenue and earnings forecasts
| 2026E | 2026E | 2026E | 2027E | 2027E | 2027E | 2028E | 2028E | 2028E | |
|---|---|---|---|---|---|---|---|---|---|
| (TWDm) | Previous | New | Consensus | Previous | New | Consensus | Previous | New | Consensus |
| Revenue | 7,666 | 8,271 | 8,376 | 8,279 | 9,098 | 9,634 | n.a. | 10,008 | n.a. |
| Diff (%) | 7.9% | -1.3% | 9.9% | -5.6% | n.a. | n.a. | |||
| Gross margin (%) | 53.0% | 52.8% | 53.4% | 53.5% | 52.9% | 54.1% | n.a. | 53.1% | n.a. |
| Operating profit | 2,027 | 2,270 | 2,358 | 2,238 | 2,458 | 2,816 | n.a. | 2,696 | n.a. |
| Operating margin (%) | 26.4% | 27.4% | 28.2% | 27.0% | 27.0% | 29.2% | n.a. | 26.9% | n.a. |
| Net profit | 1,740 | 2,046 | 1,991 | 1,936 | 2,156 | 2,334 | n.a. | 2,388 | n.a. |
| Diluted EPS (TWD) | 22.14 | 26.05 | 25.49 | 24.64 | 27.45 | 29.92 | n.a. | 30.41 | n.a. |
| Diff (%) | 17.7% | 2.2% | 11.4% | -8.2% | n.a. | n.a. |
Source: Bloomberg, Daiwa forecasts
Pegavision: quarterly and annual P&L statement
| 2026E | 2026E | 2026E | 2026E | ||||||||
|---|---|---|---|---|---|---|---|---|---|---|---|
| (TWDm) | 1Q | 2QE | 3QE | 4QE | 1QE | 2QE | 3QE | 4QE | 2026E | 2027E | 2028E |
| Revenue | 1,886 | 2,115 | 2,130 | 2,141 | 2,065 | 2,200 | 2,400 | 2,433 | 8,271 | 9,098 | 10,008 |
| Gross profit | 1,006 | 1,120 | 1,118 | 1,124 | 1,097 | 1,173 | 1,265 | 1,282 | 4,368 | 4,816 | 5,314 |
| Operating profit | 543 | 585 | 564 | 578 | 601 | 579 | 629 | 650 | 2,270 | 2,458 | 2,696 |
| Pre-tax profit | 566 | 650 | 606 | 616 | 644 | 628 | 682 | 697 | 2,438 | 2,652 | 2,935 |
| Net profit | 472 | 544 | 510 | 519 | 523 | 510 | 555 | 567 | 2,046 | 2,156 | 2,388 |
| Basic EPS (TWD) | 6.06 | 7.07 | 6.55 | 6.66 | 6.71 | 6.55 | 7.12 | 7.27 | 26.24 | 27.65 | 30.63 |
| Operating Ratios | |||||||||||
| Gross margin | 53.3% | 53.0% | 52.5% | 52.5% | 53.1% | 53.3% | 52.7% | 52.7% | 52.8% | 52.9% | 53.1% |
| Operating margin | 28.8% | 27.6% | 26.5% | 27.0% | 29.1% | 26.3% | 26.2% | 26.7% | 27.4% | 27.0% | 26.9% |
| Pre-tax margin | 30.0% | 30.7% | 28.5% | 28.8% | 31.2% | 28.6% | 28.4% | 28.7% | 29.5% | 29.2% | 29.3% |
| Net margin | 25.0% | 25.7% | 24.0% | 24.2% | 25.3% | 23.2% | 23.1% | 23.3% | 24.7% | 23.7% | 23.9% |
| YoY (%) | |||||||||||
| Net revenue | 18.3% | 30.0% | 12.8% | 10.9% | 9.5% | 4.0% | 12.7% | 13.7% | 17.5% | 10.0% | 10.0% |
| Gross profit | 14.5% | 35.3% | 16.9% | 10.7% | 9.0% | 4.7% | 13.1% | 14.1% | 18.8% | 10.3% | 10.3% |
| Operating profit | 25.9% | 54.3% | 17.5% | 11.9% | 10.7% | -1.0% | 11.4% | 12.4% | 25.6% | 8.3% | 9.7% |
| Pre-tax profit | -2.5% | 68.8% | 19.9% | 12.5% | 13.7% | -3.3% | 12.6% | 13.2% | 20.8% | 8.8% | 10.7% |
| Net profit | -3.5% | 73.6% | 28.6% | 21.1% | 10.8% | -6.2% | 8.7% | 9.3% | 25.7% | 5.4% | 10.8% |
| QoQ (%) | |||||||||||
| Net revenue | -2.3% | 12.1% | 0.7% | 0.5% | -3.6% | 6.5% | 9.1% | 1.4% | |||
| Gross profit | -1.0% | 11.4% | -0.2% | 0.5% | -2.5% | 6.9% | 7.9% | 1.4% | |||
| Operating profit | 5.0% | 7.7% | -3.4% | 2.4% | 3.9% | -3.7% | 8.7% | 3.3% | |||
| Pre-tax profit | 3.4% | 14.7% | -6.7% | 1.7% | 4.6% | -2.5% | 8.6% | 2.2% | |||
| Net profit | 10.2% | 15.2% | -6.2% | 1.7% | 0.9% | -2.5% | 8.7% | 2.2% |
Source: Company, Daiwa forecasts
Pegavision: 2Q26 results review
| (TWDm) | Pegavision's 2Q26 results | Daiwa forecast | Differ | Bloomberg consensus | Differ |
|---|---|---|---|---|---|
| Revenue | 2,115 | 1,850 | 14.3% | 2,092 | 1.1% |
| Gross profit | 1,120 | 981 | 14.3% | 1,112 | 0.7% |
| Operating profit | 585 | 472 | 23.9% | 591 | -1.0% |
| Profit before tax | 650 | 502 | 29.3% | 602 | 7.9% |
| Net profit | 544 | 407 | 33.8% | 492 | 10.6% |
| Basic EPS (TWD) | 7.07 | 5.21 | 35.7% | 6.29 | 12.5% |
| Margin | |||||
| Gross margin | 53.0% | 53.0% | 0pp | 53.2% | -0.2pp |
| Operating margin | 27.6% | 25.5% | 2.1pp | 28.2% | -0.6pp |
| Pre-tax margin | 30.7% | 27.2% | 3.6pp | 28.8% | 1.9pp |
| Net margin | 25.7% | 22.0% | 3.8pp | 23.5% | 2.2pp |
Source: Company, Bloomberg, Daiwa forecasts
Pegavision: revenue by region
Source: Company, Daiwa forecasts
Pegavision: 1-year forward PER bands
Source: Bloomberg, Daiwa forecasts
Pegavision Corp (6491 TT): 31 July 2026
Daiwa
Financial summary
Key assumptions
| Year to 31 Dec | 2021 | 2022 | 2023 | 2024 | 2025 | 2026E | 2027E | 2028E |
|---|---|---|---|---|---|---|---|---|
| revenue YoY growth - Other Asia (%) | 49.8 | 12.7 | 7.5 | (1.7) | 2.5 | 15 | 10 | 10 |
| revenue YoY growth - Taiwan (%) | (4) | 21 | 15 | 1 | 10 | 15 | 10 | 10 |
| revenue YoY growth - Other (%) | 46.0 | 4.1 | (7.7) | 32.6 | 0.2 | 52 | 10 | 10 |
Profit and loss (TWDm)
| Year to 31 Dec | 2021 | 2022 | 2023 | 2024 | 2025 | 2026E | 2027E | 2028E |
|---|---|---|---|---|---|---|---|---|
| Other Asia | 4,585 | 5,165 | 5,551 | 5,455 | 5,590 | 6,429 | 7,071 | 7,779 |
| Taiwan | 638 | 769 | 881 | 888 | 974 | 1,120 | 1,232 | 1,355 |
| Other Revenue | 372 | 387 | 358 | 474 | 475 | 723 | 795 | 874 |
| Total Revenue | 5,595 | 6,321 | 6,790 | 6,817 | 7,039 | 8,271 | 9,098 | 10,008 |
| Other income | 0 | 0 | 0 | 0 | 0 | 0 | 0 | 0 |
| COGS | (2,631) | (3,006) | (3,122) | (2,993) | (3,361) | (3,903) | (4,282) | (4,695) |
| SG&A | (958) | (920) | (1,095) | (1,091) | (1,247) | (1,431) | (1,581) | (1,717) |
| Other op.expenses | (547) | (576) | (592) | (646) | (625) | (668) | (778) | (901) |
| Operating profit | 1,460 | 1,820 | 1,981 | 2,087 | 1,807 | 2,270 | 2,458 | 2,696 |
| Net-interest inc./(exp.) | 0 | (14) | (16) | (33) | (7) | 118 | 194 | 240 |
| Assoc/forex/extraord./others | (16) | 11 | 13 | 79 | 219 | 50 | 0 | 0 |
| Pre-tax profit | 1,444 | 1,817 | 1,979 | 2,133 | 2,019 | 2,438 | 2,652 | 2,935 |
| Tax | (196) | (272) | (301) | (279) | (368) | (373) | (477) | (528) |
| Min. int./pref. div./others | 0 | (3) | (22) | (23) | (22) | (20) | (19) | (19) |
| Net profit (reported) | 1,249 | 1,542 | 1,656 | 1,831 | 1,628 | 2,046 | 2,156 | 2,388 |
| Net profit (adjusted) | 1,249 | 1,542 | 1,656 | 1,831 | 1,628 | 2,046 | 2,156 | 2,388 |
| EPS (reported)(TWD) | 17.837 | 22.031 | 22.827 | 23.470 | 20.872 | 26.241 | 27.649 | 30.627 |
| EPS (adjusted)(TWD) | 17.837 | 22.031 | 22.827 | 23.470 | 20.872 | 26.241 | 27.649 | 30.627 |
| EPS (adjusted fully-diluted)(TWD) | 17.718 | 21.843 | 22.614 | 23.243 | 20.615 | 26.054 | 27.452 | 30.409 |
| DPS (TWD) | 8.500 | 10.000 | 10.000 | 11.000 | 10.000 | 10.000 | 11.802 | 12.436 |
| EBIT | 1,460 | 1,820 | 1,981 | 2,087 | 1,807 | 2,270 | 2,458 | 2,696 |
| EBITDA | 2,117 | 2,753 | 2,918 | 2,814 | 2,581 | 3,158 | 3,403 | 3,701 |
Cash flow (TWDm)
| Year to 31 Dec | 2021 | 2022 | 2023 | 2024 | 2025 | 2026E | 2027E | 2028E |
|---|---|---|---|---|---|---|---|---|
| Profit before tax | 1,444 | 1,817 | 1,979 | 2,133 | 2,019 | 2,438 | 2,652 | 2,935 |
| Depreciation and amortisation | 657 | 933 | 937 | 727 | 774 | 888 | 945 | 1,006 |
| Tax paid | (196) | (272) | (301) | (279) | (368) | (373) | (477) | (528) |
| Change in working capital | 1,216 | (892) | (4,020) | 2,506 | (97) | (421) | (257) | (211) |
| Other operational CF items | (488) | 461 | 2,205 | (886) | 331 | (299) | (19) | (19) |
| Cash flow from operations | 2,633 | 2,047 | 799 | 4,201 | 2,658 | 2,233 | 2,843 | 3,183 |
| Capex | (1,841) | (1,411) | (1,112) | (3,320) | (1,409) | (1,120) | (1,000) | (1,000) |
| Net (acquisitions)/disposals | 0 | 0 | (2,118) | 963 | (617) | (334) | 0 | 0 |
| Other investing CF items | (9) | (18) | (168) | (120) | (110) | (4) | 0 | 0 |
| Cash flow from investing | (1,849) | (1,429) | (3,398) | (2,476) | (2,136) | (1,458) | (1,000) | (1,000) |
| Change in debt | 206 | 67 | 636 | (380) | 118 | 269 | 0 | 0 |
| Net share issues/(repurchases) | 0 | 0 | 2,480 | 0 | 0 | 0 | 0 | 0 |
| Dividends paid | (350) | (595) | (708) | (780) | (858) | (780) | (921) | (970) |
| Other financing CF items | (28) | (95) | (141) | (68) | (51) | (159) | 0 | 0 |
| Cash flow from financing | (172) | (623) | 2,268 | (1,229) | (790) | (670) | (921) | (970) |
| Forex effect/others | (9) | 1 | (15) | 6 | (25) | 10 | 0 | 0 |
| Change in cash | 603 | (3) | (346) | 502 | (293) | 116 | 923 | 1,213 |
| Free cash flow | 792 | 637 | (312) | 881 | 1,250 | 1,114 | 1,843 | 2,183 |
Source: FactSet, Daiwa forecasts
Pegavision Corp (6491 TT): 31 July 2026
Daiwa
Financial summary continued …
Balance sheet (TWDm)
| Year to 31 Dec | 2021 | 2022 | 2023 | 2024 | 2025 | 2026E | 2027E | 2028E |
|---|---|---|---|---|---|---|---|---|
| Cash & short-term investment | 1,916 | 2,513 | 6,234 | 4,258 | 4,481 | 5,222 | 6,145 | 7,358 |
| Inventory | 574 | 569 | 583 | 671 | 881 | 1,093 | 1,237 | 1,352 |
| Accounts receivable | 634 | 751 | 866 | 827 | 967 | 1,178 | 1,339 | 1,472 |
| Other current assets | 139 | 139 | 191 | 161 | 207 | 265 | 265 | 265 |
| Total current assets | 3,263 | 3,971 | 7,875 | 5,918 | 6,536 | 7,757 | 8,985 | 10,446 |
| Fixed assets | 4,915 | 5,037 | 4,724 | 7,860 | 8,729 | 8,767 | 8,822 | 8,816 |
| Goodwill & intangibles | 14 | 22 | 20 | 22 | 44 | 40 | 40 | 40 |
| Other non-current assets | 373 | 531 | 1,241 | 746 | 865 | 933 | 933 | 933 |
| Total assets | 8,565 | 9,562 | 13,859 | 14,546 | 16,174 | 17,497 | 18,779 | 20,235 |
| Short-term debt | 445 | 289 | 925 | 361 | 573 | 840 | 840 | 840 |
| Accounts payable | 203 | 195 | 233 | 199 | 328 | 361 | 409 | 447 |
| Other current liabilities | 2,131 | 1,958 | 2,148 | 2,230 | 2,917 | 3,568 | 3,568 | 3,568 |
| Total current liabilities | 2,778 | 2,442 | 3,307 | 2,790 | 3,818 | 4,769 | 4,817 | 4,855 |
| Long-term debt | 142 | 365 | 365 | 549 | 454 | 457 | 457 | 457 |
| Other non-current liabilities | 136 | 269 | 207 | 148 | 166 | 164 | 164 | 164 |
| Total liabilities | 3,056 | 3,076 | 3,879 | 3,487 | 4,438 | 5,391 | 5,438 | 5,476 |
| Share capital | 700 | 700 | 780 | 780 | 780 | 780 | 780 | 780 |
| Reserves/R.E./others | 4,786 | 5,727 | 9,128 | 10,186 | 10,851 | 11,229 | 12,484 | 13,921 |
| Shareholders' equity | 5,486 | 6,427 | 9,908 | 10,966 | 11,631 | 12,009 | 13,264 | 14,701 |
| Minority interests | 22 | 58 | 73 | 92 | 105 | 97 | 78 | 58 |
| Total equity & liabilities | 8,565 | 9,562 | 13,859 | 14,546 | 16,174 | 17,497 | 18,779 | 20,235 |
| EV | 23,965 | 23,471 | 20,400 | 22,016 | 21,923 | 21,444 | 20,502 | 19,270 |
| Net debt/(cash) | (1,329) | (1,859) | (4,944) | (3,349) | (3,453) | (3,925) | (4,847) | (6,060) |
| BVPS (TWD) | 78.372 | 91.821 | 127.022 | 140.595 | 149.117 | 153.967 | 170.048 | 188.472 |
Key ratios (%)
| Year to 31 Dec | 2021 | 2022 | 2023 | 2024 | 2025 | 2026E | 2027E | 2028E |
|---|---|---|---|---|---|---|---|---|
| Sales (YoY) | 40.6 | 13.0 | 7.4 | 0.4 | 3.3 | 17.5 | 10.0 | 10.0 |
| EBITDA (YoY) | 44.5 | 30.1 | 6.0 | (3.6) | (8.3) | 22.3 | 7.8 | 8.8 |
| Operating profit (YoY) | 70.6 | 24.6 | 8.9 | 5.3 | (13.4) | 25.6 | 8.3 | 9.7 |
| Net profit (YoY) | 74.5 | 23.5 | 7.4 | 10.6 | (11.1) | 25.7 | 5.4 | 10.8 |
| Core EPS (fully-diluted) (YoY) | 74.4 | 23.3 | 3.5 | 2.8 | (11.3) | 26.4 | 5.4 | 10.8 |
| Gross-profit margin | 53.0 | 52.4 | 54.0 | 56.1 | 52.3 | 52.8 | 52.9 | 53.1 |
| EBITDA margin | 37.8 | 43.5 | 43.0 | 41.3 | 36.7 | 38.2 | 37.4 | 37.0 |
| Operating-profit margin | 26.1 | 28.8 | 29.2 | 30.6 | 25.7 | 27.4 | 27.0 | 26.9 |
| Net profit margin | 22.3 | 24.4 | 24.4 | 26.9 | 23.1 | 24.7 | 23.7 | 23.9 |
| ROAE | 24.8 | 25.9 | 20.3 | 17.5 | 14.4 | 17.3 | 17.1 | 17.1 |
| ROAA | 16.7 | 17.0 | 14.1 | 12.9 | 10.6 | 12.2 | 11.9 | 12.2 |
| ROCE | 26.4 | 27.5 | 21.5 | 18.0 | 14.6 | 17.3 | 17.5 | 17.6 |
| ROIC | 34.4 | 35.1 | 34.8 | 28.5 | 18.5 | 23.4 | 24.2 | 25.7 |
| Net debt to equity | n.a. | n.a. | n.a. | n.a. | n.a. | n.a. | n.a. | n.a. |
| Effective tax rate | 13.5 | 15.0 | 15.2 | 13.1 | 18.2 | 15.3 | 18.0 | 18.0 |
| Accounts receivable (days) | 39.5 | 40.0 | 43.4 | 45.3 | 46.5 | 47.3 | 50.5 | 51.3 |
| Current ratio (x) | 1.2 | 1.6 | 2.4 | 2.1 | 1.7 | 1.6 | 1.9 | 2.2 |
| Net interest cover (x) | n.a. | 130.9 | 126.9 | 63.1 | 255.4 | n.a. | n.a. | n.a. |
| Net dividend payout | 47.7 | 45.4 | 43.8 | 46.9 | 47.9 | 38.1 | 42.7 | 40.6 |
| Free cash flow yield | 3.1 | 2.5 | n.a. | 3.5 | 4.9 | 4.4 | 7.3 | 8.6 |
Source: FactSet, Daiwa forecasts
Company profile
Founded in 2009, Pegavision is a joint venture between Kinsus and Pegatron focusing on the production and sale of soft contact lenses. Pegavision's revenue contribution from OBM (Pegavision) was 20% and ODM was 80% in 2025. The company was listed on Taiwan's main board in October 2019.
Pegavision Corp (6491 TT): 31 July 2026
Daiwa
ESG analysis
ESG risks
| Risks | Management | Analyst comments | |
|---|---|---|---|
| G | Executive/board quality | 2 | The CEO and chairperson of Pegavision are not the same individual. The company's board consists of 9 members, including 3 independent directors. We note the board members come from diverse backgrounds, indicating their capabilities in handling various challenges that may arise. |
| Capital management | 2 | Pegavision's dividend payout ratio was only 17% for 2018, but was 38-49% over 2019-25, which we consider fair (lower than St. Shine and Ginko) due to its more aggressive capacity expansion plans. The company aims for a long-term dividend payout ratio of 50%. | |
| S | Related party & transaction | 2 | We note no major revenue exchange from related-party transactions; thus, we see marginal related-party risk. |
| Product quality & safety | 1 | Pegavision has a significantly more aggressive R&D investment strategy than peers, which we consider positive for its product quality and development going forward. As contact lenses are considered healthcare products, the company acquired international certifications for product quality and safety, including those from TFDA (Taiwan), ISO13485, CE Certificate (Europe), QMS & PMDA (Japan), NMPA (China), FDA (US) and GMP (Taiwan and Korea). It also passed the ISO14001 certification that mandates adherence to environment-related requirements. We believe Pegavision has put significant efforts in this area. Pegavision's product packaging labels and instructions for use comply with the international | |
| S | Selling practices & product labelling | 1 | ISO standard for medical equipment. The company also has high after-sales service operation standards. In 2025, there were no violations of product- or service-related health and safety regulations and we do not note any specific risks in this area. |
Note: Management score represents a company's ability to manage/benefit from certain ESG topics. The scores range from 1 to 3, with 1 being the strongest.
Update Date: 31 Jul 2026
Source: Daiwa, Company
Pegavision Corp (6491 TT): 31 July 2026
Daiwa