PDF 原檔:報告_Daiwa_儒鴻1476_20260806_original.pdf
圖片清單(已驗證 2026-08-07)
| 檔名 | size | 分類 | 親眼所見內容 |
|---|---|---|---|
報告_Daiwa_儒鴻1476_20260806_001.png |
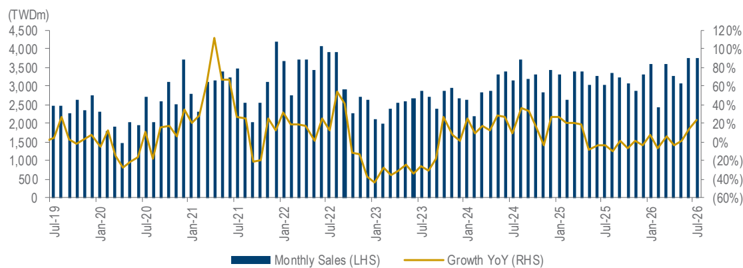
64KB | 真資料圖 | 儒鴻合併月營收長條圖(左軸,藍色柱)疊 YoY 成長率折線圖(右軸,橘色線),橫軸 Jul-19 至 Jul-26;2021 年中出現營收與 YoY 高點(YoY 逼近 100–120%),2023 年初為谷底,2025–2026 年營收回升至歷史相對高檔(約 NT$3,500–4,000m 區間)。 |
原始內容
Eclat Textile (1476 TT)
Share price (6 Aug):
TWD364.50
12-mth rating: Buy (1)
6 August 2026
Consumer Discretionary: Taiwan
2Q26 results: in line with our estimates but missed market expectations
Helen Chien
(886) 2 8758 6254
helen.chien@daiwacm-cathay.com.tw
Neil Teng, CFA
(886) 2 8758 6256
neil.teng@daiwacm-cathay.com.tw
Summary: Eclat posted its 2Q26 results and monthly revenue for July on 6 August 2026 after market hours. Its 2Q26 basic EPS of TWD5.66 was in line with our estimate (TWD5.55) but missed the Bloomberg consensus estimate by 7.6%. Its 2Q26 gross margin came in at 30.0%, also in line with our (30.0%) but missed the consensus (31.1%) estimates. The company plans to have an investor conference on 18 August, and we will provide an update then.
We have a Buy (1) call and 12-month TP of TWD560, based on a target PER of 22x applied to our one-year forward EPS estimate. Please see our latest flash note, 1Q26 results review: solid 2026 outlook on 19 May 2026, for more information on the company.
What's the impact
- 2Q26 results: missed market expectations. Eclat's 2Q26 revenue of TWD10,086m (+4.8% QoQ and +3.8% YoY) was in line with our and the consensus estimates. Its 1Q26 gross margin came in at 30.0% (vs. 32.2% in 1Q26 and 25.7% in 2Q25), in line with our (30.0%) but missing the consensus (31.1%) estimates. However, with higherthan-expected personnel expenses, its operating margin of 19.2% (vs. 22.8% in 1Q26 and 15.4% in 2Q25) missed our estimate (20.2%) and the Bloomberg consensus (21.2%), respectively. Therefore, its operating profit of TWD1,935m (-11.8% QoQ and +28.9% YoY) missed our and the consensus estimates by 6.5% and 10.7%, respectively. With FX gains of c. TWD28m, its net profit came in at TWD1,553m (15.4% QoQ and +158.3% YoY), in line with our estimate but missed the consensus estimates by 8.0%. Its 2Q26 basic EPS was TWD5.66.
Eclat: 2Q26 results vs. Daiwa and Bloomberg forecast
| (TWDm) | Eclat's 2Q26 results | Daiwa forecast | Difference | Bloomberg consensus | Difference |
|---|---|---|---|---|---|
| Revenue | 10,086 | 10,264 | -1.7% | 10,206 | -1.2% |
| Gross profit | 3,027 | 3,079 | -1.7% | 3,176 | -4.7% |
| Operating profit | 1,935 | 2,069 | -6.5% | 2,167 | -10.7% |
| Profit before tax | 2,009 | 2,100 | -4.4% | 2,198 | -8.6% |
| Net profit | 1,553 | 1,522 | 2.0% | 1,688 | -8.0% |
| Basic EPS (TWD) | 5.66 | 5.55 | 2.1% | 6.13 | -7.6% |
| Margin | |||||
| Gross margin | 30.0% | 30.0% | 0pp | 31.1% | -1.1pp |
| Operating margin | 19.2% | 20.2% | -1pp | 21.2% | -2.1pp |
| Pre-tax margin | 19.9% | 20.5% | -0.5pp | 21.5% | -1.6pp |
| Net margin | 15.4% | 14.8% | 0.6pp | 16.5% | -1.1pp |
Source: Company, Bloomberg, Daiwa forecasts
- July revenue ahead of estimates. Eclat reported monthly sales for July of TWD3,752m (-0.3% MoM and +23.3% YoY; +6.0% for 7M26), which accounted for 35.7% and 35.9%, respectively, of our (TWD10,500m, +6.9% QoQ and +9.0% YoY) and the Bloomberg consensus forecasts of 3Q26 revenue.
Eclat: consolidated monthly sales
Source: Company
- Recap: 2026 order outlook and gross margin guidance. Its order visibility remains at 6 months, and the company aims to deliver monthly revenue of TWD3bn+ for the remaining months of 2026. Despite the inflationary environment in the US, the company believes order placement momentum remains intact. The order outlook from its key clients is largely on track, with some rush orders in between, despite macro uncertainty. The latest gross margin guidance for 2026 is still 28-32%. Its mid- to longterm revenue drivers are new product development (including functionality upgrades and high value-added products) on top of its innovation capability.
What we recommend
We have a Buy (1) call and 12-month TP of TWD560, based on a target PER of 22x applied to our one-year forward EPS estimate. The stock is currently trading at PERs of 14.7/13.5x, based on our 2026/27E EPS, vs. its past-3-year trading range of 12-26x. Key downside risks: slower-than-expected gross-margin expansion, lower-than-expected demand, and inflation.
In the interests of timeliness, this document has not been edited.